City, University of London Institutional Repository
Citation
:
Cristofaro, M., Edelbauer, W., Koukouvinis, F. and Gavaises, M. ORCID:0000-0003-0874-8534 (2018). Large Eddy Simulation of the internal injector flow during pilot injection. Paper presented at the The 10th International Symposium on Cavitation (CAV2018), 14-16 May 2018, Baltimore, USA.
This is the accepted version of the paper.
This version of the publication may differ from the final published
version.
Permanent repository link:
http://openaccess.city.ac.uk/21939/Link to published version
:
Copyright and reuse:
City Research Online aims to make research
outputs of City, University of London available to a wider audience.
Copyright and Moral Rights remain with the author(s) and/or copyright
holders. URLs from City Research Online may be freely distributed and
linked to.
Large Eddy Simulation of the internal injector flow during pilot injection
1,2Marco Cristofaro*; 1Wilfried Edelbauer; 2Phoevos Koukouvinis; 2Manolis Gavaises
1AVL List GmbH, Hans List Platz 1, 8020 Graz, AT; 2City University London, Northampton Square EC1V 0HB, UK
Abstract
The aim of this work is to simulate the internal flow of a Diesel injector during an entire pilot injection event. In common rail systems a small quantity of fuel can be injected before the main injection is started. This increases the temperature in the combustion chamber and improves the combustion, leading to higher engine efficiency and reduced emissions. The internal nozzle flow during this short event is highly dynamic and vapor cavities may appear at the end of the injection. In order to study the flow characteristics, a numerical methodology based on the Eulerian multi-fluid approach is adopted. The filtered Navier-Stokes equations are discretized with the finite volume method and then solved with an implicit pressure-based solver. The flow field is modelled considering single pressure and velocity fields. The Coherent Structure Model is used to derive the eddy viscosity applied to the Large Eddy Simulation approach. The liquid evaporation rate is evaluated with a cavitation model based on the Rayleigh-Plesset equation for a single bubble. Even though thermodynamic equilibrium is not satisfied a priori, the main parameter is adjusted in order to limit the thermodynamic states to be in a range close to the equilibrium conditions. The liquid compressibility is modelled with a linear correlation between pressure and density variations. The needle longitudinal movement obtained from the experiments is applied to the simulation. The adopted geometry is the Spray A case defined by the Engine Combustion Network. It is an asymmetric single hole Diesel injector that has been extensively studied in the past both experimentally and numerically. The injection pressure is 1,500 [bar] and the ambient pressure is 60 [bar] with a fuel temperature of 363 K inside the injector. Pure n-dodecane is used as fluid in order to have a precise specification of the physical properties. Although both experiments and simulations showed no cavitation for completely open needle at fixed position, recent studies demonstrated that phase-change of the liquid can appear during the needle closing phase. Cavitation erosion prone locations are then evaluated by recording the maximum intensity of pressure on the surface.
Keywords: LES nozzle flow; pilot injection; needle closing cavitation
Introduction
tunable cavitation model based on single bubble dynamic was applied on a pressure-based solver in order to reduce the presence of negative pressure.
The present work exploits the pressure-based commercial solver FIRE to numerically resolve a three-phase flow [6]. Implicit time integration is adopted, thus avoiding stability constraints on the time step. Liquid phase compressibility is considered with a linearized equation of state and slip velocities between the phases are neglected.
Numerical model
The current numerical approach models a system with three-phases: liquid, vapor and air. The volume fraction of each phase is transported by a corresponding volume fraction equation but single pressure and velocity fields for the mixture are computed (homogeneous mixture hypothesis). The system is supposed to be isothermal at the temperature of 90º [C]. The effect of high temperature outside the nozzle is neglected in the current study, and the spray simulation is beyond the aim of this work. The SIMPLE algorithm is used to solve the pressure-velocity coupling. In the current study the Coherent Structure Model is applied as closure for solving LES as proposed in [7]. A second order differencing scheme is used for the convection terms of the momentum equation. A blending factor of 0.95 with the upwind scheme avoids numerical oscillations. Time derivatives are also obtained with a second order accurate three time level scheme. For further details about the simulation methodology the reader is referred to [6], [8].
In the current approach the cavitation phenomenon is modeled by introducing a mass source term in the liquid and vapor continuity equations. The current model is based on the hypothesis of monodispersed vapor bubbles distribution and on single bubble dynamics considerations. The mass transfer between liquid and vapor is supposed to be the sum of the contribution of a certain number of bubbles behaving identically. The bubbles growth or collapse is computed for a representative bubble size with a simplified version of Rayleigh-Plesset equation, neglecting the acceleration term and the effects of viscosity, temperature and non-condensable gas [9], [10]. The mass transfer term is modeled as:
𝛤 = − 𝜌𝑣 𝑁 4𝜋𝑅2 𝑅̇ = ± 𝜌𝑣 𝑁 4𝜋𝑅2 √|𝑝 − 𝑝𝑣| 𝜌𝑙
In the presented Equation 𝛤 indicates the mass source applied to the liquid continuity equation, 𝜌𝑣 and 𝜌𝑣 are vapor
and liquid densities respectively, 𝑝 is the local pressure and 𝑝𝑣 is the vapor pressure. The vapor bubbles number
density is expressed with 𝑁, while the characteristic bubble dimension and dynamic are represented by an average radius, 𝑅, and its time derivate, 𝑅̇. Local pressure values below the vapor pressure leads the evaporation of liquid, thus the negative sign is taken. Oppositely, pressure higher than vapor pressure causes the vapor to condensate back into liquid, so positive mass source. The same mass source is added to the vapor mass conservation equation, but with opposite sign. The presented single bubble dynamics models do not satisfy a priori the thermodynamic equilibrium, and a finite relaxation time is required for the phase-change to happen depending on the mass transfer and time step. In the current model the mass transfer is tuned with a single parameter, similarly to [5], in order to obtain physically acceptable thermodynamic states. The bubble number density, 𝑁, is then artificially increased to higher values than experimental measurements. The usage of these higher values aims to model the cavitation process to lay between the thermodynamic equilibrium state and the Rayleigh-Plesset equation solution. Furthermore the usage of an artificially increased number density accelerates the condensation process, leading to the formation of pressure waves that can be linked to a cavitation erosion mechanism. In this work a bubble number density value of 1018 [m-3] is adopted.
The used liquid is n-dodecane and the fluid properties are extracted from [11]. The liquid is treated as weakly compressible with a constant speed of sound of 1336 [m/s] and a reference density at 1 [bar] of 704.2 [kg/m3]. The
vapor phase is considered incompressible and the properties are computed at the saturation pressure of 1,276 [Pa]. The air is also treated as incompressible with a density of 57.6 [kg/m3]. The n-dodecane viscosity is obtained from a
linear fit of the experimental data presented in [11]. The derived formulation is: 𝜇(𝑝) =0.493+0.009 𝑝, being 𝑝 the pressure expressed in [MPa] and 𝜇 the molecular dynamic viscosity expressed in [mPa s]. The viscosity of vapor and air are taken constants with values of 5.23 and 18.24 [𝜇Pa s] respectively.
inside the nozzle of 10 [𝜇m] and a fine mesh of 15 million cells, with characteristic length inside the nozzle of 2.5 [𝜇m] and first cell height close to the wall of 0.11 [𝜇m]. For the coarse mesh a time step of 20 [𝜇s] (CFL=1,000) is adopted while for the fine mesh a value of 0.004 [𝜇s] (CFL=0.8) is used.
Results
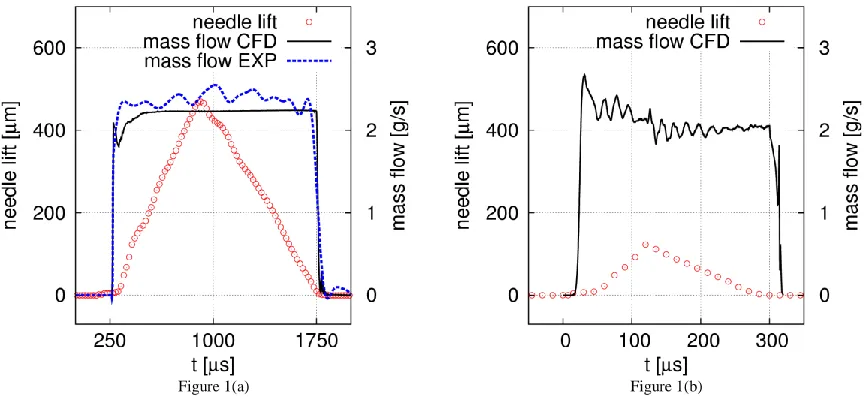
Main and pilot injections are compared in Figure 1. The mass flow through the nozzle hole obtained from the simulations is compared with the experimental measurements for the main injection together with the needle lift profile (Figure 1(a)). For the pilot injection event only the simulation mass flow is presented with the corresponding used needle lift (Figure 1(b)). Due to the available computational budget, the coarse mesh is firstly used for the main injection to validate the simulation methodology while the fine mesh is used for the pilot injection to obtain a more detailed flow description. It has to be noticed that the flow for high values of needle lift is generally quasi-steady, while the most of unsteady phenomena happens at the start and end of the injection. While experimental values are available for the needle lift of the main injection, data do not exist for a pilot injection. Results show a small delay time of 20 [μs] from the needle opening to the actual start of the injection (a reference mass flow of 2 [g/s] is considered) in both pilot and main injection events due to the time required for the fuel to fill the sac and the nozzle. Oscillations in the mass flow are clearly visible in the experimental results for the main injection. In the simulation one fluctuation is present at the beginning, however this is damped immediately and the mass flow remains constant over the rest of the injection probably due to the very large time step. The error for the average mass flows is in the order of 5%. In the pilot injection, higher frequency fluctuations are visible with a period in the order of 20 [μs] that corresponds with the lift profile time discretization. This shows that the fine simulation is strongly affected by changes in the needle velocity. A relation between needle velocity oscillations and mass flow is also visible in the experiments presented in [2].
Figure 1(a) Figure 1(b)
Figure 1 – Main and pilot injection events: needle lift profiles (red circles) and simulations mass flow (continuous black line) for both pilot and main injections and experimental mass flow (blue dashed line) for the main injection only.
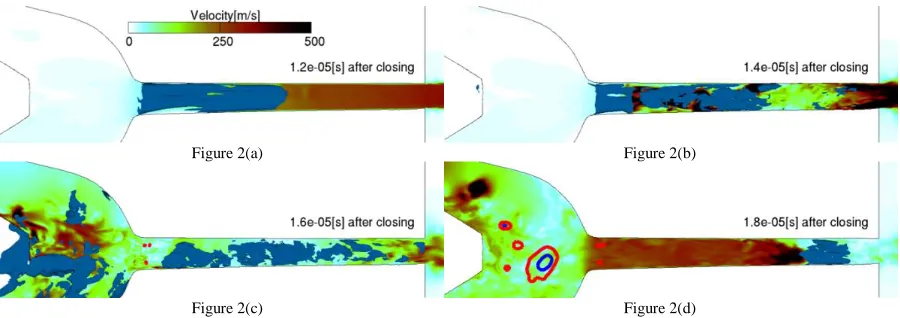
[image:4.612.91.523.353.553.2]The big vapor cavities in the sac collapse as soon as the pressure is recovered, generating values of pressure on the surrounding walls up to 5,000 [bar] (Figure 2(d)).
Figure 2(a) Figure 2(b)
Figure 2(c) Figure 2(d)
Figure 2 – Flow fields at different instants after the needle touches the wall. Y-cut of the velocity field, iso-surface at 0.9 of the vapor volume fraction in blue and iso-lines at 3,500 [bar] (red) and 5,000 [bar] (blue) of the recorded pressure peaks on the walls.
Conclusion
The results of a Large Eddy Simulation during an entire pilot injection of the “Spray A” is presented. The needle lift profile is extracted from the experiments and mass flow results are shown. The model validation was obtained from a main injection event simulated on a coarser mesh in order to reduce the computational cost. Even if no cavitation appears during the steady injection phase, vapor formation appears after the needle touches the seat. Using the fine mesh, very high values of pressure peaks are recorded on the sac and nozzle walls due to the violent collapse of vapor cavities.
Acknowledgments
Financial support from the MSCA-ITN-ETN of the European Union’s H2020 programme, under REA grant agreement n. 642536 is acknowledged. The authors acknowledge the support of Zoran Pavlovic and Mandumpala Devassy Bejoy for the technical support for the creation of the meshes and the needle movement.
References
[1] L. M. Pickett et al., “Comparison of Diesel Spray Combustion in Different High-Temperature, High-Pressure
Facilities,” SAE Int. J. Engines, vol. 3, Oct. 2010.
[2] A. L. Kastengren et al., “Engine Combustion Network (ECN): Measurements Of Nozzle Geometry And Hydraulic
Behavior,” At. Sprays, vol. 22, Jan. 2012.
[3] M. Battistoni, Q. Xue, and S. Som, “Large–Eddy Simulation (LES) of Spray Transients: Start and End of Injection Phenomena,” Oil Gas Sci. Technol., 2016.
[4] F. Örley, S. Hickel, S. J. Schmidt, and N. A. Adams, “Large-Eddy Simulation of turbulent, cavitating fuel flow inside a 9-hole Diesel injector including needle movement,” Int. J. Engine Res., vol. 18, Apr. 2016.
[5] P. Koukouvinis, M. Gavaises, J. Li, and L. Wang, “Large Eddy Simulation of Diesel injector including cavitation effects and correlation to erosion damage,” Fuel, 2016.
[6] AVL LIST GmbH, “FIRE CFD Solver – User Guide.” Hans–List–Platz 1, 8020 Graz, Austria.
[7] H. Kobayashi, “The subgrid-scale models based on coherent structures for rotating homogeneous turbulence and turbulent channel flow,” Phys. Fluids, vol. 17, pp. 45107–2225, 2005.
[8] M. Cristofaro, W. Edelbauer, M. Gavaises, and P. Koukouvinis, “Numerical simulation of compressible cavitating two-phase flows with a pressure-based solver,” in ILASS 2017 - 28th European Conference on Liquid Atomization and Spray Systems, 2017.
[9] J. W. S. Lord Rayleigh, “On the pressure developed in a liquid during the collapse of a spherical cavity,” Philos. Mag.
Ser. 6, vol. 34, pp. 94–98, 1917.
[10] C. E. Brennen, Cavitation and Bubble Dynamics. Oxford University Press, 1995.
[image:5.612.84.534.104.263.2]