ResearchOnline@JCU
This file is part of the following work:
Shah, Syed Azeem Ahmed (2019)
Determinants of public-private-partnership
performance: the case of Pakistan.
PhD Thesis, James Cook University.
Access to this file is available from:
https://doi.org/10.25903/5d5339a29cc07
Copyright © 2019 Syed Azeem Ahmed Shah.
The author has certified to JCU that they have made a reasonable effort to gain
permission and acknowledge the owners of any third party copyright material
included in this document. If you believe that this is not the case, please email
1
Determinants of Public-Private-Partnership Performance: The Case of Pakistan
This thesis is submitted in fulfilment of the requirement for the degree of Doctor of Philosophy (Ph.D.) at James Cook University
By
Syed Azeem Ahmed Shah
Bachelor of Commerce Master of Economics
Master of Business Administration (Finance and Marketing) Certified Public Accountant of Pakistan
Advisory Panel:
Dr Taha Chaiechi Dr A.B.M. Rabiul Alam Beg
Prof Lynne Eagle
College of Business, Law and Governance James Cook University
2
Research Outputs
From thesis Journal Articles
Azeem Shah. (2013). What are the rationales to pursue Public Private Partnerships in Pakistan? The Macrotheme Review, January 2013 Volume 2 Issue 1.
Conference Presentations
Azeem Shah. (2013). What are the rationales to pursue Public Private Partnerships in Pakistan?The Macrotheme Review: Business and Social Science Research Conference: Paris 2012, France, 27 – 28 December, 2012.
Other than thesis Conference Presentations
3
Statement of Original Authorship
The work contained in this thesis has not been previously submitted to meet the requirements for an award at this or any other higher education institution. To the best of my knowledge and belief, the material included in this thesis is original and is an intellectual product of the author of this thesis. Proper citation/ acknowledgment has been made to the work of other authors contained in this thesis.
________________________
Syed Azeem Ahmed Shah
Author
4
Acknowledgments
In the name of Allah, Most Gracious, Most Merciful.
Proclaim! (or read!) in the name of thy Lord and Cherisher, Who created man, out of a (mere) clot of congealed blood. Proclaim! And thy Lord is Most Bountiful. He Who
taught (the use of) the pen. Taught man that which he knew not (Al-'Alaq 96:1-5).
First of all, I am thankful to Almighty Allah for His countless blessings. After that I thank all my supervisors and mentors for their help and support to accomplish this thesis. I thank Dr Taha Chaiechi, primary supervisor, for her support and valuable advice during my thesis writing. I thank Dr Rabiul Beg, secondary supervisor, for his help and support on every step during my candidature. Last but not least, my thanks go to Prof Lynne Eagle, secondary supervisor, for her inspirational and supportive role as professional mentor to complete this thesis.
The journey involved in this scholarly work has been difficult and challenging. Without the contribution of a number of sincere people, this thesis would not have been completed. My sincere gratitude and appreciation go to: my elder brother Syed Nadeem Ahmed Shah, my elder sister Sajida Aqdas, my baby sister Rabia Shahzad Shah, my mother-in-law Shamim Akhtar, my ex-colleague Adnan Mazhar, my friends Rizwan Ahmad, Anees Ahmed and fellow PhD student Muhammad Abid Saleem for their encouragement and moral support.
To my children (Syed Umer Azeem Shah, Warda Jannat Shah, Sara Jannat Shah and Syed Ali Azeem Shah) goes my thanks for their love, prayers, support and encouragement especially during the final stage of my study.
Finally, thank-you to my beloved and beautiful wife and the best friend ever, Dr Seema Azeem Shah, for her love, prayers, encouragement and support right from the beginning of my PhD journey. She has kept me focused on completing this degree. I would not have been able to complete this journey without her companionship. A big Thank-You to her for being with me and keeping me determined to achieve!
________________________
Syed Azeem Ahmed Shah
Author
5
Statement of Contributions of Others
Name of Assistance Contribution
Names, Titles and
Affiliation of Contributors
Supervision Primary Supervisor Dr Taha Chaiechi
Secondary Supervisor Dr A.B.M. Rabiul Alam Beg
Secondary Supervisor Professor Lynne Eagle, James Cook University
Editing Support Copyediting and proofreading services according to the protocols in the
university-endorsed National Guidelines for Editing Research Theses
Dr John Cokley,
6
Abstract
Pakistan is the sixth most populous country in the world with a population of 207.77 million and growth rate of 2.40 percent per annum (Pakistan Bureau of Statistics, 2018). Continual increases in population growth and urbanisation are applying pressure on infrastructure services demand. Currently, the country is unable to finance infrastructure projects through traditional methods. Public finance – due to budget deficit. The provisions of Fiscal Responsibility and Debt Limitation (FRDL) Act 2005 limit federal fiscal deficit to 4 percent of gross domestic product (GDP) and the current budget deficit is 4 percent of GDP. Borrowing – is unavailable because, under lending restrictions in the FRDL Act 2005 public debt is restricted to 60 percent maximum of estimated GDP. Present public debt is 59.2 percent of GDP (Ministry of Finance, 2016). Issuance of international bonds – is not available due to their high susceptibility to event-risk factors. Access to capital markets is limited to only three stock exchanges and stock issuers are unable to use savings from remote areas. There is no availability of long-term lending facilities for infrastructure projects financing. Finally, the government cannot impose new taxes or increase tax rates due to weak economic conditions and political reasons.
Improvements in public infrastructure facilities have not kept pace with population growth and urbanisation. Consequently, the gap between infrastructure services demand and supply is widening. Financial constraint is the major barrier in infrastructure development alongside other problems such as a weak institutional framework, political instability and governance issues. Consequently, Pakistan ranks 115 out of 137 countries in the basic infrastructure category in Global Competitiveness Index 2017-18. Therefore, it is suspected that a large part of the population will not have access to infrastructure facilities in future, if appropriate measures are not taken now.
The present infrastructure demand-supply gap needs to be addressed on priority basis. New avenues to increase infrastructure investment may be found elsewhere, beyond the scope of public resources. Accordingly, Pakistani government needs to adopt innovative approaches to deal with financial constraints for infrastructure development by avoiding future debt traps. Empirical studies suggest that public-private partnerships (PPP) may be a valuable solution to the infrastructure challenge. Therefore, it is ascertained that PPP for infrastructure development is urgently needed in Pakistan and an exploration of the factors helping or impeding their implementation is justified.
7 for infrastructure development are unavailable. There is limited access to the capital market. Institutional structure is ineffective, especially regarding political instability and inconsistency in policy implementation. Finally, microeconomic polices are weak.
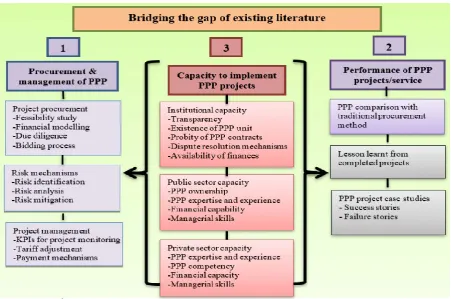
In the current literature, the majority of research focus, primarily within developed countries, has been put on PPP procurement, management and performance of PPP projects and service delivery. However, institutional capacity and the capacity of public and private sectors for implementing PPP projects has been largely ignored, with only a small number of researchers having identified the importance of institutional and public sector capacity for successful implementation of PPP projects. A comprehensive set of criteria and methodology for evaluating their capacity is missing. An extensive review of the available literature suggests that private sector capacity to implement PPP programs has not been assessed so far. Therefore, no previous analytical methodology and research technique was available to evaluate this aspect of PPP. As no studies have been carried out to determine the capacity of institutions, public and the private sector to implement PPP program in the context of Pakistan, this thesis therefore focuses on the determinants of PPP implementation.
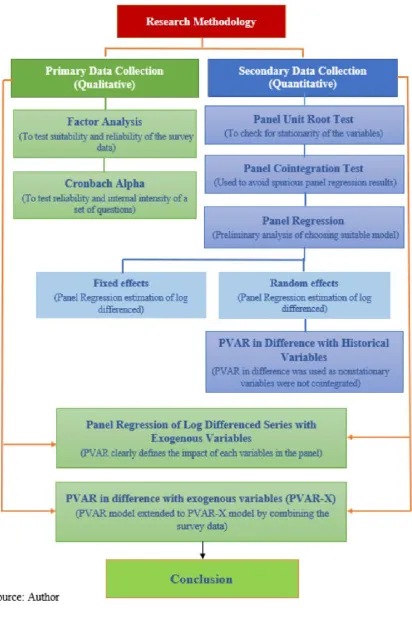
In this thesis, time series and cross-sectional primary and secondary data covering 24 years from 1991 to 2014 was used. Primary data was collected through a survey questionnaire. Secondary data was collected through official websites and financial reports of the government of Pakistan and from the World Bank database. The suitability of questionnaire was verified by using factor analysis. Cronbach’s alpha was used to test reliability and consistency among questionnaire variables. Time series property of the data and unit root non-stationarity of variables within panel framework was conducted by panel unit root tests. Panel cointegration tests were performed among the variables to avoid spurious regression by utilising Persyn and Wasteland tests.
8 The estimation results showed that:
i) Institutions in Pakistan do not have the capacity for managing PPP program. The private sector not only lacks the capacity for participating and managing PPP projects but also are a barrier to infrastructure development;
ii) The public sector has an influence on PPP undertakings for infrastructure development but the sector cannot attract private sector investment due to lack of managerial, financial and monitoring capacity. Further, the public sector does not have the capacity for mitigating project-related risks.
iii) Other factors (barriers) for implementing PPP in Pakistan were also identified, which are: a) lack of good governance – administrative formalities and ambiguous rules and regulations; b) delays/deficiencies in project execution; c) public and private sectors do not have PPP related experience and qualification; and d) feasibility studies and projections for PPP projects are unrealistic.
This thesis contributes to both theoretical and practical aspects of PPP implementation in Pakistan. The findings provide valuable insights on how and why PPP model may or may not work effectively in different institutional settings. These contributions extend the theoretical literature related to PPP implementation, especially in developing economies, and provides policy guidance for the government to remove barriers for implementing and encouraging PPP undertakings in Pakistan. The findings provide guidelines for PPP implementation in Pakistan and the methodology used can be extended to other developing countries and/or multi-country studies for generating useful comparisons and revealing more useful information.
9
Table of Contents
Chapter One: Introduction ... 23
1.1 Background ... 23
1.2 Pakistan: Infrastructure investment as a percentage of GDP ... 25
1.3 Current state of private investment in Pakistan ... 26
1.3.1 Weak institutional arrangements ... 27
1.3.2 Lack of expertise ... 28
1.3.3 Lack of adequate regulatory framework ... 29
1.4 Justification for the Thesis ... 29
1.4.1 Pakistan’s Current Infrastructure Status ... 29
1.4.2 Scarcity of finance/loans ... 30
1.4.3 Brief introduction to PPP... 31
1.5 Research questions and objectives ... 32
1.6 Methodology ... 33
1.7 Econometrics to verify the results ... 35
1.8 Organisation of the Thesis ... 35
Chapter Two: Current Status of Infrastructure in Pakistan ... 37
2.1 Defining infrastructure ... 37
2.1.1 Infrastructure improves standard of living ... 38
2.1.2 Infrastructure has positive effects on business ... 39
2.2 Overview: ownership/control of Pakistani’s infrastructure assets across each sector 39 2.2.1 Population and GDP Trends ... 41
2.2.2 Telecommunications... 42
2.2.3 Power (Electricity) Access and Consumption ... 43
2.2.4 Transport Infrastructure ... 45
2.2.5 Implications of Infrastructure Deficiencies ... 50
2.2.6 Summary... 53
2.3 Infrastructure investment planning, policies and trend in Pakistan ... 56
2.3.1 Telecommunications... 59
2.3.2 Power ... 60
2.3.3 Transport... 66
2.4 Causes of insufficient infrastructure facilities in Pakistan ... 71
2.4.1 Lack of managerial capacity and skilled human resources ... 71
2.4.2 Lack of financial resources and budgetary constraints ... 72
2.5 Infrastructure projects financing models ... 74
2.5.1 Possible options for Pakistan to finance infrastructure facilities ... 74
2.5.2 Infrastructure project financing structure in Pakistan ... 78
2.6 The way forward ... 86
Chapter Three: Literature Review ... 87
3.1 Evolution of public-private partnerships ... 87
3.2 Origin of PPP ... 87
10
3.4 Definition and characteristics of PPP ... 97
3.5 Evaluation of PPP ... 99
3.5.1 Advantages/benefits/value of PPP ... 99
3.5.2 Weaknesses/disadvantages of PPP ... 102
3.5.3 Contribution of PPP to economic growth ... 105
3.6 Implementation of PPP ... 108
3.6.1 Essential ingredients to carry out PPP ... 108
3.6.2 Barriers to implementation of successful PPP in infrastructure development123 3.6.3 PPP studies in the context of South Asia... 126
3.7 Role of institutions and private-sector participation in infrastructure development 126 3.8 Review of investment theories ... 133
3.8.1 Neoclassical theory of investment (NTI) ... 133
3.8.2 Keynesian investment theory ... 134
3.8.3 Post-Keynesian investment theory ... 135
3.8.4 Conclusion of investment theories ... 138
3.9 Scope of the literature review ... 140
3.10 Literature review conclusions ... 141
3.10.1 Concluding remarks... 142
3.10.2 PPP is a valuable solution to the current infrastructure challenges in Pakistan142 3.11 Identification of literature gaps ... 143
Chapter Four: Research Methodology ... 146
4.1 Conceptual Considerations ... 146
4.2 Research questions and research hypotheses ... 148
4.3 Research Methodology ... 152
4.4 Estimation approaches ... 156
4.4.1 Primary (qualitative) data collection ... 158
4.4.2 Secondary data collection (Quantitative) ... 159
4.5 Data 165
Chapter Five: The Survey and Preliminary Results ... 167
5.1 The Survey ... 167
5.1.1 The questionnaire ... 167
5.1.2 Administration of the survey ... 170
5.1.3 Challenges in the initial data collection... 171
5.2 Descriptive statistics and preliminary results ... 173
5.2.1 Description of the survey participants (Question set 1 and 2) ... 173
5.2.2 The importance of infrastructure (Question set 3-A) ... 175
5.2.3 Infrastructure and the economic growth of Pakistan (Question set 3-B) ... 177
5.2.4 Private sector investment and the performance of public organisations ... 178
5.2.5 Public sector capacity to manage PPP programs in Pakistan ... 180
5.2.6 Private sector capacity to manage PPP programs in Pakistan ... 182
5.2.7 Sector-wide institutional capacity to manage PPP programs in Pakistan .... 184
11 5.2.10 Barriers to PPP program implementations in the telecommunications industry189
5.2.11 Barriers to PPP program implementations in the power industry ... 192
5.2.12 Barriers to PPP programs implementations in the transport industry ... 195
5.3 Summary of the survey results ... 197
Chapter Six Empirical Results and Interpretation... 198
6.1 Data analysis for quality test of the instrument ... 198
6.1.1 Factor analysis ... 199
6.1.2 Cronbach alpha ... 200
6.2 Quantitative data analysis ... 201
6.2.1 Panel unit root tests ... 201
6.2.2 Panel Cointegration test ... 202
6.3 Estimation of panel regression ... 203
6.3.1 Estimation of random effects panel regression of log differenced series ... 204
6.4 Estimation of panel regression with exogenous variables ... 206
6.4.1 Estimation of panel regression of log differenced series with exogenous variables ... 206
6.5 Estimation of PVAR model ... 211
6.5.1 Estimation of PVAR in difference with historical variables ... 211
6.6 Estimation of PVAR in difference with exogenous variables (PVAR-X) ... 215
6.6.1 Empirical results PVAR – X total investment ... 215
6.6.2 Empirical results PVAR – X private investment ... 223
6.6.3 Empirical results PVAR – X public investment ... 230
6.7 Hypotheses tests for the research questions ... 236
6.7.1 Hypotheses test results of random effects Panel regression model ... 236
6.7.2 Hypotheses test results in Panel vector auto regression combining with survey data (PVAR-X) model ... 240
6.8 Summary of empirical results ... 243
Chapter Seven Conclusions ... 245
7.1 Findings and conclusions ... 245
7.1.1 Findings ... 245
7.1.2 Conclusions ... 247
7.2 Significance and contributions... 247
7.2.1 Contribution to research methodology ... 248
7.2.2 Contribution to the policy debate ... 249
7.3 Implications ... 249
7.4 Limitations and future research ... 249
Appendices ... 250
Appendix I:
Credit rating tiers ... 251
Appendix II:
Rating tier definitions ... 252
Appendix III:
Public sector survey questionnaire ... 253
12
Appendix V:
Information sheet of survey questionnaire ... 269
Appendix VI:
Factor analysis results along with scree plots ... 270
Appendix VII:
Panel unit root tests on log series... 278
Appendix VIII:
Random effects panel regression estimation of log
differenced of total investment – The GLS estimation ... 279
Appendix IX:
Random effects panel regression of log differenced of private
investment – The GLS estimation ... 280
Appendix X:
Random effects panel regression of log differenced of public
investment – The GLS estimation ... 281
Appendix XI:
Random effects panel regression of log differenced series and
series and exogenous variable total investment– The GLS estimation 282
Appendix XII:
Random effects panel regression with log differenced series
and exogenous variable private investment– The GLS estimation ... 283
Appendix XIII:
Random effects panel regression with log differenced series
and exogenous public investment– The GLS estimation ... 284
Appendix XIV:
Impulse Response Function of PVAR – X Investment Shock
to Total Investment ... 285
Appendix XV:
Impulse Response Function of PVAR – X Investment Shock
to Real GDP 287
Appendix XVI:
Impulse Response Function of PVAR – X Investment Shock
to Interest Rate ... 289
Appendix XVII:
Impulse Response Function of PVAR – X Private
Investment Shock to Private Investment ... 291
Appendix XVIII:
Impulse Response Function of PVAR – X Private
Investment Shock to Real GDP ... 293
Appendix XIX:
Impulse Response Function of PVAR – X Private Investment
Shock to Interest Rate ... 295
Appendix XX:
Impulse Response Function of PVAR – X Public Investment
Shock to Public Investment ... 297
Appendix XXI:
Impulse Response Function of PVAR – X Public Investment
Shock to Real GDP ... 299
Appendix XXII:
Impulse Response Function of PVAR – X Public Investment
13
List of Tables
Table 1.1: Comparison of population growth rate (%) of Pakistan and South Asian countries
1960-2017 23
Table 1.2: Pakistan’s financial indicators (as percentage of GDP) 26
Table 1.3: Comparison of domestic credit to private sector (% of GDP) in South Asian countries
1990-2017 27
Table 1.4: Comparison of urbanisation across South Asian countries at 2015 30
Table 1.5: Pakistan’s ranking in the basic determinants of GCI 30
Table 1.6: Overview of the research design and thesis contribution 34
Table 2.1: Comparative Indicators of Infrastructure across South Asian Countries 40
Table 2.2: Population growth and GDP from 1960 to 2015 41
Table 2.3: Comparative data of telecommunication from 1960 to 2015 42
Table 2.4: Comparative access and consumption data for the power sector from 1960 to 2015 44
Table 2.5: Comparative data for the road sector from 1960 to 2015 45
Table 2.6: Comparative data for the railways sector from 1960 to 2015 48
Table 2.7: Comparative data for aviation from 1960 to 2015 49
Table 2.8: Comparative data for seaports from 1960 to 2015 50
Table 2.9: Major events in Pakistan since independence at a glance 52
Table 2.10: Comparison of infrastructure across South Asian countries at 2015 55
Table 2.11: Details of Five-Year Development Plan 57
Table 2.12: IPPs power projects announced by the Government of Pakistan 62
Table 2.13: List of Power Plants that have Started Operation since 2015 65
Table 2.14: Detail of Seaports in Pakistan 69
Table 2.15: Public Debt as percentage of GDP 73
Table 2.16: Debt credit rating of Pakistan 74
Table 2.17: Broad Sectoral Allocations of Federal PSDP 2011-12 and 2012-13 (Rs Billion) 79 Table 2.18: Private Sector Participation in Infrastructure in Pakistan from 1990 to 2011 (US$ million)
84 Table 2.19: Private Participation in Infrastructure Development by Region from 1990 to 2011 (US$
million) 85
Table 3.1: Common features of PPP definitions 99
Table 3.2: Advantages/benefits/value of PPP 101
Table 3.3: Disadvantages/weaknesses of PPP 103
Table 3.4: Key elements for PPP program implementation in Mexico 109
Table 3.5: Key challenges for PPP program implementation in Mexico 109
Table 3.6: Indicators of financial development 119
Table 3.7: Functional classification of capacity 120
Table 3.8: Level classification of capacity 121
Table 3.9: Summary of major success factors of PPP implementation 122
Table 3.10: Generic barriers in PPP implementation 124
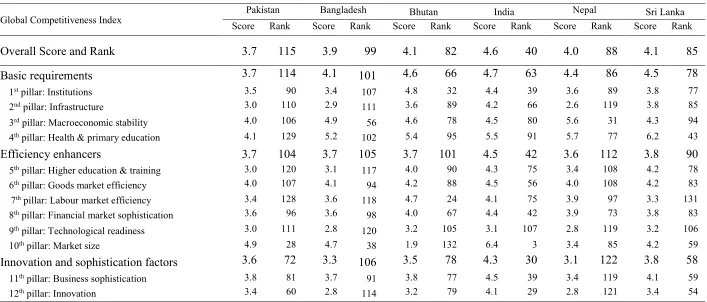
Table 3.11: Pakistan’s overall score and rank in Global Competitiveness Index 2007-08 to 2017- 18 131 Table 3.12: Comparison of GCI 2017-18 in South Asian countries (Score out of 7, Rank out of 138)
132
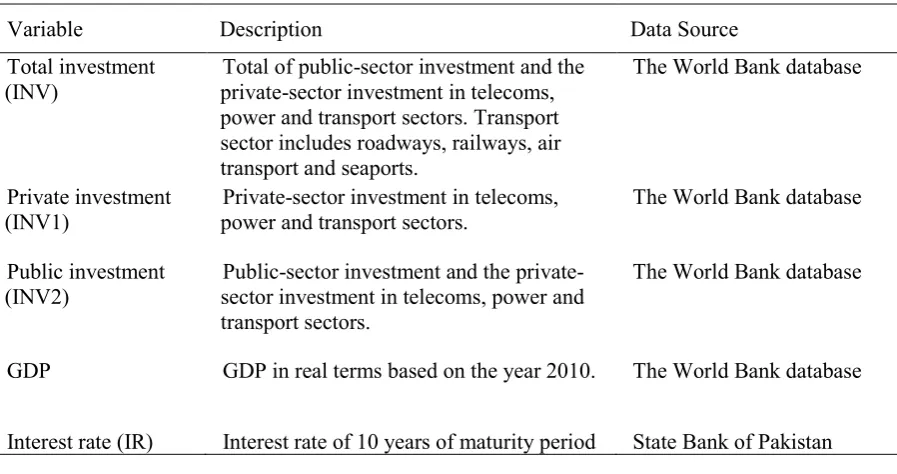
Table 4.1: Summary of quantitative variables for the period 1991-2014 166
Table 5.1: Sector-wide detail of data collection 173
Table 5.2: Industry-wide detail of data collection 173
Table 5.3: Descriptive statistics of participants 174
Table 5.4: Infrastructure and performance of your organisation 176
Table 5.5: Infrastructure and the economic growth of Pakistan 177
14
Table 5.7: Public sector capacity to manage PPP program in Pakistan 180
Table 5.8: Public sector capacity to manage PPP programs in Pakistan 181
Table 5.9: Private sector capacity to manage PPP programs in Pakistan 182
Table 5.10: Private sector capacity to manage PPP programs in Pakistan 183
Table 5.11: Sector-wide institutional capacity to manage PPP programs in Pakistan 184
Table 5.12: Sector-wide institutional capacity to manage PPP programs in Pakistan 185
Table 5.13: Industry-wide institutional capacity to manage PPP programs in Pakistan 186
Table 5.14: Industry-wide institutional capacity to manage PPP programs in Pakistan 187
Table 5.15: Industry-wide availability of guidance materials 188
Table 5.16: Barriers to implementing PPP programs in the telecommunications industry 190
Table 5.17: Barriers to implementing PPP program in telecommunications industry 191
Table 5.18: Barriers to implementing PPP programs in the power industry 193
Table 5.19: Barriers to implementing PPP programs in the power industry 194
Table 5.20: Barriers to implementing PPP programs in the transport industry 195
Table 5.21: Barriers to implementing PPP programs in the transport industry 196
Table 6.1: Question X1 retains one factor 199
Table 6.2: Cronbach
for checking internal consistency and reliability of the items in thequestionnaire 200
Table 6.3: Panel cointegration tests of total investment (public and private) 202
Table 6.4: Panel cointegration tests of private investment 202
Table 6.5: Panel cointegration tests of public investment 203
Table 6.6: Hausman test random effects versus fixed effects 203
Table 6.7: Eigenvalue for stability condition 212
Table 6.8: Eigenvalue for stability condition 213
Table 6.9: Eigenvalue for stability condition 214
Table 6.10: Empirical results of PVAR – X (investment, GDP, and IR are the dependent variables list
with exogenous variables) model estimated by GMM 215
Table 6.11: Eigenvalue for stability condition 217
Table 6.12: Granger causality test in PVAR investment 218
Table 6.13: Forecast-error variance decomposition 219
Table 6.14: Responses of investment, real GDP and interest rate due to shock in investment 220
Table 6.15: Responses of investment, interest rate and real GDP due to shock in real GDP 221
Table 6.16: Responses of investment, real GDP and interest rate due to shock in interest rate 222 Table 6.17: Empirical results PVAR – X (private investment, GDP, and IR are in the dependent
variable list) with exogenous variables estimated by GMM 223
Table 6.18: Eigenvalue for stability condition 224
Table 6.19: Granger causality test in PVAR: private investment 225
Table 6.20: Forecast-error variance decomposition 226
Table 6.21: Responses of private investment, real GDP and interest rate due to shock in private
investment 227
Table 6.22: Responses of private investment, interest rate and real GDP due to shock in real GDP 228 Table 6.23: Responses of private investment, real GDP and interest rate due to shock in interest rate
229 Table 6.24: Empirical results of PVAR – X (public investment, GDP, and IR are the dependent
variables with exogenous variables) model estimated by GMM. 230
Table 6.25: Eigenvalue for stability condition 232
Table 6.26: Granger causality test in PVAR 232
Table 6.27: Forecast-error variance decomposition 233
Table 6.28: Responses of public investment, real GDP and interest rate due to shock in public
investment 234
15
List of Figures
Figure 1.1: Comparison of population growth rates (%) of Pakistan and South Asia 1960-2017 24
Figure 1.2:Infrastructure investment in Pakistan 1960 – 2016 by percentage of GDP 25
Figure 1.3: Comparison of domestic credit to private sector (% of GDP) in South Asian countries
1990-2017 28
Figure 2.1: Global ICT developments, 1998-2009 43
Figure 2.2: Inadequate transport facilities 46
Figure 2.3: Underdeveloped road infrastructure 46
Figure 2.4: Inadequate railways transport facilities 47
Figure 2.5: Miserable sewage system 47
Figure 2.6: Geographical map of Pakistan 49
Figure 2.7: Bill recoveries and loss reduction (%) 64
Figure 2.8: Total infrastructure investment (public and private) from 1981 to 2009 as percent of GDP 81 Figure 2.9: Electricity sector investment (public and private) from 1981 to 2009 as percent of GDP 82 Figure 2.10: Transportation and communication sector investment (public and private) from 1981 to
2009 as percent of GDP 83
Figure 3.1: Copy of contract of Philadelphia and Lancaster Turnpike Road 90
Figure 3.2: Image of Philadelphia and Lancaster Turnpike Road 91
Figure 3.3: Key elements in creating a PPP enabling environment focusing on India 110
Figure 3.4: Comparison of political stability in South Asian countries in 2016 116
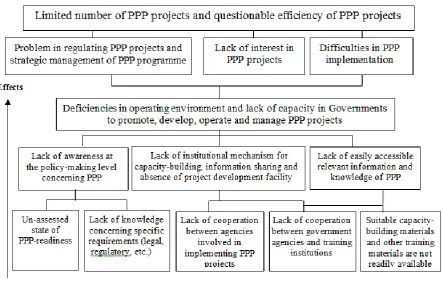
Figure 3.5: Problem Tree Analyses of PPP 123
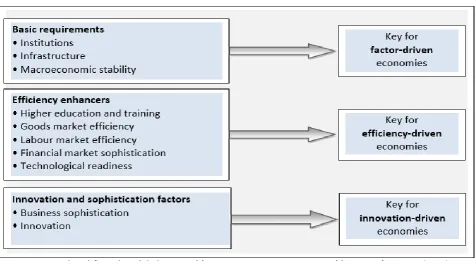
Figure 3.6: The 12 pillars/3 stages of competitiveness 130
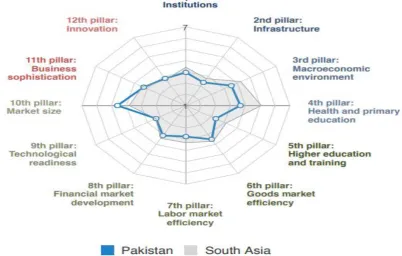
Figure 3.7: Comparison of GCI 2017-18 in South Asian countries (Overall Score 7) 131
Figure 3.8: Summary of existing PPP research 143
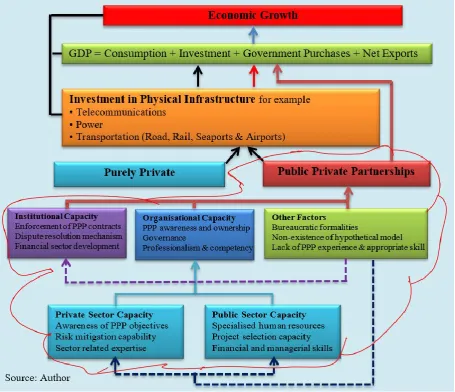
Figure 4.1: Possible interrelationship 147
Figure 4.2: Flowchart of estimation approaches 157
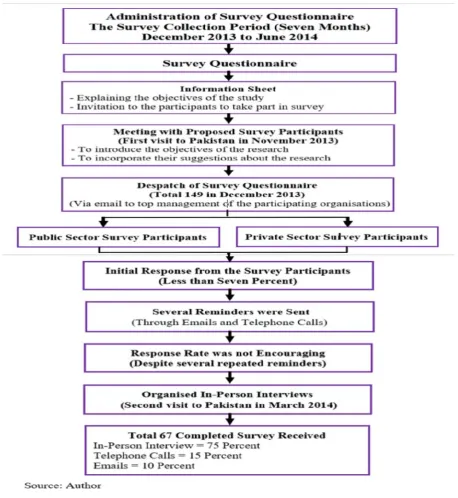
Figure 5.1: Administration of survey questionnaire 172
Figure 5.2: Public sector capacity to manage PPP program in Pakistan 181
Figure 5.3: Public sector capacity to manage PPP programs in Pakistan 182
Figure 5.4: Sector-wide institutional capacity to manage PPP programs in Pakistan 185
Figure 5.5: Industry-wide institutional capacity to manage PPP programs in Pakistan 187
Figure 5.6: Industry-wide availability of guidance materials 189
Figure 5.7: Barriers to implementing PPP programs in the telecommunications industry 191
Figure 5.8: Barriers to implementing PPP programs in the power industry 194
Figure 5.9: Barriers to implementing PPP programs in the transport industry 196
Figure 6.1: Scree plot of eigenvalues after factor 199
Figure 6.2: Eigenvalue for stability condition 212
Figure 6.3: Eigenvalue for stability condition 213
Figure 6.4: Eigenvalue for stability condition 214
Figure 6.5: Eigenvalue for stability condition 217
Figure 6.6: Eigenvalue for stability condition 225
16
List of Abbreviations and Acronyms
ADF Augmented Dickey-Fuller AIC Akaike Information Criterion APEC Asia-Pacific Economic Cooperation BLT Build-Lease-and-Transfer
BOO Build-Own-and-Operate BOT Build-Own-and-Transfer BTO Build-Transfer-and-Operate CAGR Compounded Annual Growth Rate CSF Critical Success Factor
DFBOT Design, Finance, Build, Operate and Transfer ECM Error-Correction Mechanism
AIC Akaike Information Criterion GCI Global Competitiveness Index GFCF Gross Fixed Capital Formation
ICT Information and communication technology IMU Infrastructure Management Unit
IPDF Infrastructure Project Development Facility IPK Institutionalist and Post-Keynesian
KICT Karachi International Container Terminal
KM Kilometer
KPT Karachi Port Trust
KWH Kilowatt-Hour
MDGs Millennium Development Goals MoF Ministry of Finance
MW Mega Watt
NC Neoclassical
NK Neo-Keynesian
NTI Neoclassical Theory of Investment
OECD The Organisation for Economic Co-operation and Development PVAR Panel vector Auto Regression
17 PICT Pakistan International Container Terminal
PK Post-Keynesian
PPIB Private Power & Infrastructure Board PPP, P3,3P Public-Private Partnerships
PPPIRC Public-Private-Partnership in Infrastructure Resource Centre PSC Public Sector Competitor
PSDP Public Sector Development Program ROO Rehabilitate-Own-and-Operate ROT Rehabilitate-Operate-and-Transfer
Rs Rupees
T&D Transmission and Distribution
UNECE United Nations Economic Commission for Europe
UNESCAP United Nations Economic and Social Commission for Asia and the Pacific VGF Viability Gap Funding
VoF Value for Money
18
Glossary of Technical Terms
Animal Spirits This term was used by the British economist, John Maynard Keynes, to explain financial and buying decisions in conditions of uncertainty. In Keynes’ 1936 publication, The General Theory of Employment, Interest and Money, “animal spirits” describe the human emotion that drives consumer confidence.
Business Cycle The business cycle is also known as the trade cycle or economic cycle. It is the upward and downward movement of GDP and unemployment in its long-term trend (Alan, 2006). Business cycles are usually measured by considering the growth rate of real GDP.
Circular Debt Circular debt is a kind of debt where all members are both a creditor and a debtor. Every individual owes to someone and the net final creditor in the chain is indebted to the first creditor. At the end balance of all debts between individuals is zero (Nikbakht, 2006).
Credit Rating An independent assessment of the likelihood of credit default of an enterprise or undertaking by a credit rating agency. A credit rating is assigned and this plays an important role in the pricing of the rated enterprise’s securities (Regan, 2010).
Crowding in An economic principle in which private investment increases as debt-financed government spending increases. This is caused by government spending boosting the demand for goods, which in turn increases private demand for new output sources, such as factories. This is in contrast to crowding out. Crowding out The principle that high levels of public sector activity in the economy (such as
increased public expenditure) have an adverse impact on private sector demand. This can also apply to markets where Keynesian style budget deficits increase Treasury activity in the capital market, which increases interest rates and so “crowds out” private activity such as capital raisings, investment and expenditures.
Enabling Environment
A supportive policy, legal, institutional, macro-economic, infrastructural and
19
and reduce the efficiency of the market, increase the costs of doing business and retard the development of a competitive private sector. Traders and others are generally reluctant to make investments in an uncertain policy climate, such as those that restrict imports and exports or internal produce movement.
Ex-Ante The term is derived from the Latin for “before the event” and refers to future events, such as future returns (expected return of an investment portfolio) or
prospects of a company. For example, an ex-ante analysis is done when an
investment company values a stock ex-ante and then compares the predicted results to the actual movement of the stock’s price.
Expansionary Monetary policy
Monetary policy is the process by which the monetary authority of a country, typically the central bank, controls the monetary base or cost of very short-term borrowing. It targets the inflation rate or interest rate to ensure price stability and general trust in the currency.
Monetary policy is referred to as being either expansionary or contractionary. The expansionary monetary policy tool is used to stimulate the economy and maintain short-term interest rates at lower than usual rates to control unemployment and increase aggregate demand for all goods and services in an economy or to increase total supply of money more rapidly than usual. Expansionary monetary policy decreases the value of the currency relative to other currencies (the exchange rate).
Contractionary monetary policy is the opposite of expansionary monetary policy. It is used to increase interest rates higher than usual, thus slowing the rate of growth in the money supply. Consequently, it slows short-term economic growth and lessens inflation. However, contractionary monetary policy leads to increased unemployment and depressed borrowing and spending by consumers and businesses, which can eventually result in an economic recession if implemented too vigorously.
Gross Fixed Capital Formation
Government/private expenditure on fixed assets, additions and replacements, and upgradation of existing fixed assets (excluding repairs and maintenance).
Incomplete Contract
20 contract to address all future responsibilities is too costly, impractical or unachievable (Regan, 2010).
Public Sector Competitor
A public sector competitor (PSC) is an estimate of what the project would cost if traditional procurement methods were used while still meeting the performance standards expected from the private sector deal over the life of the contract. A PSC is normally used to determine whether private finance offers better value for money than traditional procurement.
Sovereign Debt A central government’s debt. This debt is issued by a national government in a foreign currency in order to finance the issuing country’s growth and development. Sovereign debt is also called government debt, public debt and national debt.
Turnpike Road with turnpike – in former times, a road that travellers were allowed to use only after paying a toll at the turnpike.
Road barrier – a gate formerly used to bar the way on to a section of road or a bridge until a toll had been paid.
Toll road – in the United States, a motorway on which a toll is charged. Drivers usually receive a ticket when they start their journey and pay a fee at the end that depends on the length of journey.
Unitary Charges
A payment refers to a fixed charge per unit of production under a long-term contract to supply a service. For example, under a PPP arrangement for a hospital, the private operator is required to furnish a minimum number of fully serviceable beds together with linen and support equipment to the hospital each day. The cost of providing and maintaining the beds is the responsibility of the contractor who is paid a quarterly unitary or availability charge based on bed availability.
User Charges The imposition of fees and charges for the use of certain public goods and state-owned utilities. Examples include fees applied for admission to council car parks, highways, art galleries and national or state parks and flora/fauna reserves.
Value for Money
21 not be chosen to secure a particular balance sheet treatment (HM Treasury 2004, p.3). The Partnerships Victoria (2001) approach to value for money is:
• Risk transfer – relieving government of the substantial, but often undervalued, cost of asset-based risks;
• Whole-of-life – whole-of-life costing, fully integrating under the responsibility of one party;
• Up-front – design and construction costs, with ongoing service delivery, operational, maintenance and refurbishment costs;
• Innovation – providing wider opportunity and incentive for innovative solutions for how service requirements can be delivered; and
• Asset utilisation – developing opportunities to generate revenue from use of the asset by third parties, which may reduce the cost that government would otherwise have to pay as a sole user.
Viability Gap Funding
22
Personal Statement
I have had more than 17 years of diversified work experience in both private sector organisations and the public sector in various federal ministries at different positions in Pakistan. As a result of my experience, I realised that the country is unable to achieve its economic goals without well-established infrastructure. Financial constraint is the major impediment to infrastructure development, combined with other problems such as poor infrastructure planning, policy and management and the lack of research into alternative sources of infrastructure financing. This thesis is intended to provide both theoretical and policy-related contributions to inform future infrastructure funding decisions. In this context, the thesis focuses on how private sector participation in terms of PPP can be a part of the solution to infrastructure financing and management problems. However, inexperienced institutional frameworks and lack of public and private sector capability are major barriers to implement an efficient PPP programs. These challenges motivated me to develop expertise in the field of infrastructure development through private sector participation.
23
Chapter One: Introduction
1.1
Background
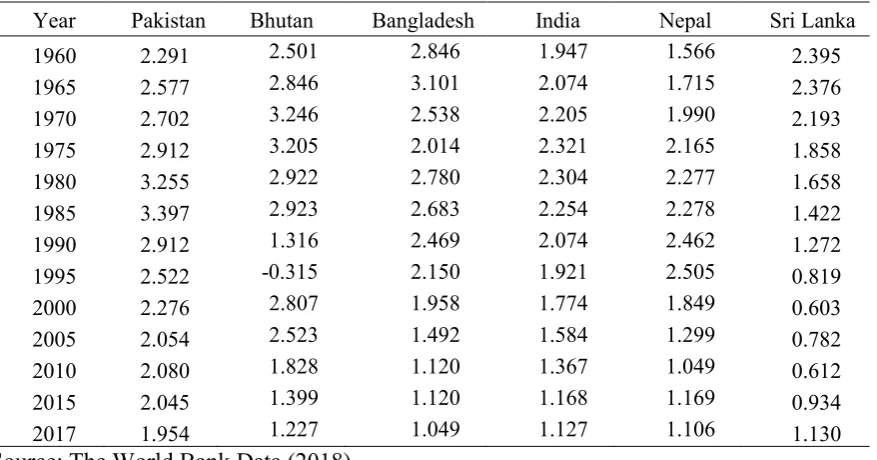
Pakistan’s population grew by 1.954% in 2017, the highest population growth rate among South Asian countries (The World Bank, 2018) (Table 1.1 and Figure 1.1). Rapidly increasing population growth is putting pressure on infrastructure services. Consequently, the gap between infrastructure services demand and supply is widening continuously (Bjorvatn, 2000). Conversely, Pakistan’s economic growth and development has remained unsustainable mainly because of insufficient physical and social connectivity and inappropriate use of economic growth software that drives the growth rate on a sustained basis. The software includes effective governance mechanisms, better organisation of institutions, efficient management of physical infrastructure, and human capital development in relation to globally successful experiences (Planning Commission, 2012).
[image:24.595.76.515.429.659.2]This thesis identifies the key determinants of PPP performance for developing physical infrastructure, including telecommunication, power and transport, with reference to Pakistan.
Table 1.1: Comparison of population growth rate (%) of Pakistan and South Asian countries 1960-2017
Year Pakistan Bhutan Bangladesh India Nepal Sri Lanka
1960 2.291 2.501 2.846 1.947 1.566 2.395
1965 2.577 2.846 3.101 2.074 1.715 2.376
1970 2.702 3.246 2.538 2.205 1.990 2.193
1975 2.912 3.205 2.014 2.321 2.165 1.858
1980 3.255 2.922 2.780 2.304 2.277 1.658
1985 3.397 2.923 2.683 2.254 2.278 1.422
1990 2.912 1.316 2.469 2.074 2.462 1.272
1995 2.522 -0.315 2.150 1.921 2.505 0.819
2000 2.276 2.807 1.958 1.774 1.849 0.603
2005 2.054 2.523 1.492 1.584 1.299 0.782
2010 2.080 1.828 1.120 1.367 1.049 0.612
2015 2.045 1.399 1.120 1.168 1.169 0.934
2017 1.954 1.227 1.049 1.127 1.106 1.130
24
Figure 1.1: Comparison of population growth rates (%) of Pakistan and South Asia 1960-2017
Source: The World Bank Data (2018)
The basic physical and organisational structures and facilities (e.g. buildings, roads, power supplies) needed for the operation of a society or enterprise is called infrastructure (Oxford Dictionary, 2018). Infrastructure is widely recognised as an integral part of economic growth in any economy (Lakshmanan, 2008; Zhang and Fan, 2004). It provides the core networks for all economic and social activities. A review of international empirical evidence points to a positive association between infrastructure investment and productive capacity, output growth, domestic and overseas trade, lower private costs, employment, incomes and living conditions of general public (Kevin, 2011; Paravaka and Ranjan, 2010; Naoyuki and Masaki, 2000).
In Pakistan the gap between demand for and supply of infrastructure services is large and widening. Between 2010 and 2015 Pakistan’s population increased by 8.83 percent while Development Expenditure (% of GDP) decreased to 2.3%. However, inadequate infrastructure facilities are observed to be one of the factors that have impeded Pakistan’s attempts to achieve higher economic growth (Economic Survey of Pakistan, 1990 – 2015).
25 capital formation1(GFCF) in Pakistan was 15 percent of GDP in 2014 and 16 percent of GDP in 2016, which is the lowest in South Asia (World Bank Indicators, 2015 and 2017).
An increase in physical capital generates positive spillovers by providing better health, education and transportation, accumulating productive capacity to sustain a higher output by using modern research and techniques, and ultimately enhancing GDP growth. There is a two-way causality between GDP and investment (Maryam and Nazima, 2012). A comparison of infrastructure investment in Pakistan 1960-2016 is presented in Figure 1.2.
Figure 1.2:Infrastructure investment in Pakistan 1960 – 2016 by percentage of GDP
Source: The World Bank data (2018)
According to World Bank indicators 2018, the average value of infrastructure investment in Pakistan from 1960 to 2016 was 17.43 percent of GDP, with a minimum of 11.56 percent of GDP in 1960 and a maximum of 21.47 percent of GDP in 1965.
1.2
Pakistan: Infrastructure investment as a percentage of GDP
In Pakistan, infrastructure development has traditionally been carried out through public resources i.e. borrowing or taxpayer funded. The limited availability of public resources results in an inability to build sufficient infrastructure to meet growing demand (Table 1.2 provides an
26 overview of Pakistan’s budget deficits and debt). However, if the public sector is unable to fulfil this need, then private investment can be a useful option. Unfortunately, private sector participation in infrastructure development is also very limited.
Table 1.2: Pakistan’s financial indicators (as percentage of GDP)
Year Real GDP % Budget Deficit % of GDP Public Debt % of GDP
2006-07 5.5 4.1 55.5
2007-08 5.0 7.3 58.4
2008-09 0.4 5.2 60.0
2009-10 2.6 6.2 60.2
2010-11 3.6 6.5 59.3
2011-12 3.8 8.8 61.3
2012-13 3.7 8.2 64.0
2013-14 4.0 5.5 63.5
2014-15 4.1 5.3 63.3
2015-16 4.5 4.6 67.6
2016-17 5.3 5.8 67.2
Source: Adopted from Fiscal Policy Statement, Federal Budget, Ministry of Finance Pakistan
According to the Australian Department of Foreign Affairs and Trade (2014), the private sector drives growth and acts as an engine of growth by creating new jobs, and by paying taxes that finance services and investment. In developing countries, the private sector funds around 60 percent of all investments, provides more than 80 percent of government revenues and generates approximately 90 percent of jobs. The private sector also participates in the provision of essential infrastructure services, such as banking, transportation, telecommunications, health and education. According to the Ministry of Finance (2012), fixed investment by the private sector was 8.3 percent of GDP during the financial year 2012-13 out of a total fixed investment 13.1 percent of GDP, which is the lowest fixed investment by both the public sector and the private sector in South Asia (World Bank Database, 2016).
1.3
Current state of private investment in Pakistan
27 1.3.1 Weak institutional arrangements
Debt financing for infrastructure projects is very limited/unavailable due to the long development period needed to construct and commission projects, during which there is little financial return. Infrastructure projects typically require long-term investment (10-20 years approximately). Therefore, traditional lending resources (commercial banks) do not offer long-term loans facilities for large infrastructure projects. Bank credit provided to the private sector in Pakistan during 1990 to 2017 reached its lowest point of 15.39 percent of GDP in 2015, which is also the lowest among South Asian countries (The Global Economy.com, The World Bank). Table 1.3 and Figure 1.3 provide a comparison of domestic credit to the private sector as percentage of GDP in Pakistan and South Asia during 1990-2017. Domestic credit to the private sector refers to financial resources provided to the private sector by financial corporations, such as through loans, purchases of non-equity securities and trade credits and other accounts receivable, that establish a claim for repayment (The World Bank, 2018).
Table 1.3: Comparison of domestic credit to private sector (% of GDP) in South Asian countries 1990-2017
Year Pakistan Bangladesh Bhutan India Nepal Sri Lanka
1990 24.16 16.07 4.11 25.25 12.81 19.62
2000 22.34 21.78 8.85 28.72 30.67 28.83
2008 28.73 34.04 29.96 50.06 51.65 29.54
2009 22.72 36.19 32.42 48.78 59.18 25.74
2010 21.41 40.96 41.45 51.14 54.59 25.52
2011 18.13 42.47 46.81 51.29 52.95 35.01
2012 16.94 43.00 45.72 51.89 56.13 35.02
2013 16.12 41.79 45.64 52.39 58.03 34.75
2014 15.59 43.74 43.82 51.88 61.90 35.87
2015 15.39 44.41 45.19 51.90 64.75 41.60
2016 16.53 45.28 47.02 49.55 81.05 45.71
2017 17.03 47.58 --- --- 81.16 ---
28
Figure 1.3: Comparison of domestic credit to private sector (% of GDP) in South Asian countries 1990-2017
Source: The World Bank Data (Retrieved on 27-08-2018)
1.3.2 Lack of expertise
29 investors. See, for example: (Edwards, 1998; Infrastructure Management Unit, 2007; Investopedia, 2018; Morewedge, Tang, & Larrick, 2018).
1.3.3 Lack of adequate regulatory framework
Too many bureaucratic formalities are involved in the public procurement process. The main bottlenecks are the complex and time-consuming procurement, approval, tendering and bidding processes, as well as conflicts of interest, the principal-agent problem and increasing risk of corruption. Complex rules and regulations together with official procedural requirements are known to cause delays in project completion and cost overruns (Klijn & Teisman, 2003). In addition, a lack of unidirectional policy frameworks and coordination at federal, provincial and municipal levels have impeded private-sector investment in infrastructure development in Pakistan (Infrastructure Management Unit, 2007). The existing procurement law does not have provisions for cancelling the procurement process if there are any irregularities. There is limited scope to make changes to the requirements once the contract has been signed, as it increases the project cost (Podriguez, 2018). Furthermore, the division of responsibilities between the contracting parties (public and the private sector) is unclear and ambiguous project-related risk mitigation mechanisms have discouraged private-sector participation in infrastructure development.
1.4
Justification for the Thesis
1.4.1 Pakistan’s Current Infrastructure Status
Pakistan is the sixth most populous country in the world, with 188.9 million people (The World Bank, 2018). Projections suggest that it will become the fifth largest country with a population ranging between 230 and 260 million people by 2030 (Planning Commission, 2005). The country also has a relatively high level of urbanisation, with 37 percent of its population living in cities, and so is the most urbanised in South Asia (Ministry of Finance, 2011).
30
Table 1.4: Comparison of urbanisation across South Asian countries at 2015
Country Population
(Millions) Surface area Thousand Sq. Km Population density people per sq.km
Urban population % of total population
Pakistan 188.9 796.1 245 39
Bangladesh 161.0 147.6 1,237 34
Bhutan 0.8 38.4 20 39
India 1,311.1 3,287.3 441 33
Nepal 28.5 147.2 199 19
Sri Lanka 21.0 65.6 334 18
Source: World Bank Indicators 2017.
Pakistan’s basic infrastructure, such as roads, railways, ports, airports, communication and power supply, is not equivalent to the standards prevalent in competitor countries. On a global scale Pakistan’s infrastructure is also very poor. Its infrastructure ranking in the basic determinants of Global Competitiveness Index (GCI) in the year 2015-2016 is 117 out of 140 countries (Global Competitiveness Index 2015-16). Table 1.5 presents Pakistan’s ranking in the basic determinants of GCI:
Table 1.5: Pakistan’s ranking in the basic determinants of GCI
Period Overall Rank Infrastructure Institutions Health and Primary Education Macroeconomic Stability
2009-10 101/133 89/133 104/133 113/133 114/133
2011-12 118/142 115/142 107/142 121/142 138/142
2015-16 126/140 117/140 119/140 127/140 128/140
Source: Adopted from the data collected from GCI 2009-10, 2011-12 and 2015-16
1.4.2 Scarcity of finance/loans
Lack of public financing and expertise is a major barrier to project execution around the globe, which prompted the government to seek foreign support and encourage the private sector to become involved in developing infrastructure (Business Monitor International, 2016).
In summary, the primary reasons for scarcity of finance/loans are: perception of country risk, lenders’ fear and credibility of the host government, lack of predictability in government decisions, institutional capacity concerns, the enforceability of contracts, and the regulatory framework and its transparency (Smith, 2007).
31 between infrastructure service demand and supply is an enormous challenge the country has to deal with due to the importance of infrastructure development in the economy. New avenues to increase infrastructure investment may be found elsewhere. Empirical studies suggest that PPP may be a valuable solution to the infrastructure challenge; see, for example, (Adrias, 2010; Pereira & Andraz, 2005; Peter, 2010).
1.4.3 Brief introduction to PPP
PPP involve the public sector authority and private sectors working together to provide services. Under a PPP arrangement, the private sector performs a function on behalf of the public sector for a contracted time period, and assumes financial, technical and operational risk in the project. The private party’s compensation is based on its performance (availability of service and quality of the service). A PPP allows each partner to concentrate on activities that best suit their skills. For the public sector that means focusing on developing policies and identifying service needs, while for the private sector the key is delivering those needs efficiently and effectively [at an affordable price] (IPDF, 2006).
PPP procurement is based on output specification. In PPP procurement, the government defines the required service and leaves the design and planning of the project to the private party. In this way optimal risk associated with the project from the project design stage through to operation and service delivery is transferred to the private party. In some circumstances design requirements may not be left entirely to the discretion of the private party and the public sector may specify some inputs (IPDF, 2006). The advantages and disadvantages of PPP will be discussed in detail in Chapter 3. The PPP model has been successfully adopted in many countries for various purposes including the provision of infrastructure services.
PPP programs have been successfully adopted in both developed and developing countries such as the United Kingdom, Canada, the United States of America, Australia, Japan, Netherlands and Hungary (European Commission Directorate-General Regional Policy, 2004; European PPP Expertise Centre, 2012). To overcome funding shortages, developing countries such as India, Mexico, Sri Lanka, Bangladesh and Nepal have also increasingly resorted to the PPP approach and have successfully implemented various PPP projects.
32 infrastructure shortfall. Unfortunately, there do not appear to be any relevant studies on using the PPP model in the context of Pakistan’s infrastructure development. This thesis examines Pakistan’s capacity to use the PPP procurement model for infrastructure development and, if capacity is lacking, what the major impediments are.
1.5
Research questions and objectives
The research questions answered by this thesis concern the major impediments to PPP implementation in Pakistan and how they affect PPP implementation.
General Research Questions
• What is the current status of private participation in infrastructure investment in Pakistan? If this participation is not extensive, why not?
• Has the PPP model been used effectively in Pakistan to proactively involve the private sector in infrastructure development? If not, why not and what are the major obstacles?
• Are institutional impediments the most critical to the effective adoption of the PPP model for infrastructure development?
• What kind of institutional arrangements are needed and how can they be developed in Pakistan to boost PPP undertakings for infrastructure development?
A set of specific empirically testable research questions was developed in order to answer the general research questions.
Specific Research Questions
• Does institutional capacity (IC) have an effect on PPP implementation in Pakistan?
• Do the public and private sectors in Pakistan have the capacity to implement PPP programs?
• Do other factors have an effect on PPP implementation in Pakistan? If so, what are these factors and what is their relative impact?
33 Research amis are to:
• Survey the current status of infrastructure development in Pakistan
• Evaluate contributions to infrastructure development by both the public and private sectors
• Examine the causes of the lack of implementation of PPP in Pakistan
• Develop a framework that helps to establish essential institutional arrangements conducive to PPP adoption
• Draw out implications for policy development for effective PPP implementation in Pakistan.
1.6
Methodology
The research underpinning this thesis used both quantitative and qualitative methods to achieve the research objectives. Quantitative techniques were used for investment analysis relative to PPP for the period 1991 to 2014. The quantitative/secondary data was collected from the websites and reports of government authorities and multilateral agencies. A survey questionnaire was used to collect qualitative/primary data from public and the private sectors to assess each sector’s capacity to implement successful PPP program. Guidance from relevant studies conducted by researchers from both developed and developing countries has been taken to ensure the legitimacy of the information generated. The research methodology is described in detail in Chapter Four.
34
Table 1.6: Overview of the research design and thesis contribution
Research aims Research questions Research gap Research methodology Analysis techniques Contribution
• Survey the current status of
infrastructure development in Pakistan
• Evaluate contributions to infrastructure development by both the public and private sectors
• Examine the causes of the lack of implementation of PPP in Pakistan
• Develop a
framework that helps to establish essential institutional
arrangements conducive to PPP adoption
• Draw out implications for policy development for effective PPP implementation in Pakistan
• Does institutional capacity (IC) have an effect on PPP implementation in Pakistan?
• Do the public and the private sectors of Pakistan have the capacity to implement PPP programs?
• Do other factors have an effect on PPP implementation in Pakistan? If so, what are these factors and what is their relative impact?
• There is a gap in literature determining institutional capacity, public sector capacity and the private sector capacity to implement PPP program in Pakistan
• To our knowledge, private sector capacity to implement PPP programs has not been assessed so far. Therefore, no previous method and technique is available to evaluate this aspect of PPP
• Some research has been done on the role of institutions and public sector capacity to develop infrastructure to achieve higher
economic growth. However, its scope is limited and does not complete the causal direction.
• Factor analysis was used to verify the suitability of the questionnaire
• Reliability and consistency among questionnaire variables were tested by Cronbach’s alpha.
• The model in this thesis was built up within the panel vector autoregression framework allowing dynamics of investment and other quantitative
independent variables.
• The quantitative variables were all treated as
endogenous and modelled as a Panel vector auto
regression (PVAR) model
• This model was further extended to include qualitative policy variables to articulate the effects of both variables (quantitative and qualitative) in the infrastructural development of Pakistan. This model is generally known as Panel vector auto regression with exogenous variables denoted as PVAR – X
• The panel regression model (1) is carried out by using ordinary least squares (OLS), generalised least squares (GLS) and maximum likelihood methods.
• PVAR and PVAR – X are estimated using
Generalised Method of Moment (GMM) estimation
• Analyses are performed to check:
• (i) theory consistency
• (ii) statistical significance
• (iii) model adequacy and
• (iv) goodness-of-fit tests.
• We also conducted Hausman (1978) & Breusch-Pagan (1980) tests for model selection (between fixed effects and random effects models)
• The research problems are restated in terms of statistical hypotheses and are tested within the classical testing framework (e g. t, F, 2, LR, LM, Wald testing approaches)
• This study provides a comprehensive survey of major obstructions to undertaking PPP in Pakistan
• This thesis is an attempt to construct a comprehensive framework to examine successful PPP
implementation in Pakistan
• This study also provides important information and inputs with government policy implications for removing barriers to PPP implementation and encouraging PPP
undertakings in Pakistan for infrastructure development
•Some research work has been done on the roles of
institutions and public sector capacity to develop
35
1.7
Econometrics to verify the results
The econometric models were estimated using the STATA program. They are discussed in detail in Chapter Six.
1.8
Organisation of the Thesis
This thesis is organised into seven chapters. The first chapter provides the background for the justification of the thesis, key facts relating to Pakistan’s economy and comparisons of Pakistan to other South Asian countries. This chapter discusses the current infrastructure investment trends and methods used in Pakistan and the current status of private-sector investment in infrastructure development. The chapter also briefly identifies the possible reasons for low private-sector participation in infrastructure development in Pakistan. Justification for the thesis, research aims, research questions and research objectives and the methodology for the data analysis techniques used to address the research questions are also discussed in this chapter.
Chapter Two discusses the importance of infrastructure and provides a sector-wide overview of the current status of infrastructure in Pakistan. This chapter also reviews infrastructure investment planning, policies and trends in Pakistan. Causes of insufficient infrastructure facilities in Pakistan and infrastructure projects financing models are also discussed in this chapter, which serves as a background against which the remaining chapters of the thesis can be read.
Chapter Three provides a critical literature review that examines empirical data from previous studies dealing with the role of infrastructure, PPP and institutions in economic growth. This section is divided into four sub-sections:
• The role of infrastructure in economic growth;
• PPP – a solution;
• Role of institutions in economic growth; and
• Review of investment theories in context of investment in public infrastructure.
The gaps in current literature is also identified in this chapter.
36 hypotheses, other factors are discussed that have impacted on PPP implementation, the data used for analysis is discussed, as are research methodology and estimation approaches in detail.
Chapter Five presents a detailed discussion of primary data/qualitative data collection approaches used in the studies that were undertaken as part of the thesis, together with tabulation and representation of qualitative data in numerical values. This chapter discusses the study type selection, data sources, the design of the questionnaire, econometric equations and estimation techniques and the adoption of an estimation model. Preliminary results are also presented in this chapter.
Chapter Six presents findings from the data analyses and discusses the findings as they specifically relate to the research questions. This chapter also states the empirically testable research hypotheses and provides hypotheses test results for pinpointing the causes of obstructions of PPP implementation in Pakistan.
37
Chapter Two: Current Status of Infrastructure in Pakistan
This chapter presents an overview of the current status of infrastructure development in Pakistan. The overview draws primarily on policy documents and international economic reports as there is little critical analysis of Pakistan’s infrastructure strengths and weaknesses in the academic literature. Section 2.1 discusses common definitions and various interpretations of the term “infrastructure”. Section 2.2 presents an overview of Pakistan’s current infrastructure status with a discussion of historical trends and the increasing demands placed on infrastructure and services. Pakistan’s infrastructure investment policies and trends are addressed in Section 2.3. Section 2.4 explores major causes of insufficient infrastructure in Pakistan and makes recommendations on how to boost Pakistan’s infrastructure.
2.1
Defining infrastructure
The basic physical and organisational structures and facilities (e.g. buildings, roads, power supplies) needed for the operation of a society or enterprise is called infrastructure (Oxford Dictionary, 2018). Over time different researchers have defined infrastructure differently. Various researchers (see Lakshmanan, 2008; Jamaluddin et al., 2007 and INSTATE Pty. Ltd., 2001) refer to infrastructure as comprising two parts: the basic physical structure (roads, buildings, power etc.) and the organisational structure (institutions). Other researchers have distinguished between “hard” infrastructure i.e. large physical networks necessary for the functioning of the economy, and “soft” infrastructure i.e. institutions required to maintain the economy (Instate Pty. Ltd., 2001).
Other definitions of infrastructure are as follows:
Lakshmanan (2008) states that physical infrastructure covers telecommunication, power and transportation and through its spillover effects can increase employment, income and savings. It can also lead to higher living standards and eventually forward and backward linkages to facilitate growth. Infrastructure development spreads its positive effects across the economy. Social infrastructure includes water supply, sanitation, sewage disposal, education and health, as primary services that have a direct impact on the quality of life. Physical infrastructure and social infrastructure are interlinked, and both improve living standards and accelerate growth rate.
38
• Physical infrastructure: transport, power, communication and agro-specific infrastructure such as manufacturing of farm equipment, imports and exports of farm products
• Financial infrastructure: banking services and life insurance corporations
• Social infrastructure: health, education, medical care, aged care, nutrition, housing, water supply, sanitation, sewage collection and disposal, parks and sports facilities.
Instate Pty. Ltd. is an advisory practice that undertakes research and analysis as inputs for business managers and policy makers. Instate Pty. Ltd. (2001) asserts that the most critical infrastructure for economic development is that which relates:
• Directly or indirectly, to the movement of people and goods – the physical (hard) infrastructure such as the roads, the rail networks, the ports and power stations etc.
• To quality of life – the social (soft) infrastructure such as hospitals, health care facilities, social services, the art and the legal and regulatory systems etc.
• To the generation, storage and sharing of knowledge – the knowledge infrastructure (schools, colleges and universities, research bodies and libraries etc.).
This thesis focuses on three sectors of physical infrastructure, namely telecommunication, power and transport, with the objective of assessing their impact on the economic growth of Pakistan.
2.1.1 Infrastructure improves standard of living
39 lack of infrastructure that connects growers, producers and consumers of final goods causes inefficiencies and competitiveness problems, which may impede economic growth (D´emurger, 2001). According to Aschauer (1993) there is a strong causal relationship between public capital investment and both productivity and output. Further, new research suggests that public infrastructure is also considered a factor of production along with factors of such as land, labour and capital.
2.1.2 Infrastructure has positive effects on business
Infrastructure affects production activities in developing countries (Yoshino and Nakahigashi, 2000). Infrastructure has positive effects in reducing production costs and contributing positively to aggregate output and productivity (Ecurra et al. 2005; Bjorvatn, 2000; Andrews and Swanson, 1995). According to Nourzad et al. (2014), public expenditures on infrastructure development increase the productivity of private investment by improving production conditions. Infrastructure not only has an impact on output but also attracts foreign direct investment (FDI). Several empirical studies have recognised that FDI is one the factors of economic growth and concluded that FDI contributes to the living standard of the host country by transfer of new technology (Nourzad et al. 2014).
2.2
Overview: ownership/control of Pakistani’s infrastructure assets
across each sector
40
Table 2.1: Comparative Indicators of Infrastructure across South Asian Countries
Indicators 1990 Pakistan 2014 1990 2014 1990 2014 1990 2014 1990 2014 1990 2014 India Bangladesh Bhutan Nepal Sri Lanka
Population (millions) 103 185 508 1,295 106 169.1 765 18.8 28.2 20.8
Population growth (%) 2.9 2.1 2.1 1.2 2.5 1.2 1.2 1.4 2.5 1.2 1.2 0.9
Population density (people per sq.km) --- 240 --- 436 --- 1,222 --- 20 --- 197 --- 331
Mobile cellular subscription (% of population) --- 73.3 0 74.5 0 80 0 82.1 0 81.9 103.2
Individuals using the internet (% of population) --- 14 --- 18 --- 10 --- 34 --- 15 --- 26
Access to Electricity (% of