Beyond Congruence Measures for the Evaluation of Personality Factor Structure Replicability: An Exploratory Structural Equation Modeling Approach
Harsha N. Perera, Peter McIlveen, Lorelle J. Burton, and Diane M. Corser University of Southern Queensland
AUTHOR NOTE
Harsha N. Perera, School of Linguistics, Adult and Specialist Education, University of Southern Queensland, Australia; Peter McIlveen, School of Linguistics, Adult and
Specialist Education, University of Southern Queensland; Australia. Lorelle J. Burton, School of Psychology and Counselling, University of Southern Queensland; Diane M. Corser,
School of Psychology and Counselling, University of Southern Queensland;
Correspondence concerning this article should be addressed to Harsha N. Perera, School of Linguistics, Adult and Specialist Education, University of Southern Queensland;
Toowoomba, Queensland, 4350; Australia. Email: [email protected]
Please cite this article in press as: Perera., et al. Beyond congruence measures for the evaluation of personality factor structure replicability: An exploratory structural equation modeling approach. Personality and Individual Differences (2015),
Abstract
The present study aims to illustrate an encompassing approach to the evaluation of personality factor structure replicability based on novel exploratory structural equation
modeling (ESEM) methods. This approach comprises formal tests of measurement invariance applied to the flexible ESEM framework and overcomes the limitations of congruence
measures that have traditionally been used to assess factor replicability in personality research. On the basis of 1566 responses to the widely-used NEO Five-Factor-Inventory (NEO-FFI), we demonstrate this ESEM approach in the context of examining the invariance of the NEO-FFI factor structure across gender. The approach is shown to converge with traditional congruence measures and extend these measures for examining factorial structure consistency. In addition, more general replicative data supporting the validity of the NEO-FFI are reported. We discuss the ESEM approach as a viable alternative to the congruence
The Five-Factor Model (FFM) is predicated on the postulate that personality can be captured in five dimensions: openness to experience (O); conscientiousness (C); extraversion (E), agreeableness (A), and neuroticism (N). These dimensions have been replicated in peer, parent, and self-report ratings of personality, and in heterogeneous populations and different languages (McCrae & Costa Jr, 2008). Indeed, factor replicability is recognized as one of the “pillars” on which the validity of the FFM rests. However, there are limitations to traditional approaches to the evaluation of replicability (viz., congruence measures) (McCrae,
Zonderman, Costa Jr, Bond, & Paunonen, 1996). The present study illustrates an alternative approach to the assessment of personality factor replicability, based on the novel ESEM methodology, using a large sample of data obtained from the widely-employed NEO Five Factor Inventory (NEO-FFI). We compare the congruence and ESEM approaches to illustrate the advantages of the latter in the evaluation of personality factor structure consistency. In addition, we examine the criterion validity of the NEO-FFI with respect to relevant vocational and academic outcomes, including career adaptability (CO), career optimism (CA), and academic achievement (AA) (Rottinghaus & Miller, 2013). These replicability and validity analyses are performed in a general ESEM framework. Congruence Measures for Evaluating Personality Factor Structure Replicability
Researchers have traditionally relied on congruence measures to evaluate personality factor replicability. These congruence coefficients index the degree of factor pattern
1 2 2 1 1
,
p ix iy i ab p p ix iy i ir
(1)where p is the number of observed variables in the two samples, λix is the loading of
variable i on factor x in sample one, and λiy is the loadings of variable i on factor y in sample
two. In addition, variable and total congruence coefficients have been proposed (see McCrae et al., 1996). Although it is possible to compare varimax rotated factors from independent factor analyses using the congruence measures, McCrae et al. (1996) recommend a Procrustes (i.e., targeted) rotation for the assessment of personality factor replicability in which a factor solution is orthogonally rotated to adhere to a prespecified target factor structure. The extent to which the target and rotated structures are similar, quantified via congruence coefficients, is taken as evidence for factor replicability, with coefficients greater than .90 or .95 typically indicative of factor invariance (Lorenzo-Seva & Ten Berge, 2006; Mulaik, 1972). Beyond heuristics, bootstrap resampling procedures have been developed to provide significance tests of the congruence measures absent of a theoretical sampling distribution of these coefficients (Chan et al., 1999).
Notwithstanding the wide use of congruence indices in personality research, these measures have known limitations. For example, Horn (1967) showed that congruence coefficients may indicate high factor replicability even when random data are rotated to a target matrix using oblique Procrustes rotation. Paunonen (1997) also demonstrated that the expected value of congruence measures is contingent on several model characteristics,
including the number of variables in the model and the number of salient loadings per factor. Furthermore, though statistical tests of congruence coefficients are available based on
empirical resampling methods under null hypotheses of both factor congruence and
2009). Finally, and most importantly, a sizeable congruence coefficient does not constitute evidence of the complete replicability of factor structures as factor pattern congruence is a necessary but not sufficient condition for factor invariance (Dolan et al., 2009; Meredith, 1993; Reise, Waller, & Comrey, 2000). Instead, evidence of strict measurement invariance is required for claims of complete measurement equivalence in line with Mellenbergh’s (1989) definition of unbiasedness in the common factor model (Meredith, 1993).
An ostensibly elegant analytic option for redressing the limitations of congruence measures is the conduct of factor replicability studies within a multi-group (MG)
correlations, as any relation between an item and non-target factor that should be accounted for by a secondary loading can only be expressed as a factor correlation in the ICM-CFA (Marsh et al., 2010; Morin, Arens, & Marsh, Accepted, 22 August 2014). As the FFM is not a perfect simple structure, there is no theoretical reason why traits should not index more than one factor (McCrae et al., 1996); thus, the ICM-CFA may not be an appropriate analytic structure for multidimensional personality data.
ESEM as an Alternative Approach
ESEM is a more appropriate analytic formulation for the conduct of factor
replicability studies, which overcomes the limitations of congruence measures and the ICM-CFA. ESEM differs from the ICM-CFA to the extent that all primary and secondary loadings are freely estimated (conditional on the imposition of minimal identifying restrictions) and ESEM factors, like EFA factors, can be rotated (Morin, Marsh, & Nagengast, 2013). Thus, ESEM provides a less restrictive framework for the evaluation of factor structures that can sufficiently account for the psychometric multidimensionality of NEO-FFI items. As ESEM is an integration of EFA within a general SEM framework, the statistical advances of
Formal MG tests of factor structure invariance, typically reserved for CFA models, can be conducted in the ESEM framework; this is substantively important for replicability studies. Dissimilar to congruence measures, which may only be used to infer weak factorial invariance, MG-ESEM provides tests of complete measurement invariance required for inferences of complete factor structure consistency (Morin et al., 2013). In addition, the equality of factor variance-covariance matrices and latent means (i.e., structural invariance) can be tested, though these tests are not considered in the present study.
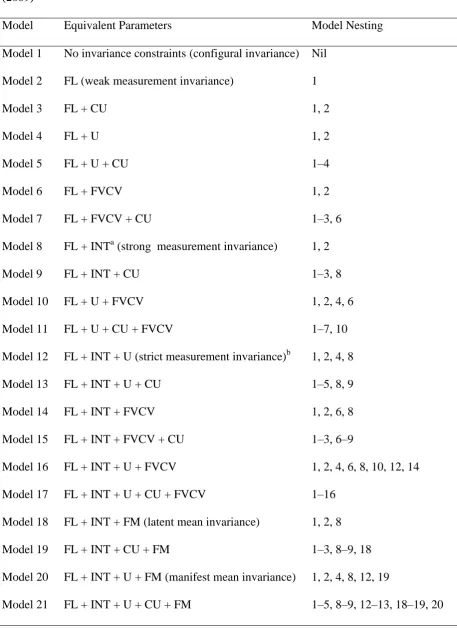
Marsh et al. (2009) operationalized a taxonomy of 13 models for testing invariance in the ESEM framework. We propose an extension of this taxonomy to include tests of the invariance of correlated uniquenesses as the presence of methods effects due to item
idiosyncrasies or response biases, which can be controlled using a priori correlated residuals, is likely to be the rule rather than the exception for many personality inventories (Marsh, Lüdtke, Nagengast, Morin, & Von Davier, 2013). As shown in Table 1, the proposed taxonomy of 25 nested ESEM models ranges from a configurally invariant model, in which no equality constraints are imposed on the parameters, to a model of complete measurement and structural invariance, in which there is equality of factor loadings, intercepts,
uniquenesses, and factor mean and variance-covariance structures, with additional equality constraints on the correlated residuals imposed. In the present study, we propose this extended taxonomy of invariance tests, specifically models 1–16 addressing measurement invariance, as an alternative to congruence measures for establishing evidence of cross-sample factor structure replicability. This procedure is illustrated in the context of measurement invariance tests across gender for the NEO-FFI data. Nonetheless, the
INSERT TABLE 1 ABOUT HERE Criterion Validity
In addition to examining the utility of ESEM for factor replicability evaluation, we demonstrate the flexibility of ESEM for other tests of construct validity, namely concurrent and predictive validity. This criterion validity of the NEO-FFI scores is evaluated with respect to three substantively-important outcomes: CO; CA; and AA.
Career engagement. Theories of career engagement postulate effects of
dispositional personality traits on characteristic adaptations, such as CO and CA (Rottinghaus et al., 2005). Indeed, Rottinghaus et al. (2005) reported significant correlations between CO and N (r = –.29), E (r = .19), O (r = .23), and C (r = .51); however, the correlation between CO and A was small and not significant (r = .07). Similarly, there were significant
correlations of CA with N (r = -.30), E (r = .37), O (r = .26), A (r = .27), and C (r = .41). Both CO and CA should relate to C and N moderately, and to a lesser extent with O, E and A.
Academic achievement. Research affirms that, of the five factors, C has the stronger predictive relationship with academic achievement (O’Connor & Paunonen, 2007; Poropat, 2009; Richardson, Abraham, & Bond, 2012). In university students—the target population of the current research—this relationship bears out with C the stronger predictor of grade point average (GPA) (Pozzebon, Ashton, & Visser, 2014). We expected to find a positive
relationship between C and AA. Given existing evidence (O’Connor & Paunonen, 2007; Poropat, 2009; Richardson et al., 2012), we expected relationships of the remaining four factors with AA to be smaller with negative relations for E and N and positive relations for O and A, respectively.
Participants were 1566 university students at the University of XXX. The average age was M = 33.25 years (SD = 11.47) and 66.5% (n = 1041) were female. Approximately 75% of the students enrolled at this university study via distance mode and were employed, working M = 31.2 (SD = 12.96) hours per week. Proportions of academic disciplines were Arts and Humanities, 12.5% (n = 196); Business and Commerce, 26.4% (n = 414); Education 23.4% (n = 367); Engineering and Surveying, 15.6% (n = 244); and Science and Health, 21.1% (n = 331). These demographic characteristics are consistent with the overall profile of the university’s study body. The present data were collected as part of a larger study on personality predictors of student engagement and achievement. Participants completed an online battery of questionnaires concerning their personality, CO and CA. At semester-end, academic records were retrieved from the university registrar for a random subset of
participants (n = 433). Measures
Personality. The NEO-FFI (Costa & McCrae, 1992) was used to assess personality. The NEO-FFI is a shortened version of the Revised NEO Personality Inventory that measures the five major personality factors. It contains 60 items in total, with each of the five
subscales comprising 12 items. Participants were asked to rate their agreement with statements using a 5-point Likert scale ranging from 1 (strongly disagree) to 5 (strongly agree). Internal consistency coefficients reported by Costa and McCrae and those found in the current study were, respectively, α =.86 and α =.88 for Neuroticism, α = .77 and α =.80 for Extraversion, α = .73 and α =.72 for Openness to Experience, α = .68 and α =.76 for Agreeableness, and α = .81 and α = .86 for Conscientiousness (Costa & McCrae, 1992).
(strongly disagree) to 5 (strongly agree). In the original scale, internal consistency was α = .87 for CO and α = .85 for CA. In the current study, α = .87 and α = .87 for CO and CA, respectively.
Achievement. GPA was used as a single indicator of pseudo latent academic achievement with an a priori estimate of measurement error. The best available estimate of the reliability of GPA (α = .94), obtained from Bacon and Bean (2006), was used to estimate measurement unreliability.
Statistical Analysis
All analyses were conducted using Mplus 7.3 (Muthén & Muthén, 1998-2014). We performed initial factor replicability analyses using the traditional congruence approach. First, an EFA with diagonal weighted least squares (DWLS; operationalized as the WLSMV estimator in Mplus) estimation and varimax rotation was performed on data for the present female subsample. A second EFA was then conducted on the male group data using a variant of Procrustes rotation, operationalized via the target rotation specification in Mplus. For this EFA, the male group factor solution was orthogonally rotated to conform to the target female loading matrix. This matrix is available in the supplemental materials accompanying this paper. Finally, congruence coefficients (as per Equation 1) and factor pattern Pearson
correlations were computed to assess the degree of factor pattern correspondence. Consistent with Hopwood and Donnellan (2010), we considered coefficients greater than .95 and
between .85 and .94 as indicative of strong and fair factor structure similarity, respectively (Lorenzo-Seva & Ten Berge, 2006).
of the ESEM solution, the ICM-CFA should be preferred on the basis of parsimony. As per Marsh et al. (2010), for both the CFA and ESEM structures, we specified all 57 correlated residuals reflecting presumed intradimensional local dependence generated by item-clustering due to common facet representations. The second phase involved tests of measurement invariance across gender to illustrate the MG-ESEM approach to factor replicability
evaluation. These MG tests were conducted according to the taxonomy proposed in Table 1 adapted for polytomous data (Guay, Morin, Litalien, Valois, & Vallerand, 2014; Millsap & Yun-Tein, 2004). For the configurally invariant model, identification is achieved by (a) fixing item residual variances to one in the first group and freely estimating these
uniquenesses in the comparison group, (b) fixing the first two thresholds for one indicator per factor and the first threshold of all other indictors to equality across groups, (c) fixing all factor variances to one, and (d) fixing factor means to zero in the first group and freely estimating these in the second group (Guay et al., 2014). The final phase of the analysis involved the evaluation of the criterion validity of NEO-FFI responses. A general model was specified with links from the Big-Five factors to CO, CA and AA.
For the assessment of model fit, we did not rely on the χ2
test given its sample size dependency and restrictive hypothesis test (i.e., exact fit). Instead, three approximate fit indices were used to assess model fit as follows: Comparative fit index (CFI) and Tucker-Lewis Index (TLI), > .90 and .95 for acceptable and excellent fit, respectively; and RMSEA, < .05 and .08 for close and reasonable fit, respectively (Marsh, Hau, & Wen, 2004). For nested model comparisons, although we report the corrected χ2
difference test (MD χ2), because the MD χ2
support for a more parsimonious model (Chen, 2007; Cheung & Rensvold, 2002; Guay et al., 2014).
Factor Congruence
Table 2 shows the congruence coefficients and factor pattern Pearson correlations for the NEO-FFI factors computed on the basis of the targeted orthogonal rotation of the male factor structure to factor pattern coefficients obtained in the varimax rotated female solution. All coefficients were above the .95 threshold considered to be indicative of strong factor structure generalizability.
INSERT TABLE 2 ABOUT HERE Latent Structure of the NEO-FFI
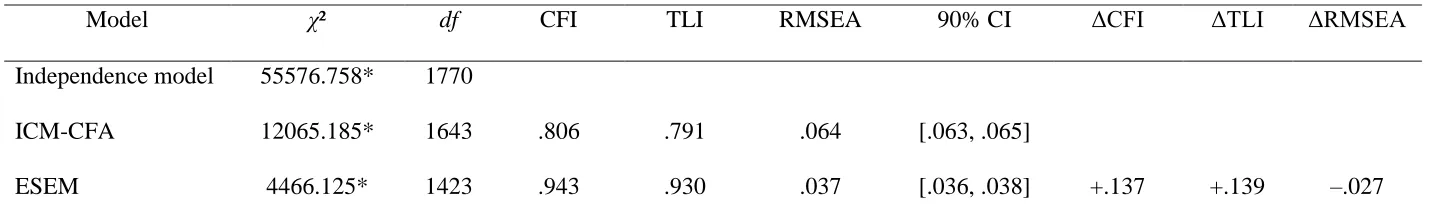
Table 3 shows the fit statistics for the ICM-CFA and ESEM representations of the NEO-FFI structure for the total group data. The test of the ICM-CFA resulted in an
unacceptable fit to the data whereas the ESEM solution provided an acceptable-to-good fit. The ESEM solution fitted the data appreciably better than the ICM-CFA and was retained for further analysis.
INSERT TABLE 3 ABOUT HERE Measurement Invariance
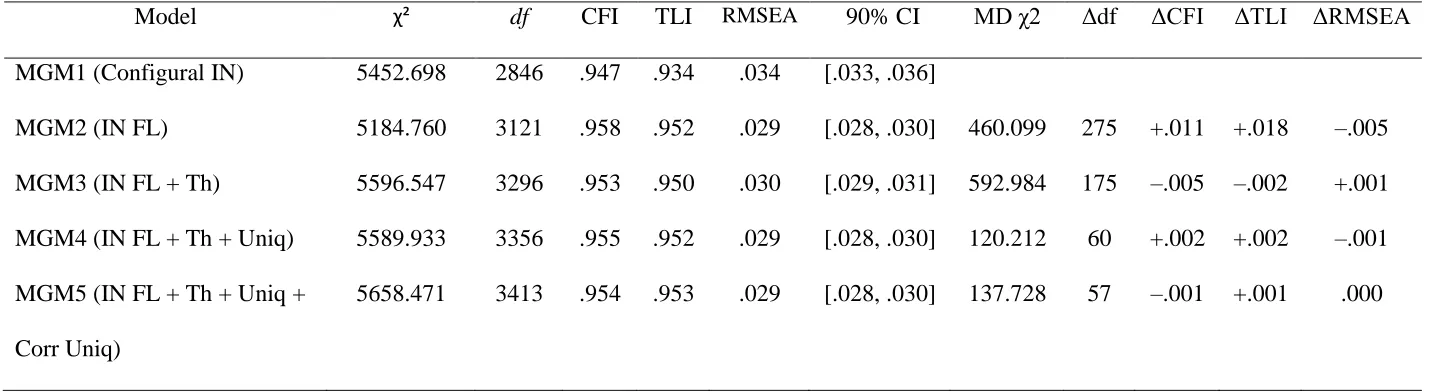
The retained ESEM structure was subjected to tests of invariance across gender. As shown in Table 4, the configurally invariant model (MGM1) provided an acceptable fit to the data. This baseline model was compared to the more restrictive weak measurement
additional equality constraints should be considered haphazard (see Guay et al., 2014). The weak factorial invariance model was compared to an even more restrictive model of strong measurement invariance (MGM3) with additional equality constraints imposed on the item thresholds. This model resulted in an acceptable fit to the data in absolute terms and, importantly, no appreciable degradation in fit relative to the less restrictive weak factor invariance model, which is suggestive of the equivalence of item thresholds.
Next, a model of strict measurement invariance was tested in which additional constraints were imposed on the item uniquenesses (MGM4). This model resulted in an acceptable fit to the data, and no decrement in fit relative to the less constrained strong factorial invariance model; thus, the model supports the generalizability of the NEO-FFI residual item variances. Although evidence of strict factorial invariance is sufficient for establishing measurement invariance in line with Mellenbergh’s (1989) definition of unbiasedness, we also tested the invariance of the specified correlated uniquenesses as this test would provide information on the generalizability of the presumed shared systematic item variance due to unmodeled facet clustering across samples. Accordingly, a model with additional invariance constrains imposed on the correlated residuals was tested (MGM5). This model provided a good fit to the data, and no appreciable decrement in fit relative to the model of strict measurement invariance, indicating the equivalence of correlated
uniquenesses.
INSERT TABLE 4 ABOUT HERE Criterion Validity
and a pseudo-latent CFA achievement factor indicated by GPA with an a priori reliability correction. For the indicators of CO and CA, we specified 14 correlated residuals reflecting intradimensional local dependence due to potential method effects emerging from highly-similar item phrasing and content (e.g., “It is difficult for me to set career goals”, “It is difficult to relate my abilities to a specific career plan”; see the supplemental materials for a full list of correlated residuals). To manage the haphazard missingness on GPA, pairwise present methods— the default under WLSMV in Mplus when no covariates are included— were used. The eight factor measurement model provided a good fit to the data, χ2 (2982) = 7433.206, p < .001, RMSEA = .031 (95% CI = .030, .032), CFI = .952, TLI = .945.
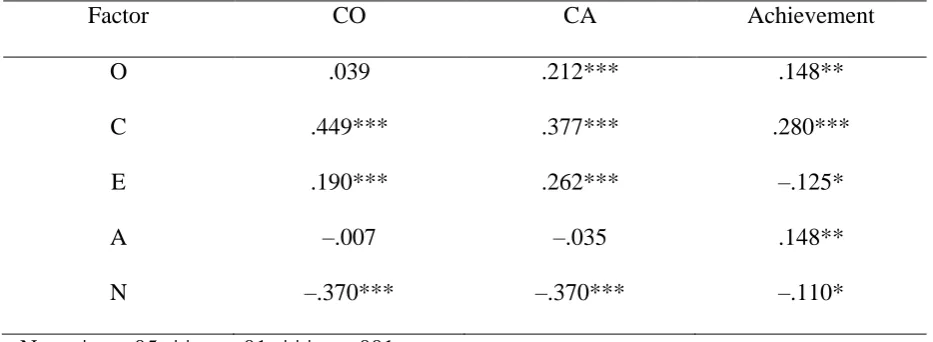
We then tested the structural model with direct paths from the personality factors to CO, CA and AA. As a structurally saturated model, this parametric structure provided an identical fit to the data as the measurement solution. As shown in Table 5, for the career engagement criteria, C was consistently the strongest positive predictor whereas N was a consistent negative predictor. E significantly predicted CO and CA, though these effects were relatively smaller. O was a small, but significant, positive predictor of CA but was not significantly associated with CO, and A was virtually unrelated to both career outcomes. For AA, C was the strongest predictor; O and A were weak positive predictors, and E and N were weak negative predictors.
INSERT TABLE 5 ABOUT HERE Discussion
female groups are highly comparable. These results are consistent with extant studies on the replicability of factors estimated from NEO data across diverse independent samples
(McCrae et al., 2002; McCrae, Costa, Del Pilar, Rolland, & Parker, 1998; McCrae et al., 1996; Saucier, 1998). Despite the widespread use of congruence measures in personality research, these descriptive indices are limited in the evaluation of factor replicability. Chief among the shortcomings is the inability of congruence measures to detect factor structure invariance beyond the equivalence of factor loadings (Dolan et al., 2009). Indeed, metric invariance is a necessary but not sufficient condition for determining the complete
equivalence of factor structures across groups (Meredith, 1993).
The present study proposed MG-ESEM as an alternative for the evaluation of factor structure replicability that overcomes the limitations of congruence measures. The MG-ESEM method has a significant advantage over congruence measures insofar as tests of full measurement invariance can be performed (Marsh et al., 2009; Morin et al., 2013). Notably, these invariance tests can be conducted on EFA measurement structures that, unlike the ICM-CFA, can sufficiently account for the construct-relevant multidimensionality of personality items. Furthermore, ESEM allows for the specification of correlated residuals with EFA factors that may be useful for adequately representing true construct-irrelevant item multidimensionality in personality inventories (e.g., method effects). In the current study, evidence was obtained for the measurement invariance of the NEO-FFI factor structure across gender, including item factor loadings, thresholds and uniquenesses. Notably, this evidence for the equality of factor loadings converges with the obtained congruence statistics. However, the MG-ESEM yields superior evidence for factor structure equivalence by
systematic variation in the NEO-FFI items above and beyond the substantive factors. Given that sources of shared construct-irrelevant systematic variation in test items are likely to be the rule rather than the exception for many personality inventories, we encourage formal tests of the equivalence of postulated correlated residuals as part of measurement invariance testing. Such tests will lead to better understandings of the true measurement structure underlying personality data. The extended taxonomy of invariance tests in Table 1 is designed to operationalize this process.
Quite apart from demonstrating the MG-ESEM approach as an alternative to congruence measures for evaluating factor structure replicability, the present study yielded important data supporting the validity of NEO-FFI scores. For instance, though previous research shows partial support for the measurement invariance of the NEO-FFI (Marsh et al., 2010), this evidence may be limited to the extent that the equality of thresholds, which are a key characteristic of the polytomous data generated by the NEO-FFI, has not been
considered. The present study yielded evidence for the equivalence of NEO-FFI item thresholds across gender, which is suggestive of the absence of monotonic differential item functioning. Furthermore, consistent with Rottinghaus and Miller’s (2013) integrative framework linking personality dimensions with characteristic adaptations and the original validation of the measures of CO and CA (Rottinghaus et al., 2005), both constructs showed significant positive moderate correlations with C, and significant negative moderate
A few limitations of ESEM and the present research itself merit attention as they serve to guide the appropriate use of the analytic approach and interpretation of the current findings. First, current operationalizations of ESEM in statistical software programs do not permit the specification of higher-order models, which may complicate the evaluation of the replicability of higher-order factors. Likewise, it is not currently possible to specify partial weak factorial invariance in the ESEM framework, which may be of substantive interest to researchers in the evaluation of factor structure consistency. To circumvent both these limitations, Marsh, Nagengast, and Morin (2013) have proposed the ESEM within CFA (EwC) approach. This method involves “importing” a rotated ESEM measurement model into a conventional CFA framework, thereby allowing for full CFA functionality with ESEM factors. A second limitation concerns the criteria used for evaluating model fit in this study. Although consistent with current recommendations, these criteria may not be appropriate for ESEM. This is because guidelines for assessing fit are largely based on simulations in which population-generating models are ICM-CFA structures or slightly more complex
specifications with few cross-loadings (Hu & Bentler, 1999). Accordingly, it is not clear how fit indices behave in the ESEM context. A related limitation concerns the use of changes in approximate fit indices (e.g., CFI) to compare nested models. Although the behavior of fit indices for nested models comparisons have been investigated for models with continuous data under maximum likelihood estimation, it is not clear whether these results generalize to the comparison of models estimated under WLSMV. Thus, caution is urged in the
interpretation of the invariance tests reported in this study.
References
Abraham, C., & Bond, R. (2012). Psychological correlates of university students' academic performance: A systematic review and meta-analysis. Psychological Bulletin, 138, 353-387. doi: 10.1037/a0026838
Bacon, D. R., & Bean, B. (2006). GPA in research studies: An invaluable but neglected opportunity. Journal of Marketing Education, 28, 35-42. doi:
10.1177/0273475305284638
Byrne, B. M., Shavelson, R. J., & Muthén, B. (1989). Testing for the equivalence of factor covariance and mean structures: The issue of partial measurement invariance. Psychological Bulletin, 105, 456. doi: 10.1037/0033-2909.105.3.456
Chan, W., Ho, R. M., Leung, K., Chan, D. K. S., & Yung, Y.-F. (1999). An alternative method for evaluating congruence coefficients with Procrustes rotation: A bootstrap procedure. Psychological Methods, 4, 378-402. doi: 10.1037/1082-989x.4.4.378 Chen, F. F. (2007). Sensitivity of goodness of fit indexes to lack of measurement invariance.
Structural Equation Modeling: A Multidisciplinary Journal, 14, 464-504. doi: 10.1080/10705510701301834
Cheung, G. W., & Rensvold, R. B. (2002). Evaluating goodness-of-fit indexes for testing measurement invariance. Structural Equation Modeling: A Multidisciplinary Journal, 9, 233-255. doi: 10.1207/s15328007sem0902_5
Church, A. T., & Burke, P. J. (1994). Exploratory and confirmatory tests of the big five and Tellegen's three-and four-dimensional models. Journal of Personality and Social Psychology, 66, 93-114. doi: 10.1037/0022-3514.66.1.93
Dolan, C. V., Oort, F. J., Stoel, R. D., & Wicherts, J. M. (2009). Testing measurement invariance in the target rotated multigroup exploratory factor model. Structural Equation Modeling: A Multidisciplinary Journal, 16, 295-314. doi:
10.1080/10705510902751416
Guay, F., Morin, A. J. S., Litalien, D., Valois, P., & Vallerand, R. J. (2014). Application of exploratory structural equation modeling to evaluate the academic motivation scale. The Journal of Experimental Education, 83, 51-82. doi:
10.1080/00220973.2013.876231
Hopwood, C. J., & Donnellan, M. B. (2010). How should the internal structure of personality inventories be evaluated? Personality and Social Psychology Review, 14, 332-346. doi: 10.1177/1088868310361240
Horn, J. L. (1967). On subjectivity in factor analysis. Educational and Psychological Measurement, 27, 811-820.
Hu, L. t., & Bentler, P. M. (1999). Cutoff criteria for fit indexes in covariance structure analysis: Conventional criteria versus new alternatives. Structural Equation
Modeling: A Multidisciplinary Journal, 6, 1-55. doi: 10.1080/10705519909540118 Lorenzo-Seva, U., & Ten Berge, J. M. (2006). Tucker's congruence coefficient as a
meaningful index of factor similarity. European Journal of Research Methods for the Behavioral and Social Sciences, 2, 57-64. doi: 10.1027/1614-2241.2.2.57
Marsh, H. W., & Hocevar, D. (1985). Application of confirmatory factor analysis to the study of self-concept: First- and higher order factor models and their invariance across groups. Psychological bulletin, 97, 562-582. doi: 10.1037/0033-2909.97.3.562 Marsh, H. W., Lüdtke, O., Muthén, B., Asparouhov, T., Morin, A. J., Trautwein, U., &
Nagengast, B. (2010). A new look at the big five factor structure through exploratory structural equation modeling. Psychological Assessment, 22, 471-491. doi:
10.1037/a0019227
Marsh, H. W., Lüdtke, O., Nagengast, B., Morin, A. J., & Von Davier, M. (2013). Why item parcels are (almost) never appropriate: Two wrongs do not make a right—
Camouflaging misspecification with item parcels in CFA models. Psychological Methods, 18, 257. doi: 10.1037/a0032773
Marsh, H. W., Morin, A. J., Parker, P. D., & Kaur, G. (2014). Exploratory structural equation modeling: an integration of the best features of exploratory and confirmatory factor analysis. Annual Review of Clinical Psychology, 10, 85–110. doi: 10.1146/annurev-clinpsy-032813-153700
Marsh, H. W., Muthén, B., Asparouhov, T., Lüdtke, O., Robitzsch, A., Morin, A. J. S., & Trautwein, U. (2009). Exploratory structural equation modeling, integrating CFA and EFA: Application to students' evaluations of university teaching. Structural Equation Modeling: A Multidisciplinary Journal, 16, 439-476. doi:
10.1080/10705510903008220
McCrae, R. R., & Costa Jr, P. T. (2008). A five-factor theory of personality. In O. P. John, R. W Robins, & L. A Pervin (Ed.), Handbook of personality: Theory and research (Vol. 3, pp. 159-181). New York, NY: Guilford press.
McCrae, R. R., Costa Jr, P. T., Terracciano, A., Parker, W. D., Mills, C. J., De Fruyt, F., & Mervielde, I. (2002). Personality trait development from age 12 to age 18:
Longitudinal, cross-sectional and cross-cultural analyses. Journal of Personality and Social Psychology, 83, 1456-1468. doi: 10.1037/0022-3514.83.6.1456
McCrae, R. R., Costa, P. T., Del Pilar, G. H., Rolland, J.-P., & Parker, W. D. (1998). Cross-\cultural assessment of the Five-Factor Model: The Revised NEO Personality Inventory. Journal of Cross-Cultural Psychology, 29, 171-188. doi:
10.1177/0022022198291009
McCrae, R. R., Zonderman, A. B., Costa Jr, P. T., Bond, M. H., & Paunonen, S. V. (1996). Evaluating replicability of factors in the Revised NEO Personality Inventory: Confirmatory factor analysis versus Procrustes rotation. Journal of Personality and Social Psychology, 70, 552-566. doi: 10.1037/0022-3514.70.3.552
Mellenbergh, G. J. (1989). Item bias and item response theory. International Journal of Educational Research, 13, 127-143. doi:
http://dx.doi.org/10.1016/0883-0355(89)90002-5
Meredith, W. (1993). Measurement invariance, factor analysis and factorial invariance. Psychometrika, 58, 525-543. doi: 10.1007/bf02294825
Millsap, R. E., & Yun-Tein, J. (2004). Assessing factorial invariance in ordered-categorical measures. Multivariate Behavioral Research, 39, 479-515. doi:
Morin, A., Arens, A. K., & Marsh, H. W. (Accepted, 22 August 2014). A bifactor exploratory structural equation modeling framework for the identification of distinct sources of construct-relevant psychometric multidimensionality. Structural Equation Modeling Morin, A., Marsh, H., & Nagengast, B. (2013). Exploratory structural equation modeling. In
G. R. Hancock & R. O. Mueller (Eds.), Structural equation modeling: A second course (pp. 395-436). Charlotte, NC: IAP.
Mulaik, S. A. (1972). The foundations of factor analysis. New York, NY: McGraw-Hill. Muthén, L. K., & Muthén, B. O. (1998-2014). Mplus user’s guide. Los Angeles, CA: Muthén
& Muthén.
O’Connor, M. C., & Paunonen, S. V. (2007). Big Five personality predictors of
postsecondary academic performance. Personality and Individual Differences, 43, 971–990. http://dx.doi.org/10.1016/j.paid.2007.03.017
Paunonen, S. V. (1997). On chance and factor congruence following orthogonal Procrustes rotation. Educational and Psychological Measurement, 57, 33-59. doi:
10.1177/0013164497057001003
Pozzebon, J. A., Ashton, M. C., & Visser, B. A. (2014). Major changes in personality, ability, and congruence in the prediction of academic outcomes. Journal of Career
Assessment, 22, 75-88. doi: 10.1177/1069072713487858
Reise, S. P., Waller, N. G., & Comrey, A. L. (2000). Factor analysis and scale revision. Psychological Assessment, 12, 287-297. doi: 10.1037/1040-3590.12.3.287 Richardson, M., Abraham, C., & Bond, R. (2012). Psychological correlates of university
Rottinghaus, P. J., Day, S. X., & Borgen, F. H. (2005). The Career Futures Inventory: A measure of career-related adaptability and optimism. Journal of Career Assessment, 13, 3-24. doi: 10.1177/1069072704270271
Rottinghaus, P. J., & Miller, A. D. (2013). Convergence of personality frameworks within vocational psychology. In B. W. Walsh, M. L. Savickas, & P. J. Hartung (Eds.), Handbook of vocational psychology: Theory, research, and practice (4th ed., pp. 105–131). New York, NY: Routledge
Saucier, G. (1998). Replicable Item-Cluster Subcomponents in the NEO Five-Factor Inventory. Journal of Personality Assessment, 70, 263-276. doi:
10.1207/s15327752jpa7002_6
Table 1.
Extended Taxonomy of Invariance Tests in the MG-ESEM framework based on Marsh et al. (2009)
Model Equivalent Parameters Model Nesting
Model 1 No invariance constraints (configural invariance) Nil Model 2 FL (weak measurement invariance) 1
Model 3 FL + CU 1, 2
Model 4 FL + U 1, 2
Model 5 FL + U + CU 1–4
Model 6 FL + FVCV 1, 2
Model 7 FL + FVCV + CU 1–3, 6
Model 8 FL + INTa (strong measurement invariance) 1, 2
Model 9 FL + INT + CU 1–3, 8
Model 10 FL + U + FVCV 1, 2, 4, 6
Model 11 FL + U + CU + FVCV 1–7, 10
Model 12 FL + INT + U (strict measurement invariance)b 1, 2, 4, 8
Model 13 FL + INT + U + CU 1–5, 8, 9
Model 14 FL + INT + FVCV 1, 2, 6, 8
Model 15 FL + INT + FVCV + CU 1–3, 6–9
Model 16 FL + INT + U + FVCV 1, 2, 4, 6, 8, 10, 12, 14
Model 17 FL + INT + U + CU + FVCV 1–16
Model 18 FL + INT + FM (latent mean invariance) 1, 2, 8
Model 19 FL + INT + CU + FM 1–3, 8–9, 18
Model 20 FL + INT + U + FM (manifest mean invariance) 1, 2, 4, 8, 12, 19
Model 22 FL + INT + FVCV + FM 1, 2, 6, 8, 14, 18 Model 23 FL + INT + CU + FVCV + FM 1–3, 6–9, 14–19, 22 Model 24 FL + INT + U + FVCV + FM (complete factorial
invariance)
1, 2, 4, 6, 8, 10, 12, 14, 16, 18, 20, 22
Model 25 FL + INT + U + CU + FVCV + FM 1–24
Table 2
Congruence Coefficients for the NEO-FFI Personality Factors in Male and Female Samples
Factor O C E A N
Tucker’s Coefficient
.972 .978 .963 .966 .978
Pearson Correlation
.974 .974 .957 .960 .978
Table 3
Model Fit Statistics for the ICM-CFA and ESEM Measurement Structures
Note. N = 1566; * p < .001; df = degrees of freedom; CFI = Comparative fit index; TLI = Tucker-Lewis index; RMSEA = Root Mean Square Error of Approximation; CI = Confidence interval;
Model χ² df CFI TLI RMSEA 90% CI ΔCFI ΔTLI ΔRMSEA
Independence model 55576.758* 1770
ICM-CFA 12065.185* 1643 .806 .791 .064 [.063, .065]
Table 4
Fit Statistics for Models of Measurement Invariance across Gender.
Model χ² df CFI TLI RMSEA 90% CI MD χ2 Δdf ΔCFI ΔTLI ΔRMSEA
MGM1 (Configural IN) 5452.698 2846 .947 .934 .034 [.033, .036]
MGM2 (IN FL) 5184.760 3121 .958 .952 .029 [.028, .030] 460.099 275 +.011 +.018 –.005 MGM3 (IN FL + Th) 5596.547 3296 .953 .950 .030 [.029, .031] 592.984 175 –.005 –.002 +.001 MGM4 (IN FL + Th + Uniq) 5589.933 3356 .955 .952 .029 [.028, .030] 120.212 60 +.002 +.002 –.001 MGM5 (IN FL + Th + Uniq +
Corr Uniq)
5658.471 3413 .954 .953 .029 [.028, .030] 137.728 57 –.001 +.001 .000
Table 5
Standardized Path Coefficients for the Regression of CO, CA and AA on the Big-Five Factors
Factor CO CA Achievement
O .039 .212*** .148**
C .449*** .377*** .280***
E .190*** .262*** –.125*
A –.007 –.035 .148**
N –.370*** –.370*** –.110*