Wind load Identification of a guyed mast inversely
from full-scale response measurement
A. Kazemi Amiri
Vienna Doctoral Programme on Water Resource Systems, Karlsplatz 13/222, A-1040 Vienna, Austria
E-mail: mehrad [email protected]
C. Bucher
Center for Mechanics and Structural Dynamics, Karlsplatz 13/206, A-1040 Vienna, Austria
E-mail: [email protected]
Abstract. This paper presents a procedure for the wind load identification and the results of its practical application. The wind loads are inversely reconstructed in time domain from measured structural response by means of an augmented impulse response matrix. The inherent noise amplification arising from the ill-posed inverse problem is resolved through Tikhonov regularization. In order to increase the accuracy in solving the inverse problem along with the availability of the measured response just at a limited number of sensor locations, the problem is projected onto the modal coordinates. Consequently the modal wind loads are identified in modal subspace for several single degree of freedom systems, whose characteristic parameters are obtained by an operational modal analysis procedure. The structure under measurement is a 9.1m(30f t) tall guyed mast consisting of tubular elements. Since the direct wind pressure/load measurements on the structural members are almost impossible in full-scale testing, numerical simulation was also implemented to verify the results of experimental load identification by analogy. The load identification results are provided in time and frequency domain. Numerical simulation, where actual loads are available, confirm the capability of the method in identification of modal wind loads. Then based on the existing analogy between the simulation and practical application results, the identified loads from field measurements are validated.
1. Introduction
The problem of load identification is an example of inverse problems with application in structural dynamics and vibrations. Dynamic load identification is performed for different purposes like in engine-induced vibrations of vehicle chassis [1, 2], moving loads on bridges [3, 4, 5] or in wind-induced vibration of structures [6, 7]. Dynamic load identification (e.g. wind loads) becomes more demanding, when the features of the excitation source due to its nature and the constraints of man-made apparatus cannot be directly observed through measurements. A good knowledge on dynamic loads gives several advantages to engineers from the design phase up to the post-analysis for instance in health monitoring of the under-service structures. For instance the obtained information the wind load identification from the field measurement data can be beneficial to verify the wind tunnel test data. Another use of the identified wind load data
takes place in reliability and risk assessment of under-service structures [8]. For the structures subjected to the wind fatigue damage, depending on their degree of importance, a continuous or discontinuous vibration monitoring data might be available. From those data the wind load can be identified and accordingly be utilized for failure probability prognosis of the damaged structures.
Nevertheless the number of those studies on wind load reconstruction is not significant in comparison with the amount of researches, generally conducted in structural dynamic load identification area. Hence there is a tangible need for more research particularly on the wind load related issues from different aspects. One can categorize the studies on the problem of load identification according to the way it is to be treated. One method is to solve the problem, despite the insufficient number of measured point on the structure, in the physical domain in which measurement has been done. For example in [9] the iterative simulations of wind speeds, based on the identified parameters of wind filed of a structure’s site, play an important role in order to provide data for unmeasured points.
Another approach is to transform the problem into another subspace (e.g. modal subspace) fdiffeeto truncate the number of unknowns to the number of equations, available from the measurement data [10]. In [10] the modal wind loads has been recovered by using the Kalman filtering scheme for state estimation of system. However this approach does not directly tackle the noise magnification problem and instead suggests to additionally apply low-pass filter on the measurement data to remove noise in relatively higher frequencies. Here having a good knowledge on the noise properties is inevitable in order to set the cutoff frequency and filter type, which is usually out of reach due to various and variable noise sources. In [11] an augmented Kalman filter was introduced, trying to identify the load as input signal, while simultaneously tries to relieve the noise effect. However in that study it was demonstrated that still the Tikhonov type solutions are more robust in different situations. Recently [12] stated that by an expert guess on the covariance of the input and through a proposed dual Kalman filter, the drift effect in the estimated input load via implementing the augmented Kalman filter can be avoided.
In this study, with respect to the above-mentioned points, an approach for wind load identification is sought, which is applicable when the following conditions hold: a) Additional data or information on the wind characteristics of structure’s site, acting wind load or noise nature is unavailable. b) Structural response just on a limited number of points can be measured.
c) The noise effect within solving the inverse problem should be resolved. d) Only structural modal characteristics (Natural frequencies, mode shapes and damping ratios) through a system identification method and accordingly modal analysis are available.
In this paper a procedure for the inverse wind load identification and its application to a real case study are presented. This novel procedure requires only the response data derived from the field measurement, conducted for the structure undergoing wind vibration. The so-called augmented impulse response matrix, necessary to construct the input-output (dynamic load-response) relation, is generated based on a previous work of the authors [13]. The structure under study is a 9.1 m (30f t) tall guyed mast with tubular elements, which is serving as a weather station tower in the Hydrological Open Air Laboratory Petzenkirchen [14]. The wind-induced acceleration response of the structure has been measured along the height of mast. Thereof the modal characteristics of the structure has been identified based on the stochastic subspace identification method [15]. According to [13], the displacement-based identified wind load outperforms its acceleration-based counterpart. Therefore the acceleration signal is integrated twice by means of fast Fourier transform in frequency domain to obtain the displacement responses for reconstruction of the wind loads [16].
The analogy between the recovered modal wind load results of the numerical simulation and practical field application provides useful information on how to verify the identified modal wind loads.
2. Wind load reconstruction procedure
In this section the procedure of the wind load identification in the modal subspace will be explained step-by-step. Also the fundamental practical and theoretical explanations are within each step provided.
Firstly it is considered the equation of motion of a linear multiple degrees of freedom structural system with mass m, stiffness k and the classical damping c, and then by the substitutions
u(t) =Φq(t) and P=ΦTp, its corresponding uncoupled set of one degree of freedom systems in modal coordinates are obtained [17, 18]:
m¨u+c ˙u+ku=p(t) (1a)
¨
q+ 2diag[ζiωi]q˙ +diag[ωi2]q=P(t) (1b)
where ζi, ωi denote the damping ratio and natural circular frequency at ith mode respectively. Afterwards the introduced procedure comprises the following steps:
(i) Identification of the structural modal parameters i.e. ωi,Φir andζi.
For this study those parameters were gained by means of an operational modal analysis, whose results are given in section 3.2. Hereafter the subscription r refers to the reduced set of identified mode shapes or measured response vectors, since those are just available at the sensor locations.
(ii) Decompose the measured responses acquired from different sensor channels mounted on the structure by means of the following equation:
˜
q(t) =Φ†rur(t) (2)
in which Φ† =
ΦTr Φr
−1
ΦTr and q˜(t) denote the pseudo inverse of the incomplete mode shapes matrix and the approximated modal response matrix, respectively.
(iii) Check the validity of the decomposed modal responses by means of its power spectrum or simply its Fourier transform; Such that each modal response must only have one dominant vibration frequency corresponding to the natural frequency of the system at that mode. To this end the contribution of all modes within the existing frequency range must be de-composed.
(iv) Given the modal parameters for a number of vibration modes, the augmented modal response matrix (IRM) of the system is generated for each vibration mode [13].
The IRM together with the decomposed modal responses from step ii are utilized to set up the input-output relation for the inverse identification of the acting modal wind load, that isPi, in the relation below:
{qi}=h¯di
{Pi} (3)
¯
hdi ∈Rl∗lstands for the augmented displacement impulse response matrix at theithmode,
while l is equal to the total number of time steps. This matrix is derived based on the displacement impulse response functionhi(t) for each mode [13]:
hi(t) =
e−ζiωit Miωdi
whereωdi is the damped natural circular frequency ofi
th mode.
(v) Since Eq. 3 is ill-posed, it consequently can not be solved directly for Pi. Alternatively it
is benefitted from the Tikhonov regularization scheme in order to identify the estimation of modal wind loadsPi˜ [19]:
min qi˜ −
¯
hdiPi˜
2 +λ2i
Pi˜ 2 (5)
Prior to solving the preceding optimization problem,λi the optimal regularization parame-ter, should be determined for each mode in conjunction with Lcurve [20, 21] or generalized cross validation (GCV) [22].
(vi) If required the identified modal wind load can be transferred to another structure’s modal subspace for the post analyses. Therefore it is looked for a transfer matrix T, so that the modal subspaces between two structures can be exchanged, considering thatP=ΦTp:
TPSt˜ 1 = ˜PSt2 ⇒ T ΦSt1 =ΦSt2 (6)
where ˜PSt1 and ˜PSt2 denote the wind loads in the modal subspace of the primary and
the modified structure. Then right multiplication by MSt1ΦSt1 and considering that ΦTSt1MSt1ΦSt1 =I, renders:
T=ΦTSt2MSt1ΦSt1 (7)
3. Field measurement results and reconstructed wind loads verification 3.1. The structure and measurement setup
The structure under measurement is located in the middle of corn fields in Petzenkirchen, Lower Austria and serving as a weather station tower for mounting the meteorological sensors in the Hydrological Open Air Laboratory (HOAL) [14]. It is a 9.1m(30f t) tall guyed mast, consisting of three parts. It has an equilateral triangular cross section, whose dimension respectively from bottom to top is [0.35, 0.27, 0.21]cm (see F ig. 1a). Each part of the mast is composed of three main legs and horizontal as well as the cross bracing elements all made up of aluminum alloy. Three cables from either side account for the additional lateral constraint on the upper part of the mast, in order to prevent the wind over loads. Figure 1b shows an in-situ picture of the mast structure.
The wind-induced acceleration response of the structures is measured in horizontal plane of the mast via capacitive accelerometers. An almost evenly distributed configuration for the sensor locations was adopted, which are marked as [S1:S7] in Fig 1a. It was avoided to mount the sensors very close to the locations of guys connection, since the vibration intensity around those points is poor. The acceleration response was measured in two perpendicular direction (i.e. x
and y) at [S1, S3, S5, S6, S7], while in the rest of the locations namely [S2, S4] the response was measured just in one direction (y) in order to deliver the additional lateral measurement. As a result, there are 12 measurement channels in total. Through this sensor configuration one can measure general motion of the structure for a proper system identification, especially to take into account the coupled bending-torsional modes.
3.2. operational modal analysis
30 ft = 9.144 m
Panel
Part 1
Part 2
Part 3
S1 S2 S4
S3 S5
S6 S7
x y
z
(a) Side view of the mast structure and response sensor
[image:5.595.146.460.114.477.2]locations (b) Picture of the instrumented guyedmast
Figure 1: The representation of the mast structure and the sensor configuration details
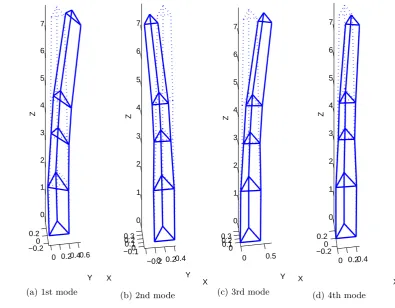
four vibration modes, which exist less than 5 Hz. Following, the system identification results regarding the four identified modes are provided in Table 1 and Fig. 2. Note that in reality the identified mode shapes from experimental vibration data are complex-valued vectors [26, 27]. As such the identified mode shapes were realized via utilizing the complex transformation matrix [28, 29].
Table 1: The identified natural frequencies and damping ratios of the mast structure
Mode 1 2 3 4
Eigenfrequency (Hz) 3.03 3.31 3.44 3.53 Damping ratio (%) 0.52 1.36 0.90 0.91
3.3. Identification of the wind load
0 0.20.40.6 −0.20 0.2 0 1 2 3 4 5 6 7 X Z Y
(a) 1st mode
−0.20 0.20.4 −0.10.10
0.2 0.3 0 1 2 3 4 5 6 7 X Z Y
(b) 2nd mode
0 0.5 0 0.1 0.2 0.3 0 1 2 3 4 5 6 7 X Z Y
(c) 3rd mode
0 0.20.4 −0.20 0.2 0 1 2 3 4 5 6 7 X Z Y
[image:6.595.80.476.115.423.2](d) 4th mode
Figure 2: The representation of the identified mode shapes
Some studies compare the retrieved responses from identified wind loads with the actual measured responses. However since Eq. 3 is derived based on the convolution integral (a Fredholm integral equation of the first kind ), the IRM has smoothing effect on the applied load. It means that for a highly or slightly fluctuating identified load, apart from its validity, the identical response is retrieved [21, 30]. Consequently comparison between the retrieved and measured responses is not a good choice.
As a result in this contribution, the numerical simulation of the same problem was implemented, additionally. Following the time and frequency domain similarities between the features of the field and simulation reconstructed wind loads, the validity of the field results can be cross-checked.
3.3.1. Simulation of the wind load reconstruction For the sake of numerical simulation the full-scale finite element model (FEM) of the mast structure was built in SlangTNG [31]. The damping matrix of the FEM model was created by means of Rayleigh damping, assuming 0.01 damping ratio for the first two modes. The first three eigenfrequencies of the FEM model of the structure are closely located across 3 Hz similar to that of the real mast structure. Those eigenfrequencies are 3.03, 3.23 and 3.34 Hz, respectively. Consequently these three modes are adopted for verification of modal wind load identification in the real application.
of the virtual sensors is similar to the sensor configurations in Fig. 1a.
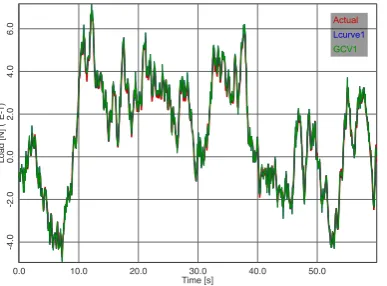
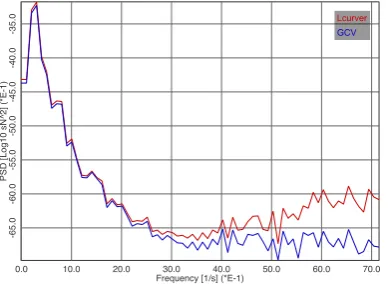
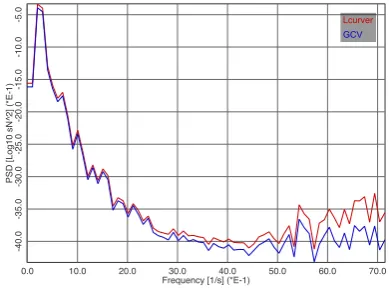
The time history and the power spectrum of the reconstructed wind loads are illustrated in Fig. 3, where the results gained by Lcurve and GCV are almost identical and of a high accuracy. The noise level for this set of the results was set to 10%. Generally at each mode a slight deviation of the identified signal power spectrum from that of the actual signal occurs after the natural frequency of that mode and consequently the background signal is correctly identified. Thus there is a negligible discrepancy between the identified and actual modal wind load signal’s time history.
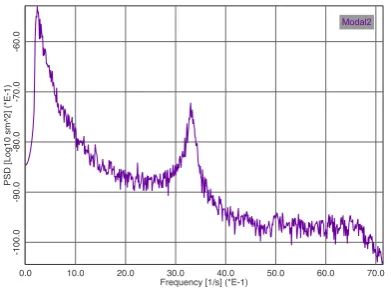
3.3.2. Real application of the wind load identification procedure The measured acceleration response is converted to the displacement response by means of integration, twice in frequency domain through the fast Fourier transform scheme [16]. Then the resulted displacement signals are decomposed into their modal responses by the application of the identified mode shapes according to Eq. 2. The decomposed modal displacements responses pertaining to the first four modes are shown in Fig. 4. This figure confirms the validity of the decomposed modal responses, such that the power spectrum of each modal response has just one peak pertaining to its natural frequency.
In the next step the displacement modal impulse response matrices are constructed according to the identified modal information in Table 1. The total time length was considered to be 60 seconds and the Eq. 3 is afterwards solved for the modal wind loads by means of the Eq. 5 through Lcurve and GCV methods. The time history and power spectrum of the identified modal wind loads are given in Fig. 5. According to Fig. 5, the Lcurve and GCV responses are almost the same in time history plots. There exist an analogy in terms of a slight deviation of the identified loads power spectrum after the natural frequency at each mode, similar to what was described in section 3.3.1 and showed in Figs 3. As a result, although the actual modal wind loads are not available but due to the existing similarities between the field and numerical results and since the simulation results are sufficiently accurate, the field application results can be indirectly verified through this cross-check.
4. Conclusion
This contribution presented the inverse reconstruction of the wind loads from the full-scale field measurement data of the structural vibration response. The major focuse was drawn to the technical aspects of the practical application of the introduced procedure in conjunction with the theoretical bases. The information for the wind load identification was gained solely from the acquired measurement data and no additional assumption for the structural properties or the wind characteristics of the structure’s site were necessary to be made.
The wind loads are recovered in the modal subspace of the structure in time domain from displacement responses, using the augmented modal impulse response matrices. The Tikhonov solution was utilized in conjunction with the methods of Lcurve and GCV for tackling the inherent ill-posedness of the inverse load identification problem. The structural modal properties were obtained by means of an operational modal analysis from the same ambient vibration testing data, which was used for the inverse load identification. These modal parameters are required for the generation of the modal impulse matrices as well as decomposition of the measured displacement responses.
(a) 1st mode time history modal wind load (b) 1st mode power spectrum modal wind load
(c) 2nd mode time history modal wind load (d) 2nd mode power spectrum modal wind load
[image:8.595.107.301.120.263.2](e) 3rd mode time history modal wind load (f) 3rd mode power spectrum modal wind load
(a) 1st mode modal displacement (b) 2nd mode modal displacement
[image:9.595.321.517.119.263.2](c) 3rd mode modal displacement (d) 4rth mode modal displacement
Figure 4: Power spectrum of the decomposed modal displacement responses
can be reconstructed as long as there exist a correctly decomposed modal displacement response. Hence this method can be applied for modal wind load identification of other structures too, although the numerical simulation of a particular case certainly provides further insight.
5. Acknowledgment
(a) 1st mode time history modal wind load (b) 1st mode power spectrum modal wind load
(c) 2nd mode time history modal wind load (d) 2nd mode power spectrum modal wind load
[image:10.595.323.518.121.263.2](e) 3rd mode time history modal wind load (f) 3rd mode power spectrum modal wind load
(g) 4rth mode time history modal wind load (h) 4rthmode power spectrum modal wind load
References
[1] Hebruggen J V, Linden P J G V D, Knittel H J and J S 2002 Engine internal dynamic force identification and combination with engine structural and vibro acoustic transfer functionVehicle noise and vibration 2002 (IMechE conference transactions no 2002-3) (Professional engineering publishing)
[2] Lecl`erea Q, Pezerata C, Laulagneta B and Polacb L 2005Journal of Sound and Vibration286341–361 [3] Zhu X and Law S 2002Journal of Engineering Mechanics 128989–1000
[4] Lee S 2014Mathematical Problems in Engineering 2014
[5] Law S and Zhu X 2011 Moving loads-Dynamic analysis and identification techniques Structures and Infrastructures (Book 8) (CRC Press)
[6] Amiri A K and Bucher C 2014 Identification of fluctuating wind load distribution along the structure’s height inversely by means of structural responseAdvances in civil, environmental and material researches (ACEM 14)
[7] Chen T and Lee M 2008Wind and Structures1119–33
[8] Bucher C 2009Computational analysis of randomness in structural mechanicsStructures and Infrastructures (Book 3) (CRC Press)
[9] Law S S, Bu J Q and Zhu X Q 2005Engineering structures 27
[10] Hwang L, Kareem A and Kim H 2011Journal of wind engineering and industrial aerodynamics9918–26 [11] Lourens E, Reynders E, Roeck G D, Degrande D and Lombaert G 2012 Mechanical systems and signal
processing 27446–460
[12] Azam S E, Chatzi E and Papadimitriou C 2015Mechanical systems and signal processing 866–886 [13] Amiri A K and Bucher C 2015Journal of Sound and Vibration101–113
[14] Bl¨oschl G, Blaschke A P, Broer M, Bucher C, Carr G, Chen X, Eder A, Exner-Kittridge M, Farnleitner A, Flores-Orozco A, Haas P, Hogan P, Amiri A K, Oism¨uller M, Silasari J P R, Stadler P, Strauss P, Vreugdenhil M, Wagner W and Zessner M 2016Hydrology and Earth System Sciences 20227–255 [15] Peter B and Roeck G D 1999Mechanical systems and signal processing 13855–878
[16] Brandt A and Brincker R 2014Measurement 58511–519 [17] Ziegler F 1998Mechanics of solids and fluids2nd ed (Springer)
[18] Chopra A K 1995Dynamics of structures, theory and applications to earthquake engineering (Prentice-Hall) [19] Tikhonov A N and Arsenin V Y 1997Solution of ill-posed problems (New York: Weily)
[20] Hansen P C and O’Lary D P 1993SIAM J. Sci. Comput.14-161487–1503 [21] Hansen P C 2007Numerical algorithms 46189–194
[22] Wahba G, Golub G H and Heath M 1979Technometrics21215–223
[23] Reynders E and Roeck G D 2008Mechanical Systems and Signal Processing 22617–637
[24] Reynders E, Pintelon R and Roeck G D 2008Mechanical Systems and Signal Processing 22948–969 [25] Reynders E, Schevenels M and Roeck G D 2014 A MATLAB Toolbox for Experimental and Operational
Modal Analysis, MACEC 3.3 Structural Mechanics division, KU Leuven
[26] Mitchell L D 1990 Complex modes: a reviewbth international modal analysis conferencepp 891–899 [27] Caughey T K and O’Klley M M J 1965,Transaction ASME, Journal of applied mechanics32583–588 [28] Niedbal N 1984 Analytical determination of real normal modes from measured complex responses 25th
structures, structural dynamics and materials conference pp 292–295
[29] Friswell M I and Mottershead J E 1995 Finite element model updating in structural dynamics (Kluwer academic publishers)
[30] Groetsch C W 1984 The Theory of Tikhonov Regularization for Fredholm Equations of the First Kind (Pitman)