DC Voltage Droop Control Implementation in the AC/DC Power
Flow Algorithm: Combinational Approach
F. Akhter
1†, D.E. Macpherson
1, G.P. Harrison
1,
W.A. Bukhsh
2Keywords: Multi-Terminal High Voltage Direct Current (MTDC) grid, Voltage Source Converter (VSC), AC/DC combined power flow analysis, DC droop control.
Abstract
In this paper, a combinational AC/DC power flow approach is proposed for the solution of the combined AC/DC network. The unified power flow approach is extended to include DC voltage droop control. In the VSC based MTDC grids, DC droop control is regarded as more advantageous in terms of operational flexibility, as more than one VSC station controls the DC link voltage of the MTDC system. This model enables the study of the effects of DC droop control on the power flows of the combined AC/DC system for steady state studies after VSC station outages or transient conditions without needing to use its complete dynamic model. Further, the proposed approach can be extended to include multiple AC and DC grids for combined AC/DC power flow analysis. The algorithm is implemented by modifying the MATPOWER based MATACDC program and the results shows that the algorithm works efficiently.
1 Introduction
Offshore wind energy is seen as the most promising source of electricity generation for achieving the European renewable energy targets. A number of wind farms are planned and under installation to collect the huge potential of wind energy at farther distances in the North Sea. This has been extended to a wider concept of a DC ‘Supergrid’ for the interconnection of European countries with a MTDC grid [1], due to the technical advantages of VSC based MTDC systems.
The Voltage Source Converter (VSC) technology’s capabilities of multi-directional power flow and independent power control capability are fundamental to a MTDC grid system. With the systematic control of the VSCs and the MTDC grid system, the integration of wind farms and interconnections between countries can be made more reliable to support the AC network. The VSC-based MTDC grid system is connected to shore by a common DC link. The active power flows through all the terminals need to be balanced to keep the DC link voltage constant for the stable operation of the VSC stations, similar to the constant system frequency requirement of an AC system.
The integration of the proposed European DC ‘Supergrid’ to the existing AC transmission system has produced many challenges. A major challenge is to obtain the steady state operating point for the combined AC/DC power system. The power vs voltage relationships in DC are very different than in an AC grid; two different sets of numerical equations are required to be solved to obtain the combined AC/DC power flows. This is further complicated by the implementation of the different DC voltage control modes of the VSC stations in the MTDC system. The DC droop control is regarded as more advantageous in terms of the operational flexibility, as more than one VSC station controls the DC link voltage of the MTDC system. However, this produces issues such as power deviation due to DC droop control, discussed in detail in [2]. There has been a great deal of research to explore the steady state and the dynamic behaviour of MTDC systems in the literature [3,4,5]. The main focus of previous work has been only on the MTDC network, while considering the integrated AC network as an infinite bus or a network with several buses. However, it is necessary to have combined AC/DC power flow models to obtain the steady state operating point after a disturbance without need of building full a detailed dynamic model of the entire AC/DC system. There are two main approaches used for the combined AC/DC power flow solutions in the literature, which are classified as the unified and the sequential methods. A detailed and general model of the VSC MTDC system with full power flow equations including VSC converter loss, transformer and filters is presented in [6] for sequential power flow calculation. In the unified method, the power flow of the entire AC/DC system is solved simultaneously using a modified Jacobi technique [7], where all the AC and DC variables are available after each iteration. Whereas, in the sequential method, AC and DC networks are solved sequentially, one after another [8]. However, the work has mainly focused on AC grids with an embedded multi-terminal HVDC network. A multi-option power flow approach is proposed in [9], where a multi-terminal HVDC system with asynchronous AC grids is solved without considering the DC droop control mode of the VSC stations. A combined AC/DC system with more than one DC grid requires a greater number of variables to be included. The major contribution of this paper is the extension of the unified power flow approach to include the DC voltage droop control. A general combinational AC/DC power flow approach is proposed, which combines the unified and sequential approaches for the solution of a combined AC/DC
1Institute for Energy System, School of Engineering
University of Edinburgh, Kings Building, Edinburgh EH9 3JL, UK † [email protected]
network, along with the implementation of the DC voltage droop control. Further, this approach can be extended to study multiple AC and DC grids for the combined AC/DC power flow analysis. A modified IEEE14 bus network with five-terminal MTDC network and three asynchronous AC zones is used to test the combinational AC/DC power flow algorithm. The results obtained shows that the proposed combinational AC/DC algorithm can solve the combined AC/DC system robustly to produce a feasible power flow solution.
2 Steady state modelling for VSC based MTDC
system
In this study three main aspects are included for the steady state model representation of the VSC based MTDC system. First is the VSC converter station, which forms a link between the AC and DC system. The second one is the VSC converter station control modes that decide the operation state of the VSC station. The third is the loss in the VSC station that accounts for the power losses due to AC side filters and transformers.
2.1 VSC converter station representation
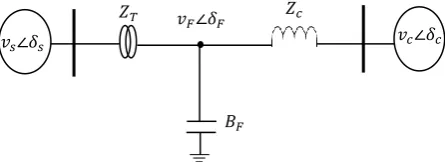
The converter station model considered for this study is similar to the general and detailed steady state model used in [6], as shown in Figure 2. It can be represented by a controllable voltage source behind a complex impedance. The phase voltages are assumed to be symmetric and harmonic free with balanced converter operation. As shown in Figure 1, the controllable voltage source VC represents the converter. It is connected to the phase reactor impedance ZC, which is connected to susceptance BF of the low pass filter, which further connects to the AC grid through the coupling transformer ZT. Thus power flow equations from the AC bus of the converter station can be given as:
[ ) ) )
[ ) ) )
While the power flow equations from the filter bus to the converter bus can be given as:
[ ) ) (3)
[ ) ) )
The expression for the power flow from the filter bus to the AC grid can be given as:
[ ) ) (5)
[ ) ) )
Similarly, the expression for the power flow from the AC grid bus to the filter bus can be given as:
[ ) ) )
[ ) ) )
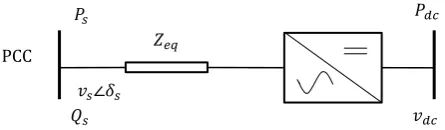
However, the calculation of the AC grid power injection from each converter station, through eq:(1-8) requires a separate internal iterative loop. To avoid the addition loop, an alternate method of the AC grid active power calculation PS,i is given as [7]:
)
where PC,i represents the active power from the VSC station
and PLOSS,I represents the total losses from DC side of
converter station to the PCC of the AC grid, explained in section (2.3).
2.2 VSC converter station control modes
The basic VSC station has two different control loops, the inner loop and the outer loop. The inner controller uses synchronously rotating dq reference control to control the converter currents independently, which decouples active and reactive power control to provide independent active and reactive power control at each VSC station, similar to the governor and the exciter of the synchronous generator, which provide active and reactive power control in the AC grid system. The outer controller can be operated under various modes of operation according to the requirements of the MTDC grid system. For the purpose of power flow calculation only steady state behaviour of the outer controller is considered.
The active power operation modes include: a) Constant active power (P-control) b) Constant DC link voltage (Udc-control)
The reactive power operation modes include: a) Constant reactive power (Q-control) b) Constant AC voltage (Vac-control)
𝑣𝐹∠𝛿𝐹
𝑣𝑠∠𝛿𝑠 𝑣𝑐∠𝛿𝑐
𝑍𝑐
𝑍𝑇
[image:2.595.318.541.85.166.2]𝐵𝐹
[image:2.595.74.219.195.270.2]Figure 2: Steady state VSC station model
The DC voltage droop control is implemented that most closely resembles the frequency droop control of the AC grid system, where more than one VSC station share responsibility for the DC link voltage control, therefore, outage of any single VSC station cannot cause failure of the complete MTDC grid system [5]. The DC voltage droop control is shown in Figure 3.
Figure 3: Droop control comparison of AC and DC grid
The implementation of the DC droop controller is given by: Pc= Pc ref + RD(Udc ref - Udc) (10)
where, Pc is actual power at the Point of Common Coupling (PCC) of the VSC station, Pc ref is the desired reference power, RD is the droop gain of the DC voltage controller, Udc is the actual DC link voltage at the VSC station and Udc refis the rated DC link voltage for the VSC station. However, to ensure the co-ordinated balanced operation of the MTDC system with N number of VSC stations, one station is considered as the DC slack station to regulate the DC link voltage near the reference value. Each VSC station is modelled as a PV-node or PQ-node bus at the PCC, according to its operation mode, as shown in Figure 4.
2.3 VSC converter station losses
The VSC converter losses are taken into account using a generalised VSC station loss model [10], in which losses are written as a function of the magnitude of the converter current Ic and given by:
| | | | )
As given in the equation, overall losses are divided into three categories, a represents no load losses, b and c indicate the
linear and quadratic relation to the VSC station current Ic respectively, where Ic can be given as:
√
√ ) )
Whereas, active power losses in the phase reactor and transformer can be calculated as:
| | | | )
Where, RT and RC are the resistances of the coupling transformer and phase reactor respectively. The total losses from DC side of the VSC station up to the PCC of the AC grid can be given as:
)
3 General AC/DC grids power flows
In this section, general power flow equations for the combined AC/DC grids are presented.
3.1 AC power flow equations
The AC power flow injection for all the buses in the AC grid excluding the slack bus can be given as:
∑
[ ) ) )
∑
[ ) ) )
where M is the total number of the AC buses, Vi, Vj, δi and δj are the bus voltage magnitude and angle of the ith and jth AC buses respectively. Yac = G+jB is the bus admittance matrix of the AC grid. The VSC station injections can be added as a negative load to extend the mismatch equations for the AC buses including the PCC, and are given as:
)
)
where, PGDi and QGDI are the net power generation at each bus, while Pinj,ACi and Qinj,ACi are the net power injection at each bus, which can be obtained from eq(15) and eq(16). Ps,i and Qs,i are the VSC station reference power at the PCC for VSC station connected buses only.
3.2 DC power flow equations
The DC power flow injection for all the buses in the DC grid excluding the slack bus can be given as:
∑
)
𝑣𝑠∠𝛿𝑠
𝑍𝑒𝑞
PCC
𝑣𝑑𝑐
𝑃𝑑𝑐
𝑃𝑠
𝑄𝑠
[image:3.595.49.272.519.584.2]where, N is the number of the total buses in the DC grid, VDCi is the ith DC bus voltage and YDC is the DC bus admittance matrix. The power mismatch equations for the DC power flow equation can be given as:
)
where, PDC,I is the reference power at the DC side of the converter, which can be calculated as:
)
3.3 Slack converter losses equations
The power at the PCC of the slack VSC station is calculated as:
∑
)
where, PLoss,slack are DC slack bus losses needed to calculate the DC slack bus power. In the unified approach [9], the slack station losses are considered as a separate variable Xs. The additional mismatch equation is given as:
)
where, PLoss,slack can be obtained from eq(14).
4 Combinational AC/DC power flow algorithm
The combinational AC/DC power flow approach is proposed to benefit from most of the advantages of both the techniques, unified and sequential, while avoiding their drawbacks. The unified combined power flow approach enables the AC and DC network equations to be solved simultaneously in the same iteration, resulting in merging all internal and external loops in a single iterative loop. However, solution of N independent DC networks requires adding N more variables in the single iterative loop, which makes it more complex. In the sequential combined power approach the AC and DC network equations need to be solved sequentially in separate iterations. The AC network power flow changes after the slack bus power is updated by the DC network iteration, thus external iteration is required to ensure the overall convergence of the combined system, which not only complicates the power flow but also takes more time to solve. Its main advantage is the easy integration of the DC network equations with the AC load flow equation without changing the existing AC load flow models.
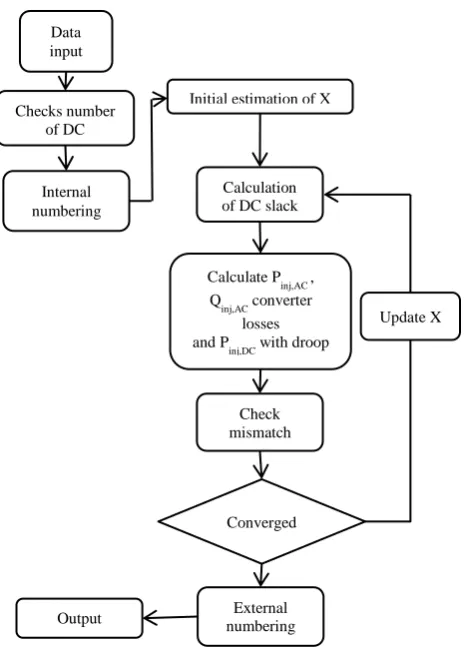
In the combinational power flow approach the AC and DC network equations are solved simultaneously in a single loop iteration but the iteration runs N times for N independent networks rather than increasing to N additional variables. It can also be integrated with the AC power flow model by regarding a large AC system as an external system similar to [9], without changing the existing AC load flow model. The flow chart of the proposed algorithm is shown in the Figure 5. Further droop control characteristics are implemented to
demonstrate the possibility of handling any control modes of the VSC station in the algorithm.
5 Test system
In this study, the combinational AC/DC power flow algorithm is implemented on a modified IEEE14 bus test network, which is shown as a single line diagram in Figure 6. A five-terminal MTDC system is integrated with a modified IEEE14 bus AC network. The converter station VSC1 (slack bus of the DC network) is connected to bus1 of the AC system. The converter station VSC2 and VSC3 are in P-control mode in order to capture maximum power from the offshore windfarms (modelled as asynchronous generator buses) bus2 and bus3 of the AC system. The remaining two converter stations VSC4 and VSC5 operate in the DC droop control mode and are connected to the bus6 and bus7 of the AC system respectively.
The VSC1 regulates the DC link voltage of the MTDC system at 250kV. Amongst the rest of the VSC stations the Pcon2 and Pcon3 are set to inject 50MW each into the MTDC system, while Pcon3 and Pcon4 are set to inject 60MW each under droop control in to the AC system. The DC voltage droop gain RD is set to be 20(MW/kV) for each of the two droop controlled VSC station. The detailed operation modes and converter station parameters are given in Table (1) and Table (2) respectively.
Initial estimation of X
Calculation of DC slack power
Calculate Pinj,AC , Q
inj,AC converter
losses and Pinj,DC with droop
Check mismatch
equation
Output
Converged
Update X Checks number
of DC networks
Data input
Internal numbering
[image:4.595.308.541.71.395.2]External numbering
Table 1: Operation mode of VSC station
Table 2: VSC station parameters
6 Results and discussions
The power flows obtained from the proposed algorithm applied to the modified IEEE14 bus system interconnected with a five-terminal MTDC system are shown by arrow in Figure 6. The results of power injections, voltages and phase angles before and after the outage of a VSC2 are given in the Table (3) and Table (4) respectively. The ( ⃰ ) represents the asynchronised zones in the AC system.
Table 3: Power injections, voltage and angle of the AC buses before outage AC BUS Voltage (pu) Angle (deg) Pinj (MW) Qinj (MVar)
1⃰ 1.06 0.0 1.54 52.13
2⃰ 1.045 -4.980 0.0 0.0
3⃰ 1.01 -12.72 0.0 0.0
4 1.031 -0.10 10.85 -41.9
5 0.999 2.251 50.98 -14.58
6 0.968 2.546 -21.20 -7.5
7 0.919 7.753 0.0 0.0
8 1.010 5.753 35 7.14
9 1.00 -0.111 -29.5 -16.6
10 0.998 -0.415 -9.0 -5.8
11 1.011 -0.386 -3.5 -1.80
12 1.015 -0.983 -6.1 -1.6
13 1.009 -1.00 -13.5 -5.8
14 0.985 -1.601 -14.9 5.0
DC BUS Voltage (pu) Pinj,DC (MW)
VSC1 1.000 21.73
VSC2 0.999 49.87
VSC3 0.998 48.75
VSC4 0.996 -59.91
VSC5 0.993 -59.85
Table 4: Power injections, voltage and angle of the AC buses after outage AC BUS Voltage (pu) Angle (deg) Pinj (MW) Qinj (MVar)
1⃰ 1.06 0.0 1.68 52.09
2⃰ 1.045 -4.980 0.0 0.0
3⃰ 1.01 -12.72 0.0 0.0
4 1.031 -0.10 10.77 -41.9
5 0.999 2.251 50.91 -14.58
6 0.968 2.546 -21.20 -7.5
7 0.919 7.753 0.0 0.0
8 1.010 5.753 35 7.15
9 1.00 -0.111 -29.5 -16.6
10 0.998 -0.415 -9.0 -5.8
11 1.011 -0.386 -3.5 -1.80
12 1.015 -0.983 -6.1 -1.6
13 1.009 -1.00 -13.5 -5.8
14 0.985 -1.601 -14.9 5.0
DC BUS Voltage (pu) Pinj,DC (MW)
VSC1 1.000 71.72
VSC2 0.994 0.0
VSC3 0.994 48.75
VSC4 0.991 -59.83
VSC5 0.985 -59.79
VSC stations PDC (MW) VDC (kV)
Type PCC AC bus VSC1 slack ±250 PV Bus1 VSC2 50 ±250 PV Bus2 VSC3 50 ±250 PV Bus3 VSC4 -60 ±250 PV Bus6 VSC5 -60 ±250 PV Bus7
Parameters Values XC (pu) 0.018 RC (pu) 0.001 XT (pu) 0.112 RT (pu) 0.001 BF (pu) 0.088 a (MW) 1.103 b (kV) 0.887 c (Ω) 2.88
1 2 3 6 9 5 8 7 4
11 10
14 13 12 VSC1 4 5 .4 7 VSC3 VSC4 VSC5
3.80 3.80
14.55 14.47 4 5 .6 8 5 7 .2 9 5 7 .2 9 VSC2 26.04 25.77
73.03 58.51 58.57
49.97 4 .3 4 2.4 4 8 .3 4 0 .1 5 1 .6 8 5 2 .09 5 0 .9 1 1 4 .5 6 .3 1 7 .7 7.78 3.08 1 7 .3 1 9 .4 0 35
2.9 37
.4 0.55
6.33 2.69 5.68 9 .9 4 1. 0 1 1.6 4.42 5.16 1.31
Figure 6: Modified IEEE14 network with five-terminal MTDC system represents active power in MW
As expected, after the outage of the converter station VSC2 the power output from the VSC4 and VSC5 reduces in accordance to the DC droop characteristics. The results obtained from the combinational AC/DC power flow shows that this proposed approach enables the study of the effects of DC droop control on the power flows of the combined AC/DC system for steady state studies after VSC station outages or transient conditions without needing to use its complete dynamic model.
7 Conclusion
In this paper, a combinational AC/DC power flow approach has been proposed for the solution of the combined AC/DC network. The extended model has been presented to include the DC voltage droop characteristics into the combined AC/DC power flows. This enables the study of the effects of the DC droop control on the power flows of the combined AC/DC system for steady state studies after VSC station outages or transient conditions without needing to use its complete dynamic model. In future work, the proposed approach will be applied to solve combine AC/DC systems with multiple independent AC and DC grids to validate the proposed approach for the AC/DC power flow analysis of a generalised form of combined AC/DC networks.
Acknowledgements
The author would like to acknowledge the affiliation and funding resources for this research from Sukkur Institute of Business Administration, Sukkur, Pakistan.
References
[1] E. Summary, “Eueopean Offshore Suppergrid Proposal,” 2010.
[2] F. Akhter, D. E. Macpherson, and G. P. Harrison, “Enhanced multi-terminal HVDC grid management for reliable AC network integration,” 7th IET Int. Conf. Power Electron. Mach. Drives (PEMD 2014), pp. 0495–0495, 2014.
[3] S. Cole, S. Member, J. Beerten, and R. Belmans, “Generalized Dynamic VSC MTDC Model for Power System Stability Studies,” vol. 25, no. 3, pp. 1655– 1662, 2010.
[4] R. T. Pinto, “Comparison of Direct Voltage Control Methods of Multi-Terminal DC ( MTDC ) Networks through Modular Dynamic Models,” pp. 1–10. [5] T. M. Haileselassie and K. Uhlen, “Precise control of
power flow in multiterminal VSC-HVDCs using DC
voltage droop control,” 2012 IEEE Power Energy Soc. Gen. Meet., pp. 1–9, Jul. 2012.
[6] J. Beerten, S. Member, S. Cole, and R. Belmans, “Generalized Steady-State VSC MTDC Model for Sequential AC / DC Power Flow Algorithms,” vol. 27, no. 2, pp. 821–829, 2012.
[7] M. Baradar, M. Ghandhari, and D. Van Hertem, “The modeling multi-terminal VSC-HVDC in power flow calculation using unified methodology,” 2011 2nd IEEE PES Int. Conf. Exhib. Innov. Smart Grid Technol., pp. 1–6, Dec. 2011.
[8] J. Beerten, S. Member, D. Van Hertem, S. Member, and R. Belmans, “VSC MTDC Systems with a Distributed DC Voltage Control – A Power Flow Approach,” pp. 1–6, 2011.
[9] M. Baradar and M. Ghandhari, “A Multi-Option Uni fi ed Power Flow Approach for Hybrid AC /DC Grids Incorporating Multi-terminal VSC-HVDC,” no. August, pp. 2376–2383, 2013.