Optical gain in NV- colour centres for highly-sensitive
magnetometry: a theoretical study
Vasili G. Savitski
Institute of Photonics, Dept. of Physics, University of Strathclyde, Glasgow, G1 1RD, UK
Abstract. Optical gain in an amplifier based on NV- colour centres (CC) in diamond is proposed as a new method for optical magnetic field detection. An analytical expression for magnetic field sensitivity with this method is deduced. The sensitivity is highest at the pump intensities about 100 times above the saturation intensity of NV- CC and can reach values of ~1.4 fT/√Hz in a pump-probe configuration with NV- CC concentration in diamond of 2.5 ppm. Collection efficiency of probe emission can be simpler and significantly higher than that of NV- CC luminescence, used for conventional optical magnetometry in diamond. This makes this method attractive for applications requiring remote magnetic field sensing.
1. Introduction
Highly-sensitive optically pumped magnetometers operating at room temperatures are of interest as alternative to cryogenic-temperature operated systems like superconducting quantum interference device sensors [1]. Among them magnetometers based on NV- colour centres (CC) in diamond have attracted considerable attention for magnetic field sensing in biology and with nanometer spatial resolution [2], with the best sensors having sub-pT magnetic field sensitivity [3]. These devices can be used in a number of applications including magneto cardiology and magnetoencephalography [4, 5]. One of the fundamental limitations to the sensitivity of NV- CC magnetometers is in the number of detectable photons [6]. This number is limited by the collection efficiency of the optics, the number of NV- defects in the diamond and the effect of total internal reflection [7]. Recently, some theoretical studies predicted the potential for using laser threshold in NV- for magnetometry to achieve fT/√Hz sensitivity [8, 9]. Laser action in NV- CC is, however, yet to be demonstrated. In this paper, the prospects for instead using optical gain in NV- CC for highly-sensitive magnetometry are analysed theoretically.
The simplified electronic level scheme of NV- CC in diamond, similar to the one presented in [8, 9], is shown in Fig. 1. The CC ground state is a spin-triplet with 3A
population is in the ms=0 ground state [12]. It means that any microwave (MW) field resonant with the ground state transition ms=0 ms=±1 can drive some population from the ground ms=0 to the ground ms=±1. Intensity of any spontaneous emission taken place between levels 2 (5) and 1 (4), measured as a function of the MW field frequency will have a local minimum at 2.88 GHz resonant frequency (the so-called optically detected magnetic resonance (ODMR)). Any magnetic field applied in this case will effectively “move” spin levels ms=0 and ms=±1 away from the resonant frequency, which will manifest itself in increase of intensity of spontaneous emission detected at MW frequency of 2.88 GHz.
2. Optical gain detected magnetic resonance
“Conventional” magnetometers based on NV- CC relate the change in the intensity of spontaneous emission (luminescence) to the magnetic field strength via the ODMR technique [10]. An alternative route for measuring the magnetic field strength, suggested in the present paper, is based on detecting the intensity of the external (probe) light, resonant with the optical frequency between levels 1 (4) and 2 (5), which can be amplified via the stimulated emission process between these levels. This optical gain detected magnetic resonance (OGDMR) technique can be realised using a pump-probe technique (see Fig. 2): the pump and the probe beams are combined at a dichroic mirror and then are both focused on the diamond sample. The probe beam is then spectrally filtered using a monochromator and any change in its intensity caused by the optical gain, can be detected using a photodetector (Fig. 2). The most efficient optical amplification of probe emission from e.g. a single-mode laser diode, when the diamond is pumped at e.g. 532 nm, can be observed in the spectral region ~670-800 nm [13] . This spectral range corresponds to induced transitions between the excited spin levels ms=0 (level 2) or ms=±1 (level 5) and corresponding ground vibrational states labelled as 3 and 6 in Fig. 1. The rate equations describing the populations N of the various levels shown in Fig. 1 are given below, where the following had been assumed: N2’=N5’=N3=N6=0, 23=56→∞ and 21=54=rad (where rad is the radiative lifetime of NV- CC and is the luminescence quantum yield), 57<<27 [14] and
2’2=5’5=31=64→0:
𝜕𝑁1
𝜕𝑡 = −𝑁1(1 4⁄ 𝑊41(𝛿) + 𝑊𝑃) + 𝑁2(𝜎𝜙𝑐 + 1
𝜏21) + 𝑁4(1 4⁄ 𝑊41(𝛿) + 1 𝜏41) +
𝑁7
𝜏71
Fig. 1. Simplified electronic level scheme of NV- CC in diamond describing optical gain detected magnetic resonance technique. Levels 1 and 2 are the ground and excited spin-projection states with ms=0. Levels 4 and 5 are the ground and excited spin-projection states with ms=±1. Levels 3 and 6 are the ground state vibrational states. Levels 2’ and 5’ are excited state vibrational states. Level 7 is a simplified representation of a singlet system 1A1+1E.
[image:2.595.306.519.75.165.2] [image:2.595.79.293.79.224.2]𝜕𝑁2
𝜕𝑡 = 𝑊𝑃𝑁1− 𝑁2(𝜎𝜙𝑐 + 1 𝜏21) 𝜕𝑁4
𝜕𝑡 = 1 4⁄ 𝑁1𝑊41(𝛿) − 𝑁4(1 4⁄ 𝑊41(𝛿) + 𝑊𝑝+ 1
𝜏41) + 𝑁5(𝜎𝜙𝑐 +
1 𝜏54) +
𝑁7
𝜏74 (1)
𝜕𝑁5
𝜕𝑡 = 𝑊𝑃𝑁4− 𝑁5(𝜎𝜙𝑐 + 1 𝜏54+
1 𝜏57) 𝜕𝑁7
𝜕𝑡 = 𝑁5
𝜏57− 𝑁7( 1 𝜏71+
1 𝜏74) 𝑁𝑡𝑜𝑡𝑎𝑙 = 𝑁1+ 𝑁2+ 𝑁4+ 𝑁5+ 𝑁7 ,
where xy represents relaxation time of the corresponding transition xy, Wp is the pumping rate, WP= Ppump
hνpumpVpumpNtotal (Ppump is the absorbed pump power, hpump is the pump photon energy, Vpump is the
pumping volume and Ntotal is the concentration of NV- CC). W41 is the stimulated transition probability
between the spin levels of the ground state, W41(δ) = ωR
2
ΔωA[
(ΔωA
2 ⁄ )2
𝛿2+(ΔωA
2
⁄ )2] (R is Rabi frequency, which
is proportional to square root of the applied MW power, ΔωA = 1 τ⁄ 41+ 2 T⁄ 2 [15], with 41 being the spin energy relaxation time (longitudinal relaxation time) and T2 is the spin dephasing time,
=±Be/2is the microwave detuning from the central frequency 0 (B is the projection of the measured magnetic field along the <111> axis of NV- CC, e=1.761×10¹¹ Hz/T is the electron gyromagnetic ratio)) in approximation that W41<<A [15]. In a diamond with an NV- CC concentration of 2.5 ppm (considered below in calculations), 41 is ~3 ms and T2 is ~0.2 s [16, 17], and therefore the approximation that W41<<A is satisfied at R<10 MHz. is the emission cross section of NV- CC.
is the photon density of the external (probe) light source, ϕ =hνPprobe
probecA (Pprobe is the probe power,
hprobe is the probe photon energy, c is the speed of light, A is the cross-sectional area of the probe beam on the sample). The factor ¼ is included into Eq. (1) to account for the fact that only a quarter of the total NV- population will be oriented along the direction of the magnetic field and be in resonance with the MW field, as set out in [18].
Taking into account that 74~71 [12, 14], and 54=21, the solution for N2 and N5 in the stationary case can be written as:
𝑁2=𝑊 𝑁2𝑚𝑎𝑥𝑊𝑃𝑁𝑡𝑜𝑡𝑎𝑙
𝑝𝑁𝑡𝑜𝑡𝑎𝑙+𝑁2𝑀𝑊𝑁2𝑚𝑎𝑥 (2),
where
𝑁2𝑚𝑎𝑥=𝑊𝑃𝑁𝑡𝑜𝑡𝑎𝑙
𝛷+𝑊𝑝 (3),
𝑁2𝑀𝑊= 𝑊41(𝛿)𝑊𝑃𝛷[ 𝛷+1 𝜏57⁄
𝑊𝑃 +𝜏71⁄2.25𝜏57+1]
(𝑊𝑃+𝑊41(𝛿)+1 𝜏⁄41)(𝛷+1 𝜏⁄57)−𝑊𝑃(𝛷+1 1.8𝜏⁄ 57) (4),
𝛷 = 𝜎𝜙𝑐 + 1 𝜏⁄ 21 (5).
𝑁5= 𝑁2𝑀𝑊𝑁𝑡𝑜𝑡𝑎𝑙
[𝛷+𝑊𝑝+𝑁2𝑀𝑊][𝛷+1 𝜏57𝑊𝑃⁄ +𝜏71⁄2.25𝜏57+1]
(6).
The relaxation times are: 57=18 ns (estimated from the lifetime of the excited spin-projection state with ms=±1 (level 5) of ~7.5 ns [12] and the luminescence lifetime 54=13 ns): 1/5=1/57+1/54. 71=400 ns (estimated from the lifetime of the singlet level 7 of ~178 ns and the relation 74=71 [14]): 1/7=1/71+1/74. The radiative lifetime of NV- CC is rad=13 ns [19] and the reported values of the luminescence quantum yield range between 100% [19] and ~60% [13].
ground ms=0 state (level 1) [12], with N2 reaching its maximum value (N2max) while N5=0 at W41=0 (see Eqs. (2)-(4) and (6)). This happens because of the high probability for population in the excited ms=±1 levels to decay to the ground level ms=0 via the singlet level 7 (57<<27 [14]). Population in the excited spin level ms=0 (N2) decays either spontaneously (luminescence, transition 2→1) or by the stimulated process (c) via the transition induced by the probe light, to one of the vibrational states of the CC (transition 2→3). The vibrational states then decay very rapidly back to the ground state ms=0. The probe emission will experience maximum gain due to the stimulated emission process.
When, in the presence of the pump, the MW field is applied to the system with a frequency of 0~2.88 GHz, the ground spin level ms=0 starts to be depopulated due to the MW field induced transitions to the ground level spin ms=±1 (level 4). From the ground ms=±1 level the population is transferred via the excited ms=±1 state to singlet long lived level 7. In that case the excited spin level with ms=0 (level 2) will experience some depopulation, while the population of the excited spin level with ms=±1 (level 5) will start to increase. The total population N2+N5 will, however, be lower than N2max. This will result
in less optical gain for the probe light at the resonant MW frequency (see Fig. 2, curve (N2+N5)). With both the optical pump and MW field present, any magnetic field under investigation will lift the degeneracy, and hence cause splitting, of the ground spin level ms=±1 (level 4). This can be thought of as shifting level 4 away from the MW resonance of ~2.88 GHz. In this case, microwave-driven depopulation of the ground state ms=0 level (level 1) will be less efficient, and as a result the excited state ms=0 level (level 2) will be populated more rapidly by optical pumping than in the case where only the MW field is applied. As a result, the probe emission will experience more gain. The value of the applied magnetic field is related to the change in the optical gain for the probe light.
3. The minimum detectable magnetic field under OGDMR
The power of the probe beam after the sample (Pout), assuming that the intensity of the probe is much
less than the saturation intensity of the NV- CC (~0.6 MW/cm2 at 710 nm [13]), can be written as [20]:
𝑃𝑜𝑢𝑡 = 𝑃𝑝𝑟𝑜𝑏𝑒𝑒𝑥𝑝(𝜎𝐿(𝑁2+ 𝑁5))
and then, similar to [18, 21]:
𝑃𝑜𝑢𝑡 = 𝑃𝑝𝑟𝑜𝑏𝑒𝑒𝑥𝑝 [𝜎𝐿 𝑁2𝑚𝑎𝑥{1 − 𝐶 𝛾2
𝛿2+𝛾2}] (7)
where L is the sample length; C is the OGDMR contrast in the change of the sum of the populations of levels N2 and N5, driven by the MW and magnetic fields, 𝐶 = 1 −
𝑁2(0)+𝑁5(0)
𝑁2𝑚𝑎𝑥 (with N2(0) and N5(0)
being the populations of levels 2 and 5 at the MW resonance 0 in the absence of any external magnetic field); is the HWHM linewidth of this change (see Fig. 2) and can be found by solving the equation 𝑑2𝑁2𝑀𝑊
𝑑𝛿2 = 0:
𝛾 =3
8√
(𝛷+1 𝜏⁄ 57)ωR2ΔωA
(𝛷+1 𝜏⁄57)(𝑊𝑃+1 𝜏⁄ 41)−𝑊𝑃(𝛷+1 1.8𝜏⁄ 57)+ ΔωA
2 (8).
The minimum detectable magnetic field is given by [16]:
𝐵𝑚𝑖𝑛 =2𝜋𝛾
𝑒
d𝑃𝑜𝑢𝑡 𝑑𝑃𝑜𝑢𝑡
𝑑δ (𝑚𝑎𝑥)
(9),
where dPout is the minimum detectable change in the probe power. During measurement time tm the
number of detected photons is Pprobetm/hprobe, and the corresponding photon shot-noise can be expressed
as √𝑃ℎ𝜈𝑝𝑟𝑜𝑏𝑒𝑡𝑚
𝑝𝑟𝑜𝑏𝑒 [16].
The first derivative of Eq. (7) with respect to is: 𝑑𝑃𝑜𝑢𝑡
𝑑δ =
2𝑃𝑝𝑟𝑜𝑏𝑒𝜎𝐿 𝑁2𝑚𝑎𝑥𝐶𝛾2δ
(δ2+𝛾2)2 𝑒𝑥𝑝 [𝜎𝐿 𝑁2𝑚𝑎𝑥{1 − 𝐶
𝛾2
δ2+𝛾2] (10).
This derivative has maximum value at ≈0.77: 𝑑𝑃𝑜𝑢𝑡
𝑑δ (𝑚𝑎𝑥) ≈
𝑃𝑝𝑟𝑜𝑏𝑒𝜎𝐿 𝑁2𝑚𝑎𝑥𝐶
1.65𝛾 𝑒𝑥𝑝 [𝜎𝐿 𝑁2𝑚𝑎𝑥{1 − 𝐶
By replacing Pprobe on the right-hand side of the Eq. (10) with the number of detected photons during
measurement time tm, the photon shot-noise limited magnetic field sensitivity that can be measured
using optical gain of the probe emission can be expressed as:
𝐵𝑚𝑖𝑛𝑆𝑁 √𝑡
𝑚 ≈3.3𝜋𝛾𝑒 𝛾√ℎ𝜈𝑝𝑟𝑜𝑏𝑒
√𝑃𝑝𝑟𝑜𝑏𝑒𝜎𝐿𝑁2𝑚𝑎𝑥𝐶 𝑒𝑥𝑝[𝜎𝐿 𝑁2𝑚𝑎𝑥{1−1.6𝐶}] (12).
4. Discussion
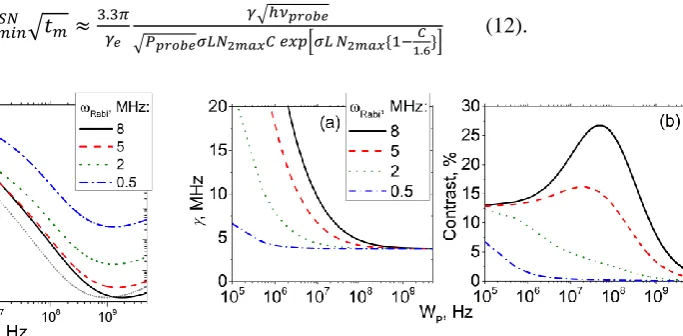
The major difference between the luminescence and optical gain methods for magnetic field detection is that the magnetic field sensitivity in case of optical gain detected magnetic resonance (OGDMR) is the function of probe power (eq. (12)) and does not depend on the collection efficiency of luminescence from NV- CC (as in the case of luminescence ODMR [2]). With the probe emission from a single-mode laser diodes, almost all the light transmitted through the diamond sample can be collected on the photodetectot (Fig. 2). This is because this method is less sensitive to the light-trapping effect [7], as typical divergence of the probe light from a single-mode laser diode, mentioned below, inside the diamond (~2°) is lower than the critical angle of the total internal reflection (~24° [22]). Besides, the light-trapping effect can be eliminated even further by using anti-reflection coating on diamond surfaces [23]. This in principle allows one to increase the shot-noise magnetic field sensitivity by simply increasing the probe power (as long as the probe intensity stays well below the saturation intensity of NV- CC) with all the rest of the pump parameters being the same. The sensitivity is, however, still a function of the contrast C and linewidth of OGDMR (Fig. 3). It is plotted in Fig. 3 for different Rabi frequencies as a function of the pumping rate. The calculations are for a 5 mm long diamond sample with an NV- CC concentration of 2.5 ppm, illuminated with 40 mW of probe power at the wavelength of 710 nm (typical output power for a single-mode laser diode at this wavelength), where the NV- emission cross-section is 3.6×10⁻¹⁷ cm2 [13]. The calculations are done assuming 60% luminescence quantum yield (
Magnetic field sensitivity is highest at a certain optimum pumping rate for each Rabi frequency (Fig. 3). This is a result of a complex dependence of the maximum excited-state level population N2max, the
contrast C and the linewidth of the resonance on the pumping rate Wp. These optimum pumping rates
(~2 GHz) are about 2 orders of magnitude higher than the saturation pumping rate of the optical transition 1 (4) → 2 (5) for given pumping conditions and CC concentration. At this pumping rate the maximum excited-state level population starts to be saturated and is close to the total population of NV- CC (N2max→Ntotal, see Eq. (3)). As a result, magnetic resonance HWHM linewidth is narrowed down to
A/8 (see Fig. 4(a) and Eq. (8)), but the contrast is still high enough (~5% for Rabi frequency of 8 MHz) for efficient magnetic field detection (Fig. 3 (b)). With further increasing of the pumping rate
Fig. 3. Shot-noise magnetic field sensitivity using OGDMR technique, as a function of pumping rate for different Rabi frequencies.
[image:5.595.170.512.113.281.2](Wp→∞), N2max→Ntotal, C→0 and →A/8 and the minimum magnetic field sensitivity starts decreasing again (Fig. 3). Optical gain magnetic resonance linewidth narrowing, observed as the pumping rate is increased (Fig. 4 (a)) for different Rabi frequencies, is similar to the effect reported in [18] for luminescence magnetic resonance. It was attributed to the fact that the “effective” spin energy relaxation rate (“effective” longitudinal relaxation rate) is a sum of the longitudinal relaxation rate 1/41 and the pumping rate Wp (see Eq. (4)) [18]. The contrast C of the resonance decreases monotonically with the pumping rate up to the Rabi frequency of ~5 MHz, when a local maximum in the contrast appears at a pumping rate close to the saturation pumping rate of the optical transition 2(5)→3(6) (Fig. 3 (b)).
The minimum detectable magnetic field for the conditions described above at the optimum pumping rate of ~1 GHz is ~1.4 fT/√Hz at a Rabi frequency of 8 MHz. This is better than the theoretical shot-noise limited magnetic field sensitivity of 1.86 fT/√Hz [9] in a diamond with 16 ppm of NV-, using a laser threshold magnetometry. The approach suggested here does not require the fabrication of a laser resonator, which makes the system simpler.
Luminescence quantum yield () affects the optimum pumping rate required to achieve the highest magnetic field sensitivity. The higher is the quantum yield, the lower is the optimum pumping rate, which is illustrated in Fig. 3 with a dotted grey line, which represents the OGDMR magnetic field sensitivity as a function of pumping rate for Rabi frequency of 8 MHz and luminescence quantum yield of 100%. The optimum pumping rate in this case is ~1 GHz, which is 2 times lower than that with the luminescence quantum yield of 60%.
The OGDMR sensitivity can be further increased at low temperatures. Order of magnitude slower spin dephasing time T2 was reported in isotopically pure diamond [24] when the temperature was decreased from 300 down to 160 K. Assuming similar increase in T2 at 160 K in a diamond sample considered in this paper, one can expect 10 times narrower linewidth and order of magnitude better magnetic field sensitivity in comparison with the room temperature case considered above.
By manufacturing a waveguide in the diamond containing NV- CC detection of the amplified probe can be simplified significantly. This is due to a fact that in waveguides both pump and probe light propagate collinearly and aligned perfectly with each over, without any need for mechanical alignment of the pump-probe setup (Fig. 2). Moreover, the interaction length can be increased further, while still maintaining the small pumping area in the crystal. A diamond rib waveguide with height and width of ~5 m has been suggested to be sufficient for strong mode confinement and low scattering loss [25]. Waveguiding would make the device compatible with fiber technology for pumping the diamond and collecting the amplified emission.
5. Conclusion
In conclusion, an optical gain detected magnetic resonance method for magnetic field measurements using NV- CC in diamonds is described theoretically. This method is based on detecting changes in optical gain of a probe beam passing through the optically pumped diamond caused by applied microwave and magnetic fields. This method does not require collection of NV- CC luminescence over a large solid angle, and the magnetic field sensitivity is instead proportional to the square root of the probe beam power. Shot-noise limited magnetic field sensitivity of ~1.4 fT/√Hz is predicted to be possible with this method in a simple pump-probe geometry.
Funding. European Research Council (grant 278389)
Acknowledgment. The author is grateful to Alan Kemp and Łukasz Dziechciarczyk for their comments
on the manuscript.
[1] Budker D, Romalis M 2007 Optical magnetometry Nat Phys 3 227-34
[3] Wolf T, Neumann P, Nakamura K, Sumiya H, Ohshima T, Isoya J, et al. 2015 Subpicotesla Diamond Magnetometry Physical Review X 5 041001
[4] Barry J F, Turner M J, Schloss J M, Glenn D R, Song Y, Lukin M D, et al. 2016 Optical magnetic detection of single-neuron action potentials using quantum defects in diamond Proceedings of the National Academy of Sciences of the United States of America 113 14133-8
[5] Dale M W, Morley G W Medical applications of diamond magnetometry: commercial viability arXiv:170501994
[6] Acosta V M, Bauch E, Jarmola A, Zipp L J, Ledbetter M P, Budker D 2010 Broadband magnetometry by infrared-absorption detection of nitrogen-vacancy ensembles in diamond Applied Physics Letters 97 174104
[7] Le Sage D, Pham L M, Bar-Gill N, Belthangady C, Lukin M D, Yacoby A, et al. 2012 Efficient photon detection from color centers in a diamond optical waveguide Phys Rev B 85 121202 [8] Faraon A, Santori C M, Beausoleil R G, inventorsColor centers affected by magnetic fields to produce light based on lasing. USA patent US20140072008 A1. 2014.
[9] Jeske J, Cole J H, Greentree A D 2016 Laser threshold magnetometry New Journal of Physics
18 013015
[10] Doherty M W, Manson N B, Delaney P, Hollenberg L C L 2011 The negatively charged nitrogen-vacancy centre in diamond: the electronic solution New Journal of Physics 13 025019 [11] Loubser J H N 1977 Optical spin-polarisation in a triplet state in irradiated and annealed type 1b diamonds Diamond Research 9 11-4
[12] Doherty M W, Manson N B, Delaney P, Jelezko F, Wrachtrup J, Hollenberg L C L 2013 The nitrogen-vacancy colour centre in diamond Physics Reports 528 1-45
[13] Fraczek E, Savitski V G, Dale M, Breeze B G, Diggle P, Markham M, et al. 2017 Laser spectroscopy of NV- and NV0 colour centres in synthetic diamond Optical Materials Express 7 2571-85
[14] Robledo L, Bernien H, van der Sar T, Hanson R 2011 Spin dynamics in the optical cycle of single nitrogen-vacancy centres in diamond New Journal of Physics 13 025013
[15] Siegman A E 1986 Lasers University Science Books
[16] Rondin L, Tetienne J P, Hingant T, Roch J F, Maletinsky P, Jacques V 2014 Magnetometry with nitrogen-vacancy defects in diamond Reports on Progress in Physics 77 056503
[17] Acosta V M, Bauch E, Ledbetter M P, Santori C, Fu K M C, Barclay P E, et al. 2009
Diamonds with a high density of nitrogen-vacancy centers for magnetometry applications Phys Rev B
80 115202
[18] Jensen K, Acosta V M, Jarmola A, Budker D 2013 Light narrowing of magnetic resonances in ensembles of nitrogen-vacancy centers in diamond Phys Rev B 87 014115
[19] Collins A T, Thomaz M F, Jorge M I B 1983 Luminescence decay time of the 1.945 eV centre in type Ib diamond Journal of Physics C: Solid State Physics 16 2177
[20] Svelto O 1998 Principles of Lasers Springer
[21] Dréau A, Lesik M, Rondin L, Spinicelli P, Arcizet O, Roch J F, et al. 2011 Avoiding power broadening in optically detected magnetic resonance of single NV defects for enhanced dc magnetic field sensitivity Phys Rev B 84 195204
[22] Clevenson H, Trusheim M E, Teale C, Schroder T, Braje D, Englund D 2015 Broadband magnetometry and temperature sensing with a light-trapping diamond waveguide Nat Phys 11 393-7 [23] Yeung T K, Sage D L, Pham L M, Stanwix P L, Walsworth R L 2012 Anti-reflection coating for nitrogen-vacancy optical measurements in diamond Applied Physics Letters 100 251111
[24] Bar-Gill N, Pham L M, Jarmola A, Budker D, Walsworth R L 2013 Solid-state electronic spin coherence time approaching one second Nature Communications 4 1743