City, University of London Institutional Repository
Citation
:
Escrig, A. B. and de Menezes, L. M. (2016). What is the effect of size on the use of the EFQM excellence model?. International Journal of Operations and ProductionManagement, 36(12), pp. 1800-1820. doi: 10.1108/IJOPM-11-2014-0557
This is the accepted version of the paper.
This version of the publication may differ from the final published
version.
Permanent repository link:
http://openaccess.city.ac.uk/17011/Link to published version
:
http://dx.doi.org/10.1108/IJOPM-11-2014-0557Copyright and reuse:
City Research Online aims to make research
outputs of City, University of London available to a wider audience.
Copyright and Moral Rights remain with the author(s) and/or copyright
holders. URLs from City Research Online may be freely distributed and
linked to.
1
WHAT IS THE EFFECT OF SIZE ON THE USE OF THE EFQM EXCELLENCE MODEL?
Ana B. Escrig, Business Administration and Marketing, Universitat Jaume I, Spain
e-mail: [email protected]
Lilian M. de Menezes, Cass Business School, City University London, UK
e-mail: [email protected]
Abstract
Purpose: By contrasting a contingent with a universal approach to business excellence models, this paper investigates the effect of size on the use of the EFQM Model by organizations that were officially “Recognized for Excellence” in Spain. It considers the potential differences between large organizations and SMEs on the level of adoption of EFQM criteria and on the impact that Enablers-criteria may have on key performance measures.
Methodology: This study uses actual sub-criteria and criteria scores attained by organizations in their assessment for EFQM recognition. Scores of a population of 216 organizations are analyzed via ANOVA, factor and structural equations models.
Findings: Although there are some criteria in the EFQM model that appear to be universally adopted irrespective of size, the empirical analyses indicate that size may shape the adoption of other criteria and the impact that Enablers can have on Results, thus supporting a contingent perspective. Moreover, the findings call for the revision of the relationships embedded in the EFQM model.
Originality: In contrast to most previous research, which relied on surveys of managers’ perceptions, this study uses the actual scores achieved by organizations in their assessment for EFQM recognition. It addresses the effect of size on the whole model, which so far has been neglected in the literature. All in all this study contributes to the literature on contingent approaches to best practices, and more specifically to business excellence models. To the practitioner, it provides guidelines for addressing perceived performance gaps in their pursuit of recognition for excellence.
1. Introduction
Organizational excellence can be described as a set of principles and approaches that
produce the best overall results and support a sustainable future for organizations
(Rusjan, 2005; Kim et al., 2010; EFQM, 2012; Sampaio et al., 2012; Boulter et al.,
2013). In order to understand what organizational excellence actually is, closer attention
has been paid to Business Excellence Models (BEM). Most existing BEMs have been
developed or supported by national bodies as a basis for award programs that
disseminate Quality Management (QM) (Dahlgaard et al., 2013). In 2011, there were
approximately 100 national BEMs in use (Talwar, 2011), the majority of which were
inspired by either the Malcolm Baldrige National Quality Award (MBNQA) or the
European Foundation for Quality Management (EFQM)/European Excellence Award
criteria. The models underlying these awards encompass the adoption of a collection of
best QM practices and the measurement of stakeholder-related performance.
Accordingly, BEMs are instruments to assess what an organization does and to identify
its achievements, thus the models assume a causal relationship between QM and
performance (Kanji, 2002; Bou et al., 2009; Jayamaha et al., 2009, 2011).
A stream of academic research has been examining the implementation and outcomes of
BEMs. Several studies (e.g., Hendricks and Singhal, 2001; Corredor and Goñi, 2011;
Boulter et al., 2013) have assessed the link between QM practices and performance by
focusing on award winners. Considering BEMs as frameworks for QM, the literature
has mainly centered on validating the implicit relationships between the operations and
results. For example, Bou et al. (2009) and Heras et al. (2012) focused on the EFQM,
while He et al. (2011) and Karimi et al. (2014) on the MBNQA, and found positive
associations between QM and organizational performance. Their empirical evidence,
therefore, suggests that excellence in the management of Enablers-criteria (those that
define operations) is associated with excellence in Results.
Since most research has concentrated on the internal structure of the BEMs (the
relationship between operations and results), little is known concerning the adoption of
the practices embedded in BEMs within distinct organizational contexts. Core to what
has been labelled the best practice literature, including studies of BEMs, is the claim of
a universal use of management practices (Leseure et al., 2004). Yet, BEMs are not
3
criteria even though they may perform poorly on others (Williams et al. 2006; Gómez et
al., 2011; Sampaio et al., 2012). Consequently, the use of practices embedded in the
EFQM model and the postulated interrelationships between practices and results may
vary with context. Indeed, some authors (e.g., Voss, 2005; Sousa and Voss, 2008)
suggest that, since best practices have matured, it is important to investigate the
conditions under which these practices work and which of them may be context
specific.
A contingency perspective recognizes that successful QM implementations are likely to
depend on factors such as size, degree of implementation, type of industry, duration,
and environmental characteristics (Hendricks and Singhal, 2001; Zhao et al., 2004; Sila,
2007; Jayaram et al., 2010; Zhang et al., 2012). For example, Hendricks and Singhal
(2001) stated that institutional networks impact management practices, and highlighted
that inertia tends to be positively associated with firm age and size. In addition,
idiosyncratic inter-firm linkages have been considered as determinants of management
practices and sources of differential firm performance in other theoretical perspectives,
as for example, the “relational view of the firm” (Dyer and Singh, 1998).
In the particular case of the EFQM model, Dahlgaard-Park (2008) and Mohammad et al.
(2011) argued for the need to address contingency factors. To the best of our
knowledge, the analysis of the joint use of practices embedded in this BEM and how
different configurations may emerge according to organizational characteristics has
been mainly undertaken regarding sectors, by comparing: private versus public
organizations (Eskildsen et al., 2004; Tarí, 2008), high education and other public
sectors (Hides et al., 2004), or manufacturing versus services (Gómez et al., 2011). It is
noticeable that recently Calvo-Mora et al. (2015) considered the effect of size, but they
did not investigate how size might have affected the adoption of the EFQM criteria nor
their interrelationships. Hence, how the EFQM model varies with the size of
organizations is an open research question. In this context, this article reports an
analysis of organizations that have been awarded the “Recognized for Excellence”
status in Spain and discriminates two categories: (1) large, (2) small and medium
organizations (SMEs). In doing so, it contributes to the scientific assessment of the
EFQM Excellence Model that, as highlighted by Williams et al. (2006) and Heras et al.
(2012), is important for the legitimization of BEMs. Specifically, it examines
implicit in the model, which although addressed in previous QM studies (e.g., Roca et
al., 2006; Sila, 2007) have not been studied in the perspective of the EFQM model. The
findings unveil a structure in the use of the EFQM, which accounts for the effect of size
and provides insights into the successful adoption of the practices embedded in the
model.
The next sections describe the EFQM model and its accreditation scheme, review
previous literature concerning the potential effect of size, set the hypotheses to be
tested, and describe the methodology used. The empirical study, its findings and
implications for different stakeholders are subsequently reported.
2. Levels of Excellence and the link Enablers-Results
The EFQM Excellence Model is the most used BEM in Europe and is a comprehensive
management model (Williams et al. 2006, Gómez et al., 2011), which is known to
reliably reflect the principles of QM (Sousa and Voss, 2002; Bou et al., 2009; Corredor
and Goñi, 2011). It was launched in 1991 as a non-prescriptive framework, whose
“beauty is that it can be applied to any organization regardless of size, sector or
maturity” (http://www.efqm.org/efqm-model/model-criteria). The model is supported
by nine criteria, as depicted in Figure 1, where the current version is summarized. Each
criterion encompasses sub-criteria that entail best practices, based on which
organizations are assessed in their pursuit of excellence. In total, there are 32
sub-criteria.
‐‐‐‐‐‐‐‐‐‐‐‐‐‐‐‐‐‐‐‐‐‐‐‐‐
Figure 1
‐‐‐‐‐‐‐‐‐‐‐‐‐‐‐‐‐‐‐‐‐‐‐‐‐
The Enablers-criteria cover what an organization does, while the Results-criteria cover
what an organization achieves. Levels of excellence are established depending on how
organizations score in the two sets of criteria. A scheme of recognition was launched by
the EFQM, and organizations are encouraged to apply to be assessed. In July 2015,
there were 355 valid “Recognized for Excellence” awarded in Spain, which is a country
where the EFQM model is widely used (www.efqm.org).
Recognition is awarded by Club Excelencia en Gestión (CEG), which is EFQM’s
partner in Spain. As Grigg and Mann (2008) or Jayamaha et al. (2009) described, when
5
assessed against the model in Figure 1. Points are allocated to each sub-criterion by a
panel of assessors using scoring guidelines and evidence of actual performance. All 32
sub-criteria are evaluated to determine an organization’s score, and accreditation is at
three levels —3-star, 4-star and 5-star—, depending on the achieved scores (the
minimum thresholds are respectively 300, 400 and 500, and 1000 is the maximum
possible score). The accreditation is valid for two years, after which organizations need
to apply for reaccreditation.
Considering that BEMs involve multiple paths between criteria (Jayamaha et al., 2011),
some studies (e.g., Safari et al., 2012) have focused on the links between isolated
Enablers-criteria and some organizational results. Other studies examined whether all
Enablers explain excellence in the Results domain. Although the EFQM model does not
state clear interrelationships among all individual criteria, causal relationships are
implicit, as indicated by the arrows in Figure 1, which were deduced from previous
research (e.g., Eskildsen et al., 2004; Bou et al., 2009; Gómez et al., 2011; Heras et al.,
2012; Calvo-Mora et al., 2014). For a detailed explanation of each association implicit
in Figure 1, one may refer to Heras et al. (2012).
This structural model entails that organizations need an effective Leadership in order to
set an appropriate climate to achieve excellence. Given this precondition,
stakeholders-related performance results from designing products or services considering customer’s
expectation and having in place effective processes, which are influenced by a strategy
coupled with employee-motivational practices, partnerships, and core resources such as
data and knowledge-based decision making (Eskildsen et al., 2004; Gómez et al., 2011;
Heras et al., 2012). In short, the results achieved by an organization depend on a chain
of inductors that have to be made explicit and managed.
3. Size as a contingency factor in the adoption of the EFQM Model
3.1. Contingency analysis of the EFQM criteria
QM practices should not be addressed from a “one-size fits all” perspective (Zhang et
al., 2012), because their adoption may depend on characteristics of the organization.
Several studies have, therefore, analyzed how the relationships between QM, or its
dimensions, with organizational performance may be contingent (e.g., Ahire and
Jayaram et al, 2010; Zhang et al. 2012). As argued in the seminal writings of Dean and
Bowen (1994) and Watson and Korukonda (1995), many companies failed to
implement QM because of using very standardized approaches. The link
QM-performance may be contingent on several factors (e.g., sector, firm size and structure,
market environment, product orientation, management’s perception of quality, program
duration, and unionization). Dahlgaard et al. (2013) also hinted at customizations of
BEMs.
In the case of the EFQM, some authors (e.g., Gómez et al., 2011; Sampaio et al., 2012)
claimed that there may be multiple approaches and ways of adoption. As observed by
Williams et al. (2006), an organization can achieve a high level of excellence in some,
but not all criteria. Indeed, the choice of practices to use should be aligned to the
organization’s strategy as well as its needs. Furthermore, with limited resources to be
optimized, specific dimensions of QM have to be prioritized. This may be the case in
smaller organizations, which often need to be more agile and flexible in order to
survive, and generally make use of informal processes and direct communication
between line managers and employees. By contrast, large organizations are more likely
to emphasize efficiency, greater formalization or higher use of control systems. There is
also empirical evidence and theoretical support based on the resource based theory for
differences in how size may impact the application of the model in Figure 1. For
example, Sturkenboom et al. (2001) and Kumar and Antony (2008) highlighted the need
for a customized QM for SMEs, and the EFQM has had separate criteria for SMEs in
previous versions.
In an early study of attitudes to self-assessment and quality awards in the UK, Wilkes
and Dale (1998) concluded that small and medium enterprises were, in general, aware
of the EFQM model, but did not fully understand its benefits. They argued that the
pressure of competition and the need to rebuild confidence in the future of the business
often meant that SMEs targeted immediate results and were put off by the EFQM
model. SMEs needed to be introduced to simplified guidelines to QM before they could
use the model and the perception that accreditations were mainly for large organizations
had to be changed. Over the years, perceptions might have improved, but still, when the
model in Figure 1 is considered, differences in emphases on EFQM criteria between
7
Considering QM, Ghobadian and Gallear (1996, 1997) concluded that some features are
more compatible with small businesses, while others are independent of size. Similarly,
Sun and Cheng (2002) and Lewis et al. (2006) claimed that, in SMEs a greater use of
social and soft practices facilitate cultural change and awareness about individual
responsibility for quality. Zhao et al.’s (2004) findings supported the view that SMEs on
average perform well on people management, possibly due to closer relationships and
direct negotiations between management and employees. In fact, Calvo-Mora et al.
(2014, 2015) concluded that Leadership and People management were important drivers
in the adoption of the EFQM model. Yet, literature on human resource management
tends to suggest that management practices differ between SMEs and large
organizations. Research by Storey et al. (2010) found that the formalization of human
resource management in large organizations impinge on employees’ perceptions of job
autonomy and discretion, which are critical for problem solving and continuous
improvement that are part of QM. Moreover, Angell and Corbett (2009) warned that, in
small organizations, the lack of resources required for having sufficient evidence of
performance against industry benchmarks is a barrier to the achievement of high scores
in assessments such as EFQM’s. Indeed, Kumar and Antony (2008) concluded that the
model is unsuitable, bureaucratic and very time-consuming for SMEs.
Large organizations have been found to emphasize processes management (Lee and
Oakes, 1995; Roca et al., 2006) and the structural component of QM, namely formal
training and supplier cooperation (Sun and Cheng, 2002). Temtime (2003) and Haar and
Spell (2008) concurred that an increase in size means greater resources and benefits
from economies of scale, which would facilitate QM implementation. In particular for
the achievement of QM awards, Evans et al. (2012) stressed the importance of
measurement systems, which together with the use of forecasts are more frequent in
larger and formal organizations. Hence, we hypothesize:
H1: The level of implementation or use of the EFQM criteria differs according to the
size of the organization.
Several empirical studies (e.g., Ahire and Golhar, 1996; Taylor and Wright, 2003; Sila,
2007), however, have rejected size as a contingency factor for QM. Overall, they
concluded that SMEs can utilize their relative strengths, especially in terms of
flexibility, to implement QM elements as effectively as large organizations. In SMEs,
conclusion, the literature provides mixed evidence concerning the effect of size on QM.
Whether or not there are differences in EFQM implementation between SMEs and large
organizations is an open research question.
3.2. Contingency analysis of the relationships among EFQM criteria
Roca et al. (2006) offered two explanations for why the size of an organization can be a
contingency factor in the associations within the EFQM model: (1) the degree of
implementation or adoption of practices may vary with the size of the organization, as
hypothesized above; but also that (2) the intensity of the relationship between QM
practices and performance may be affected by size. When the second argument has been
examined, the literature also remains inconclusive. For example, Terziovski and
Samson’s (1999) analysis was supportive, since size moderated the association between
QM and performance, in particular, defect rates and warranty costs. When focusing on
specific QM dimensions, Gustafsson et al. (2003) found that some practices related to
process orientation directly impact customer satisfaction in large organizations, but this
effect was not evident in smaller organizations.
Hendricks and Singhal (2001), however, concluded that smaller firms can benefit more
from QM. They argued that being smaller may facilitate the understanding of key
customers’ needs, and organizational learning can be more effective as key practices
such as teamwork or empowerment are already present to some extent in smaller firms,
thereby lowering their costs of implementing QM. Perhaps not surprising, given mixed
findings on moderation, Jayaram et al. (2010) observed that there are relationships
which are stronger in large firms and other relationships that are stronger in small firms:
“In some instances nimbleness pays off and in other instances scale advantages pay off”
(Jayaram et al., 2010, 353).
Moreover, considering the EFQM model, some studies (e.g., Eskildsen et al., 2004;
Gómez et al., 2011; Calvo-Mora et al., 2014, 2015) proposed modifications in the
theoretical relationships within the model. In spite of variations in the proposals, several
alternatives highlight how Leadership and cultural factors are instrumental in improving
results. This emphasis reflects a premise in QM, which is that organizations address
cultural issues first and then design systems (Abdullah, 2010; Jayaram et al., 2010) by
putting in place both social and technical practices (Zu, 2009). Indeed, Gómez et al.
9
Enablers-criteria. Other scholars (e.g., Bou et al., 2009, Calvo-Mora et al., 2015)
addressed the interrelationships between the Results-criteria in the EFQM model, and
proposed a latent factor encompassing the equilibrium in the satisfaction of the
stakeholders’ needs. Given the different perspectives and findings described above,
when analyzing the effect of size, variations in the relationships proposed in the EFQM
model may also be expected. Consequently, we test the following hypothesis:
H2: The size of an organization moderates the associations between criteria in the
EFQM model.
4. Methodology
4.1. Data
A population of 216 Spanish organizations that in March 2013 were “Recognized for
Excellence” by Club Excelencia en Gestión (CEG) is considered. Scores obtained in
their external independent assessments using the protocol of the EFQM model on all
criteria and sub-criteria as well as the final score for each organization are included in
the database. Although individual organizations cannot be identified because of a
confidentiality agreement with CEG, different sectors of the economy are covered. The
majority are schools, universities, healthcare, non-profit, and public administration.
Organizations are based in distinct geographical regions in Spain, and their distribution
by size is as follow: less than 50 employees: 44; between 50 and 249 employees: 87;
250 and more employees: 85.
4.2. Measures
Each criterion was measured by the score provided by CEG, whose assessors allocate values from 0 to 100, using the results-approach-deployment-assessment and refinement
(RADAR) assessment (EFQM, 2012). When considering Enablers sub-criteria,
assessors examine the approaches (A) that are adopted, their deployment (D) and how
they are assessed and refined over time (AR). When evaluating Results sub-criteria, the
focus is on the relevance of results and their performance. Once the sub-criteria scores
are allocated for a criterion, their average becomes the score for the criterion.
Consequently, in the analyses there are 9 criteria and 32 sub-criteria, as summarized in
Table 3. These assessments are reliable sources of information due to the training and
specialization that qualified assessors have (e.g., Jayamaha et al., 2011; Gómez et al.,
Following Gómez et al. (2011), when estimating the baseline structural model (Figure
1), each EFQM criterion was measured by one construct that is equal to the value
provided by CEG. This measurement is consistent with previous studies (e.g., Jayamaha
et al., 2009; Heras et al., 2012; Karimi et al., 2014), which used the scores from the
external assessment as the measures of criteria in BEMs.
Organization size was operationalized through the number of employees. Following the EU Commission Recommendation (2003/361/EC) and consistent with previous
analyses (e.g., Jayaram et al., 2010), a distinction was made between SMEs (those
employing less than 250 employees) and large organizations (those with 250 or more
employees).
4.3. Analysis Procedure
Inspired by Roca et al. (2006) and Sila (2007) analyses of QM practices, a two-stage
procedure was undertaken to assess the potential effect of the size.
Testing Hypothesis 1
First, Chi-square tests of independence were employed to investigate the association
between level of recognition and size. Analysis of variance (ANOVA) and t-tests were
used to assess differences in EFQM criteria scores. In order to examine the sensitivity of
the findings, a Confirmatory Factor Analysis (CFA) with the five Enablers as correlated
first-order factors was estimated, and differences between SMEs and large organizations
factor-scores were examined. In addition, a disaggregated analysis at sub-criteria level
was conducted to compare SMEs and large organizations in more detail.
Testing Hypothesis 2
In order to examine the relationships implied by the EFQM model, an empirical
validation of the baseline structural model (Figure 1) was carried out on the whole
sample. Model fit was judged based on Chi-square tests and parameters’ standard
errors, which were estimated according to Satorra and Bentler (1994) scaled
goodness-of-fit test statistics. Given that the baseline model did not fit the data, by inspecting
modification indices, alternative theoretical models were examined in the light of
previous literature. After identifying an alternative model that fits the population, a
11
significantly different between SMEs and large organizations. The coefficients in the
models were estimated via maximum likelihood using EQS 6.1 (Bentler, 2006).
5. Results
5.1. Preliminary data analysis of the adoption of the EFQM model
The data were screened for outliers. The sample, which is analyzed, has 214 of the
original 216 organizations that constitute the population. It is noteworthy that all
organizations in the study have applied to be recognized for excellence, consequently,
they must have some understanding of QM principles or at least a level of
implementation that they judged to be worthy of accreditation. Table 1 shows
descriptive statistics for the Enablers and Results criteria. It indicates potential
differences in mean, for these range from 31.10 to 45.55. Variances are not statistically
different, as shown by the standard deviations (S.D.). The correlations between the
criteria (the last nine columns of Table 1) are positive and statistically significant at the
1% level, thus confirming the expected bivariate associations.
‐‐‐‐‐‐‐‐‐‐‐‐‐‐‐‐‐‐‐‐‐‐‐‐‐
Table 1
‐‐‐‐‐‐‐‐‐‐‐‐‐‐‐‐‐‐‐‐‐‐‐‐‐
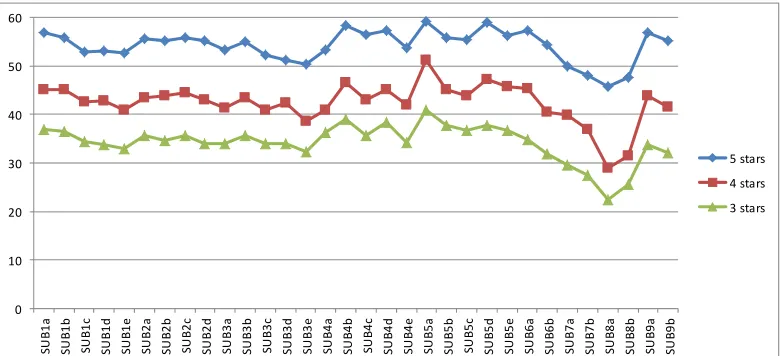
Figure 2 summarizes the mean scores in each level of excellence. According to an
ANOVA, the observed differences in scores between the three groups are statistically
significant at the 1% level. Not surprisingly, the group of 5-stars has the highest means
in all sub-criteria, while, the group of 3-stars shows the lowest. All excellence levels
score higher in management of processes (SUB 5a). The lowest mean scores relate to
Society Results (SUB 8a-8b). Consistent with previous analysis (Blind reference), this
plot shows a common pattern in the distribution of scores, thus suggesting a similar
interpretation of the model by Spanish organizations that are recognized for excellence.
‐‐‐‐‐‐‐‐‐‐‐‐‐‐‐‐‐‐‐‐‐‐‐‐‐
Figure 2
‐‐‐‐‐‐‐‐‐‐‐‐‐‐‐‐‐‐‐‐‐‐‐‐‐
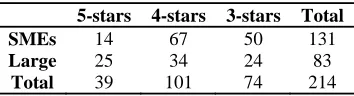
Table 2 shows the cross-tabulation of level of excellence and size: most of the 39
organizations (64.1 %) awarded 5-stars recognition are large, whereas most of the 74
frequencies, there is positive association (Chi-square; 2 d.f.) = 12.90; p< 0.01): large
organizations are more likely to reach a higher level of excellence than SMEs.
‐‐‐‐‐‐‐‐‐‐‐‐‐‐‐‐‐‐‐‐‐‐‐‐‐
Table 2
‐‐‐‐‐‐‐‐‐‐‐‐‐‐‐‐‐‐‐‐‐‐‐‐‐
5.2. Contingency analysis of the adoption of EFQM criteria
Table 3 shows the mean scores in each of the EFQM criteria, significant differences
between SMEs and large organizations are highlighted. Accordingly, large
organizations have higher scores. However, not all differences are significant, as for
example, Leadership and Strategy are similar across SMEs and large companies. In
general, large organizations obtained significantly higher scores in People, Partnerships
and Resources, Processes, products and services and the Results-criteria, but not in
People Results.
‐‐‐‐‐‐‐‐‐‐‐‐‐‐‐‐‐‐‐‐‐‐‐‐‐
Table 3
‐‐‐‐‐‐‐‐‐‐‐‐‐‐‐‐‐‐‐‐‐‐‐‐‐
A Confirmatory Factor Analysis (CFA) of the Enablers-criteria of the EFQM model did
not fit the data (BBN-NFI=0.899; RMSEA =0.094). Taking into account the Lagrange
multiplier test (LMtest), a new model fitted (BBN-NFI=0.911; RMSEA=0.058).
Criterion 5 (Processes, products and services) was divided into two factors, one that
accounts for sub-criteria 5a, representing process management, and another that
encompasses the correlation of the remaining sub-criteria, which can be interpreted as
customer orientation in the design of products. Hence, in this population of recognized
for excellence Spanish organizations, six factors represent the Enablers side of the
EFQM model. Cronbach’s alpha for the multi-item factors are greater than 0.7, thus
implying that the measures are reliable. Significant differences (at 1% or 5%
significance levels) between SMEs and large organizations were found in People,
Partnership and Resources, and the new factor that accounts for sub-criteria 5b to 5e. In
line with the previous results based on criteria scores, no significant difference was
observed in factors representing Leadership and Strategy. Perhaps surprisingly, given
previous literature, no differences were found in the new factor denoting process
13
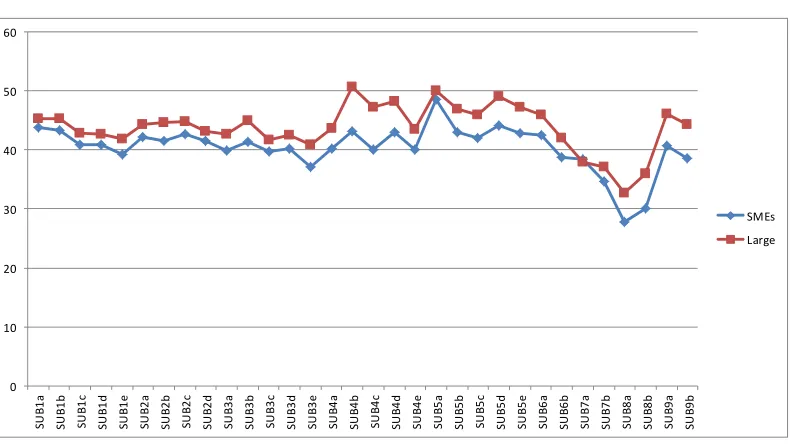
Significant differences in findings were observed when analyzing sub-criteria. First,
concerning Leadership (sub-criterion 1e), leaders are more likely to be catalysts of
change in large organizations. Second, with respect to Strategy (sub-criterion 2b), large
organizations have greater means to develop strategy based on internal performance,
because they are likely to have more formal and structured measurement systems.
Thirdly, concerning People, no significant differences were found regarding
empowerment (sub-criterion 3c) and communication (sub-criterion 3d).
‐‐‐‐‐‐‐‐‐‐‐‐‐‐‐‐‐‐‐‐‐‐‐‐‐
Figure 3
‐‐‐‐‐‐‐‐‐‐‐‐‐‐‐‐‐‐‐‐‐‐‐‐‐
In summary, Hypothesis 1 is partially supported since size was associated with the level
of adoption of practices in some, but not in all criteria.
5.3. The relationships proposed within the EFQM Excellence Model
Concerning Hypothesis 2, the baseline model in Figure 1 was tested using the sample of
214 organizations. This model did not fit the data (Satorra-Bentler 2 = 293.86 (24
d.f.)p = 0.00; BB-NNFI = 0.789; RMSEA = 0.230). After considering the
modification indices, more specifically the LMtest, and the relationships that have been
proposed (e.g., Anderson et al., 1994, Nabitz et al., 2001; Jayaram et al., 2010), the
model was re-specified.
The modified model that followed is shown in Figure 4. It represents Enablers by
Leadership and a latent construct that accounts for the correlation between the
remaining criteria. In contrast to previous analyses of the EFQM model (e.g., Santos
and Alvarez, 2007; Bou et al., 2009) where a single latent construct reflected the enabler
side of the model, in Figure 4, two latent constructs are present. Accordingly,
Leadership establishes a climate that is prone to the adoption of other best practices,
since it is seen as an engine that guarantees an appropriate system for continuous
improvement and monitoring of success (Anderson et al., 1994; Osseo-Asare et al.,
2005; He et al., 2011). System Design (SD) captures what Jayaram et al. (2010) call “a
socio-technical mix” of practices ranging from people management to process
management and resource management. In fact, Manz and Stewart (1997) observed that
Hackman and Wageman, 1995; Lewis et al., 2006; Bou et al., 2009) recognized the dual
interrelated emphasis in quality practices (technical and social).
Considering the Results domain, high correlation among criteria was found, thus
corroborating previous research by Bou et al. (2009), which identified a latent construct
that accounts for the equilibrium in the satisfaction of the stakeholders’ interests. A
confirmatory factor analysis (CFA) supported a common factor in Results-criteria
(BB-NNFI = 0.998; RMSEA = 0.023; Cronbach’s alpha =0.882), whose loadings range from
0.744 (Society Results) to 0.879 (Business Results).
‐‐‐‐‐‐‐‐‐‐‐‐‐‐‐‐‐‐‐‐‐‐‐‐‐
Figure 4
‐‐‐‐‐‐‐‐‐‐‐‐‐‐‐‐‐‐‐‐‐‐‐‐‐
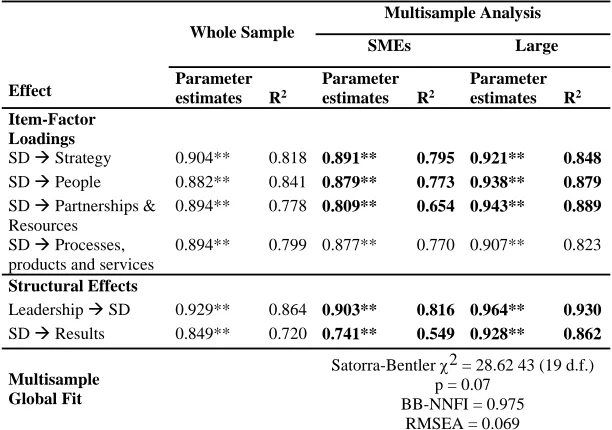
The model in Figure 4 fits the data, as judged by the goodness-of-fit indices (BB-NNFI
= 0.981; RMSEA = 0.07) and sample size. Table 4 summarizes the parameter estimates
and their significance in the whole sample. It includes the factor loadings of criteria on
the latent construct, the structural paths, and the percentage of variance in the results
variable that is explained (R2). As shown in the second column, all item factor-loadings
of the criteria on System Design (SD) are statistically significant, thus indicating that
the criteria reflect the latent construct. Moreover, the path coefficients (Structural
Effects), linking Leadership to the latent factor (SD) and this to Results, are positive and
statistically significant, indicating a high association between Enablers and Results.
‐‐‐‐‐‐‐‐‐‐‐‐‐‐‐‐‐‐‐‐‐‐‐‐‐
Table 4
‐‐‐‐‐‐‐‐‐‐‐‐‐‐‐‐‐‐‐‐‐‐‐‐‐
Following Bentler (2006), a multisample analysis was run constraining factor loadings
and structural paths to be equal for both groups of organizations. Goodness-of-fit
statistics were then assessed. Only one of the equality constraints (SD-Processes,
products and services) can be held, indicating that it is invariant with regard to size.
Consequently, the other constraints had to be removed, and there is an effect of size.
The output for the resulting model is summarized in columns 4 to 7 of Table 4
(Multisample Analysis). This model fits the data, according to its p-value and fit indices
shown at the bottom of the table (Multisample Global Fit). All factor loadings and
structural coefficients are positive and significant (SMEs, Large). In addition, the
15
than 0.7, indicating that the model explains a substantial amount of the variance in the
data.
When the parameter estimates in Table 4 are compared, only one estimate (Processes,
products and services) is not statistically different between SMEs and large
organizations. System Design differs between the two groups, because loadings are
higher for large organizations. Considering the paths towards Results, parameter
estimates are also higher for large organizations. In consequence, there is an effect of
size that seems to favor large organizations.
6. Discussion
6.1 On the hypotheses tested
Hypothesis 1: A contingency perspective on the adoption of the EFQM model
This paper contributes to the debate on the universal adoption versus the contingent use
of best practices in QM. Large organizations were found to exhibit a higher adoption of
best practices within the EFQM model in some criteria, but not in all, thus corroborating
early articles by Ghobadian and Gallear (1996, 1997). In addition, some elements in the
EFQM model appear universally applicable namely: Leadership (except for the role of
leader as agent of change); the consideration of stakeholders in Strategy formation and
deployment; and specific high involvement practices, such as empowerment (3c) and
communication (3d) that, according to Gooderham et al. (2008), foster collaboration
within the organization. Similarly, process design and process management practices
(5a), contrary to some previous conclusions (Roca et al., 2006), do not differ regarding
size. The apparent universal adoption of these practices by organizations that are
recognized for excellence is not surprising, since the basic principles of QM imply that
empowered employees, well designed and managed processes, and communication are
critical for problem-solving and team-working.
By contrast, the uses of several practices were found to be contingent on size. Most
noticeably, large organizations and SMEs differed in how they train and reward people;
manage their partnerships and resources, and design, market, deliver and customize
products and services. Concerning People, the findings are consistent with previous
research that show training and rewards systems to be more common in large
organizations (e.g., Ghobadian and Gallear, 1996, 1997; Sun and Cheng, 2002). Within
customized by organizations. In fact, Gómez et al. (2011) found differences in the
adoption of the more technical Enablers, when examining industrial and service
companies. Organizations may be adapting some QM practices to their day to day
context and constraints, as observed by Ghobadian and Gallear (1996, 1997). Moreover,
limited resources may prevent SMEs from having sophisticated performance
measurement systems (Angell and Corbett, 2009) and moving towards fact-based
management, as highlighted by the observed differences in sub-criterion 2b.
Further analysis of differences between small and medium organizations at the criteria
level reinforces the contingency effect of size. Small and medium organizations differ in
their management of Partnerships, resources, Processes, products and services and in
the results they obtain regarding society. All in all, there are suggestions that limited
resources impact the ability to obtain high scores in certain criteria in the EFQM model.
When comparing to previous studies of the adoption of the EFQM, the potential effect
of size observed in the present study do not fully support Calvo-Mora et al.’s (2015)
conclusions that large organizations are stronger in managing the elements in the EFQM
model. Differences in findings could stem from the fact that the authors focused on
three factors that encompassed Enablers-criteria, rather than examining sub-criteria. In
which case, disaggregation may impact findings.
Hypothesis 2: A contingency perspective on the relationships in the EFQM model
Concerning the relationships in the EFQM model, the present study supports previous
conclusions (e.g., Terziovski and Samson, 1999; Sun and Cheng, 2002; Roca et al.,
2006) that size is a moderator in the association between Enablers and Results. It
appears that greater access to resources, which is generally associated with large
organizations (Haar and Spell, 2008; Abdullah, 2010), plays an important part in linking
the use of best practices to the achievement of results. By contrast, there is no support
for Hendricks and Singhal’s (2001) and Jayaram et al.’s (2010) conclusions that the
nimbleness associated with small firms would link QM practices to results, nor for
Ahire and Golhar’s (1996) and Sila’s (2007) findings that size is neither linked with
QM adoption nor moderates the association with performance.
The use of perceptions or subjective measures of QM practices in previous studies may
explain divergences in findings. Moreover, as noted by Sturkenboom et al. (2001) and
17
conflicting findings. For instance, Sila (2007) defined SMEs as having up to 500
employees, while here the threshold is 250 employees. Finally, differences may be due
to variations in the conceptualization and measurement of performance, for example,
Hendricks and Singhal (2001) focused on operating income and sales, while the EFQM
definition of performance implies a wider range of results and stakeholders.
6.2 On the elements of the EFQM model
The EFQM model in practice
A main contribution of this study is a call for the revision of the relationships embedded
in the EFQM model. As shown by Gómez et al. (2011) and Heras et al. (2012), the
model does not work as expected, as some of the implicit relationships are not
empirically supported. The present findings extend previous analyses by suggesting a
network of relationships, which is consistent with Jayaram et al.’s (2010: 352) QM
model, where “an early emphasis on culture variables does enhance the design of
quality systems, specifically a mix of socio-technical tools, which in turn positively
affects QM outcomes”. Hence, a general structure in the EFQM model was here
identified, where size is likely to determine the way the QM system is designed. This
study therefore reinforces the need for a comprehensive and integrated QM (Hackman
and Wageman, 1995; Bou et al., 2009; Zu, 2009; Calvo-Mora et al., 2015). It does not
support previous observations (e.g., Laohavichien et al., 2011) that core (hard) QM
practices mediate the relationship between infrastructure (soft) QM practices and
results. In all, according to this population of Spanish organizations, SMEs do not
prioritize People nor large organizations emphasize Processes, i.e., for organizations in
the path to excellence, the social is as important as the technical as both form part of a
management system.
The potential effect of size on the role of Leadership
Given the model identified and in line with Abdullah’s (2010) conclusions, this study
argues for a facilitating role of Leadership in creating the necessary breeding climate for
the design of a system of best practices and high performance. It also highlights how
Leadership may play different roles in organizations of different sizes. Leaders are
managers of change in large organizations. For example, Vaccaro et al (2012) observed
that the stronger role of transformational leaders in larger organizations compensated
flexible approach (Ghobadian & Gallear, 1996, 1997; Assarlind & Gremyr, 2014)
facilitates the communication of policies and strategies, and therefore the role of leaders
in change management is less paramount. This observation may contradict a common
perception that small organizations rely on their owner to implement change. It is
possible that role of Leadership as catalyst of change can be replaced or diluted by
empowered and autonomous teams that can influence the process needed to the
successful adoption of the EFQM model. It could also be that time is more crucial for
smaller organizations and thus all levels in the organization need to be equally actively
involved in change management.
The potential effect of size on human resource practices
The present study also has implications for how SMEs and large organizations address
high performance work practices in the context of the EFQM model. The findings
suggest that (Spanish) SMEs may have limited resources (Ghobadian and Gallear, 1996;
Jayaram et al., 2010) to invest in the skill and motivational practices of high
performance work systems (Huselid, 1995), which are implicit in BEMs. Moreover, the
incidence of human resource plans supporting the organization’s strategy was observed
to be higher in large organizations. However, no differences were found in other high
involvement practices (e.g., empowerment and communication). Hence, in smaller
organizations, it may even be that direct communication becomes a substitute for
training due to informality, fewer layers of management or barriers between
departments. As stressed by Allen et al. (2013), smaller organizations emphasize
commitment-based HR practices. Finally, People Results were found to be independent
of size. That is, although SMEs address human resource management differently from
large organizations, in Spain, the practices that they use are equally effective.
6.3. Practical implications for managers
The model in Figure 4 imply that Leadership is critical to the development of a systemic
approach that balances social and technical best practices, as concluded in previous
analyses of the EFQM model (e.g., Bou et al., 2009, Calvo-Mora et al., 2014, 2015).
Extending Jayaram et al. (2010) conclusions, when using the EFQM model for
benchmarking, managers should consider benchmarks that share similar contextual
factors. Otherwise, they would emulate best practices that may not work as well in their
19
As a whole the findings of this research support Gustafsson et al.’s (2003) observations
that the QM strategy must change when an organization grows. In doing so, they
question the current version of the EFQM model as a framework that can be applied to
any organization, regardless of size. EFQM could therefore reconsider the development
of a separate set of criteria for SMEs that reflect the size of organizations. In all,
promoters of BEMs can benefit from this research in designing or improving their
models.
6.4. Limitations and future research
This study has focused on the possible effect that size may have on how organizations
interpret the EFQM model. Given its findings, an avenue for future research is an
investigation of how SMEs can design and improve performance measurement systems,
or how standard systems and software can be adapted to resources. It may be that lighter
versions of software could facilitate fact-based management and the information sharing
that is critical in managing partnerships. Furthermore, the different effects of size on
soft and hard elements of QM suggest a need for investigating other contingency factors
in the adoption of social and technical practices within the EFQM model.
In this sense, there are other contextual factors to be considered, such as the length of
time the organization is committed to a QM initiative, sector, organization strategy,
structure or environmental features. The data available for this study does not enable a
broader analysis of contextual factors. Although the database only enables the
comparison of a few sectors, an attempt was made to identify sectorial differences in
each group of organizations (SMEs and large). In the main, there were no significant
differences in criteria across sectors, thus supporting Calvo-Mora et al.’s (2015)
aggregated sectorial analysis. The only difference observed was in relation to criterion 8
(Society Results), since large organizations in the health sector perform better than
those in the education sector. Nonetheless, this observation should be interpreted with
care because of the very small sample sizes. In this line of research, analyses of large
samples that include all sectors in the economy are needed, so that the pairwise
observations made in the literature (e.g., Tarí, 2008; Gómez et al., 2011) can be finally
tested in more representative settings.
Furthermore, the evolution of organizations from their early use of the EFQM to their
examine longitudinal data covering a sequence of applications to the recognition
scheme, which would allow for the identification of the path(s) that are followed by
organizations in their road towards excellence.
7. Conclusion
This study has analyzed organizational size as a contingency factor in interpreting the
EFQM Excellence Model. Its first goal was to investigate differences in the use of best
practices embedded in the model and in the results attained. The second goal was to
examine how size may moderate the relationships between criteria. The findings suggest
the existence of a subset of high involvement and process management practices that are
more universally applicable, but also that other practices may be customized or are more
dependent in local resources. This hybrid approach to the model can be a promising way
to reconcile the universal adoption and the adaptation of best practices to organizational
context.
The findings reinforce the EFQM model as a system and the role of Leadership as a key
to develop a systemic approach that balances social and technical best practices to
improve results. Criteria should be integrated, so that they can perform effectively.
Nevertheless, the findings suggest that an equivalent effort in improving Leadership and
systems design may lead to greater effects in large organizations.
In conclusion, the present study contributes to the contingency theory on BEMs. It
provides new insights for the successful adoption of management practices embedded in
the EFQM model, as well as for assessors and bodies that promote the EFQM model, as
21
References
Abdullah, A. (2010), “Measuring TQM implementation: a case study of Malaysian SMEs”, Measuring Business Excellence, Vol. 14, No 3, pp. 3-15.
Ahire, S. L., & Golhar, D. Y. (1996), “Quality management in large vs small firms”,
Journal of Small Business Management, Vol. 34, No. 2, pp. 1-13.
Allen, M. R., Ericksen, J., & Collins, C. J. (2013), “Human resource management, employee exchange relationships, and performance in small businesses”, Human Resource Management, Vol. 52, No. 2, pp. 153-173.
Anderson, J. C., Rungtusanatham, M., & Schroeder, R. G. (1994), “A theory of quality management underlying the Deming management method”, Academy of Management Review, Vol. 19, No. 3, pp. 472-509.
Angell, L. C., & Corbett, L. M. (2009), “The quest for business excellence: evidence from New Zealand's award winners”, International Journal of Operations & Production Management, Vol. 29, No. 2, pp. 170-199.
Assarlind, M., & Gremyr, I. (2014), “Critical factors for quality management initiatives in small-and medium-sized enterprises”, Total Quality Management & Business Excellence, Vol. 25, No. 3-4, pp. 397-411.
Bentler, P. M. (2006), EQS structural equations program manual, Multivariate Software, Inc., Encino, CA.
Bou, J. C., Escrig, A. B., Roca, V., & Beltrán, I. (2009), “An empirical assessment of the EFQM Excellence Model: Evaluation as a TQM framework relative to the MBNQA Model”, Journal of Operations Management, Vol. 27, No. 1, pp. 1-22. Boulter, L., Bendell, T., & Dahlgaard, J. (2013), “Total quality beyond North America:
A comparative analysis of the performance of European Excellence Award winners”, International Journal of Operations & Production Management, Vol. 33, No. 2, pp. 197-215.
Calvo-Mora, A., Picón, A., Ruiz, C., & Cauzo, L. (2014), “The relationships between soft-hard TQM factors and key business results”, International Journal of Operations & Production Management, Vol. 34, No. 1, pp. 115-143.
Calvo-Mora, A., Picón-Berjoyo, A., Ruiz-Moreno, C., & Cauzo-Bottala, L. (2015), “Contextual and mediation analysis between TQM critical factors and organisational results in the EFQM Excellence Model framework”, International Journal of Production Research, Vol. 53, No. 7, pp. 2186–2201.
Commission of the European Communities (2003), Commission recommendation of 6 May 2003 concerning the definition of micro, small and medium-sized enterprises, Official Journal of the European Union, L 124, 20/05/2003, pp. 36-41.
Corredor, P., & Goñi, S. (2011), “TQM and performance: Is the relationship so obvious?” Journal of Business Research, Vol. 64, pp. 830-838.
Dahlgaard-Park, S. M. (2008), “Reviewing the European excellence model from a management control view”, The TQM Journal, Vol. 20, No. 2, pp.98-119.
Dean, J. W. & Bowen, D. E. (1994), “Management theory and total quality: improving research and practice through theory development”, Academy of Management Review, Vol. 19, No. 3, pp. 392-418.
Dyer, J. H., & Singh, H. (1998), “The relational view: Cooperative strategy and sources of interorganizational competitive advantage”, Academy of Management Review, Vol. 23, No. 4, pp. 660-679.
Eskildsen, J. K., Kristensen, K., & Juhl, H. J. (2004), “Private versus public sector excellence”, The TQM Magazine, Vol. 16, No. 1, pp.50-56.
European Foundation for Quality Management (EFQM) (2012), EFQM Model for Business Excellence, EFQM, Brussels.
Evans, J. R., Ford, M. W., Masterson, S. S. & Hertz, H. S. (2012), “Beyond performance excellence: research insights from Baldrige recipient feedback”, Total Quality Management & Business Excellence, Vol. 23, No. 5-6, pp. 89-506.
Ghobadian, A., & Gallear, D. N. (1996), “Total quality management in SMEs”, Omega, Vol. 24, No. 1, pp. 83-106.
Ghobadian, A., & Gallear, D. N. (1997), “TQM and organization size”, International Journal of Operations & Production Management, Vol. 17, No. 2, pp. 121–163. Gómez, J., Martínez, M., & Martínez, A. R. (2011), “A critical evaluation of the EFQM
model”, International Journal of Quality & Reliability Management, Vol. 28, No. 5, pp. 484-502.
Gooderham, P., Parry, E., & Ringdal, K. (2008), “The impact of bundles of strategic human resource management practices on the performance of European firms”, The International Journal of Human Resource Management, Vol. 19, No. 11, pp. 2041-2056.
Grigg, N., & Mann, R. (2008), “Rewarding excellence: an international study into business excellence award processes”, Quality Management Journal, Vol. 15, No. 3, pp. 26-40.
Gustafsson, A., Nilsson, L., & Johnson, M. D. (2003), “The role of quality practices in service organizations”, International Journal of Service Industry Management, Vol. 14, No. 2, pp. 232-244.
Haar, J. M., & Spell, C. S. (2008), “Predicting total quality management adoption in New Zealand: The moderating effect of organisational size”, Journal of Enterprise Information Management, Vol. 21, No.2, pp. 162-178.
Hackman, J. R., & Wageman, R. (1995), “Total quality management: empirical, conceptual, and practical issues”, Administrative Science Quarterly, Vol. 40, pp. 309-342.
23
Hendricks, K. B., & Singhal, V. R. (2001), “Firm characteristics, total quality management, and financial performance”, Journal of Operations Management, Vol. 19, pp. 269-285.
Heras, I., Marimon, F., & Casadesús, M. (2012), “An empirical study of the relationships within the categories of the EFQM model”, Total Quality Management & Business Excellence, Vol. 23, No. 5-6, pp. 523-540.
Hides, M. T., Davies, J., & Jackson, S. (2004), “Implementation of EFQM excellence model self-assessment in the UK higher education sector–lessons learned from other sectors”, The TQM Magazine, Vol. 16, No. 3, pp. 194-201.
Huselid, M. A. (1995), “The impact of human resource management practices on turnover, productivity, and corporate financial performance”, Academy of Management Journal, Vol. 38, No. 3, pp. 635-672.
Jayamaha, N., Grigg, N., & Mann, R. (2009), “A study of the validity of three major business excellence models in the Asia Pacific region”, Total Quality Management, Vol. 20, No. 11, pp. 1213-1227.
Jayamaha, N., Grigg, N., & Mann, R. (2011), “Empirical analysis of the Baldrige criteria as both an organizational performance measure and a theoretical model”,
Measuring Business Excellence, Vol. 15, No. 1, pp. 20-33.
Jayaram, J., Ahire, S. L., & Dreyfus, P. (2010), “Contingency relationships of firm size, TQM duration, unionization, and industry context on TQM implementation-A focus on total effects”, Journal of Operations Management, Vol. 28, No. 4, pp. 345-356. Kanji, G. K. (2002), “Performance measurement system”, Total Quality Management,
Vol. 13, No. 5, pp. 715-28.
Karimi, A., Safari, H., Hashemi, S. H., & Kalantar, P. (2014), “A study of the Baldrige Award framework using the applicant scoring data”, Total Quality Management & Business Excellence, Vol. 25, No. 5-6, pp. 461-477.
Kim, D. Y., Kumar, V., & Murphy, S. A. (2010), “European foundation for quality management business excellence model: an integrative review and research agenda”, International Journal of Quality & Reliability Management, Vol. 27, No. 6, pp. 684-701.
Kumar, M., & Antony, J. (2008), “Comparing the quality management practices in UK SMEs”, Industrial Management & Data Systems, Vol. 108, No. 9, pp. 1153-1166. Laohavichien, T., Fredendall, L. D. & Cantrell, R. S. (2011),"Leadership and quality
management practices in Thailand", International Journal of Operations & Production Management, Vol. 31, No. 10, pp. 1048 – 1070.
Lee, G. L. & Oakes, I. (1995), “The ‘pros’ and ‘cons’ of Total Quality Management for smaller companies in manufacturing: some experiences down the supply chain”,
Total Quality Management, Vol. 6, pp. 413-426.
Leseure, M. J., Bauer, J., Birdi, K., Neely, A., & Denyer, D. (2004), “Adoption of promising practices: a systematic review of the evidence”, International Journal of Management Reviews, Vol. 5, No. 3‐4, pp. 169-190.
Manz, C. C., & Stewart, G. L. (1997), “Attaining flexible stability by integrating total quality management and socio-technical systems theory”, Organization Science, Vol. 8, No. 1, pp. 59-70.
Mohammad, M., Mann, R., Grigg, N., & Wagner, J. P. (2011), “Business Excellence Model: An overarching framework for managing and aligning multiple organisational improvement initiatives”, Total Quality Management & Business Excellence, Vol. 22, No. 11, pp. 1213-1236.
Nabitz, U., Severens, P., Van Den Brink, W., & Jansen, P. (2001), “Improving the EFQM Model: An empirical study on model development and theory building using concept mapping”, Total Quality Management, Vol. 12, No. 1, pp. 69-81.
Netland, T. H. & Aspelund, A. (2014),”Multi-plant improvement programmes: a literature review and research agenda”, International Journal of Operations & Production Management, Vol. 34, No. 3 pp. 390-418.
Osseo-Asare, A. E., Longbottom, D. & Murphy, W. D. (2005),”Leadership best practices for sustaining quality in UK higher education from the perspective of the EFQM Excellence Model”, Quality Assurance in Education, Vol. 13, No. 2, pp. 148 - 170
Roca, V., Escrig, A. B., Bou, J. C., & Beltrán, I. (2006), “A systemic and contingent view of the basic elements of quality management”, Total Quality Management and Business Excellence, Vol. 17, No. 9, pp. 1111-1127.
Rusjan, B. (2005), “Usefulness of the EFQM Excellence model: theoretical explanation of some conceptual and methodological issues”, Total Quality Management, Vol. 16, No. 6, pp. 363-380.
Safari, H., Abdollahi, B., & Ghasemi, R. (2012), “Canonical correlation analysis between people criterion and people results criterion in EFQM model”, Total Quality Management & Business Excellence, Vol. 23, No. 5-6, pp. 541-555.
Sampaio, P., Saraiva, P., & Monteiro, A. (2012), “A comparison and usage overview of business excellence models”, The TQM Journal, Vol. 24, No. 2, pp. 181-200.
Santos, M. L., & Álvarez, L. I. (2007), “Innovativeness and organizational innovation in total quality oriented firms: The moderating role of market turbulence”,
Technovation, Vol. 27, No. 9, pp. 514-532.
Satorra, A. & Bentler, P. M. (1994), “Corrections to test statistics and standard errors in covariance structure analysis”, in von Eye, A., Clogg, C. C. (Eds.), Latent Variables Analysis: Applications for Developmental Research, Sage, Thousand Oaks, CA, pp. 399-419.
Sila, I. (2007), “Examining the effects of contextual factors on TQM and performance through the lens of organizational theories: An empirical study”, Journal of Operations Management, Vol. 25, pp. 83-109.
Sousa, R., & Voss, C. A. (2002), “Quality management re-visited: a reflective review and agenda for future research”, Journal of Operations Management, Vol. 20, pp. 91-109.
25
Storey, D. J., Saridakis, G., Sen-Gupta, S., Edwards, P. K. & Blackburn, R. A. (2010), “Linking HR formality with employee job quality: the role of firm and workplace size”. Human Resource Management, Vol. 49, No. 2, pp. 305-329.
Sturkenboom, J., Van Der Wiele, T., & Brown, A. (2001), “An action-oriented approach to quality management self-assessment in small and medium-sized enterprises”, Total Quality Management, Vol. 12, No. 2, pp. 231-246.
Sun, H., & Cheng, T. K. (2002). “Comparing reasons, practices and effects of ISO 9000 certification and TQM implementation in Norwegian SMEs and large firms”.
International Small Business Journal, Vol. 20, No. 4, pp. 421-442.
Talwar, B. (2011), “Business excellence models and the path ahead”, The TQM Journal, Vol. 23, No. 1, pp. 21-35.
Tarí, J. (2008), “Self-assessment exercise: a comparison between a private sector organization and higher education institutions”, International Journal of Production Economics, Vol. 114, pp. 105-18.
Taylor, W. A., & Wright, G. H. (2003), “A longitudinal study of TQM implementation: factors influencing success and failure”, Omega, Vol. 31, No. 2, pp. 97-111.
Temtime, Z. T. (2003),”The moderating impacts of business planning and firm size on total quality management practices”, The TQM Magazine, Vol. 15, No. 1, pp. 52-60. Terziovski, M. & Samson, D. (1999), “The link between total quality management
practice and organisational performance”, International Journal of Quality & Reliability Management, Vol. 16, No. 3, pp. 226-237.
Vaccaro, I. G., Jansen, J. J., Van Den Bosch, F. A., & Volberda, H. W. (2012), “Management innovation and leadership: The moderating role of organizational size”. Journal of Management Studies, Vol. 49, No.1, pp. 28-51.
Voss, C. A. (2005), “Paradigms of manufacturing strategy re-visited”, International Journal of Operations & Production Management, Vol. 25, No. 12, pp. 1223-1227. Watson, J. G., Korukonda, A. R. (1995), “The Total Quality Management Jungle: a
Dialectical Analysis”, International Journal of Quality & Reliability Management, Vol. 12, No. 9, pp. 100-109.
Wilkes N, & Dale, B. (1998), “Attitudes to self-assessment and quality awards: A study in small and medium-sized companies”, Total Quality Management, Vol. 9, No. 8, pp. 731-739.
Williams, R., Bertsch, B., Van der Wiele, A., Van Iwaarden, J., & Dale, B. (2006), “Self-Assessment against Business Excellence Models: A Critique and Perspective”, Total Quality Management and Business Excellence, Vol. 17, No. 10, pp. 1287-1300.
Zhang, D., Linderman, K., & Schroeder, R. G. (2012), “ The moderating role of contextual factors on quality management practices”, Journal of Operations Management, Vol. 30, No.1, pp. 12-23.
27
Figure 1. The EFQM Excellence Model
Source: adapted from EFQM (2012)
Figure 2. Mean sub-criteria scores by excellence level
0 10 20 30 40 50 60 SU B1 a SU B 1 b SU B1 c SU B 1 d SU B 1 e SU B2 a SU B 2 b SU B2 c SU B 2 d SU B3 a SU B 3 b SU B3 c SU B 3 d SU B 3 e SU B4 a SU B 4 b SU B4 c SU B 4 d SU B 4 e SU B5 a SU B 5 b SU B5 c SU B 5 d SU B 5 e SU B6 a SU B 6 b SU B7 a SU B 7 b SU B8 a SU B 8 b SU B9 a SU B 9 b
5 stars
4 stars 3 stars
Learning, Creativity and Innovation
Processes Products & Services 10%
Enablers Results
People 10%
Strategy 10%
Partnerships & Resources 10%
People Results
[image:28.612.109.500.329.507.2]Figure 3. Mean sub-criteria scores by size 0 10 20 30 40 50 60 SU B 1 a SU B 1 b SU B 1 c SU B 1 d SU B 1 e SU B 2 a SU B 2 b SU B 2 c SU B 2 d SU B 3 a SU B 3 b SU B 3 c SU B 3 d SU B 3 e SU B 4 a SU B 4 b SU B 4 c SU B 4 d SU B 4 e SU B 5 a SU B 5 b SU B 5 c SU B 5 d SU B 5 e SU B 6 a SU B 6 b SU B 7 a SU B 7 b SU B 8 a SU B 8 b SU B 9 a SU B 9 b SMEs Large
Figure 4: Modified structural model for the whole sample
Processes,
products &
services
Strategy People Partnerships
& Resources
Leadership System Design Results
[image:29.612.166.466.353.460.2]29
Table 1. Descriptive statistics and correlations of criteria scores (N = 214)
Variable Min. Max. Mean S.D. C1 C2 C3 C4 C5 C6 C7 C8 C9 C1 25.50 62.00 42.43 7.98 1
C2 23.75 66.25 42.84 8.73 0.865** 1
C3 25.22 62.25 40.83 7.76 0.856** 0.807** 1 C4 25.50 65.50 43.37 7.99 0.803** 0.779** 0.831** 1 C5 25.33 67.75 45.55 8.21 0.828** 0.810** 0.815** 0.796** 1
C6 20.00 68.75 42.85 9.28 0.699** 0.722** 0.680** 0.688** 0.724** 1 C7 11.25 60.00 37.56 9.75 0.676** 0.638** 0.707** 0.542** 0.590** 0.684** 1 C8 10.00 64.38 31.10 10.81 0.613** 0.600** 0.681** 0.645** 0.598** 0.607** 0.652** 1 C9 20.00 73.13 41.82 10.15 0.668** 0.696** 0.633** 0.700** 0.674** 0.728** 0.623** 0.638** 1
** p < 0.01 (bivariate correlations, significance)
[image:30.612.218.395.262.310.2]C1: Criterion 1. Leadership; C2: Criterion 2. Strategy; C3: Criterion 3. People; C4: Criterion 4. Partnerships and Resources; C5: Criterion 5. Processes, Products and Services; C6: Criterion 6. Customer Results; C7: Criterion 7. People Results; C8: Criterion 8. Society Results; C9: Criterion 9. Business Results.
Table 2. Level of excellence and size-observed frequencies
5-stars 4-stars 3-stars Total
SMEs 14 67 50 131
Large 25 34 24 83