Int. J. Electrochem. Sci., 12 (2017) 3576 – 3588, doi: 10.20964/2017.05.46
International Journal of
ELECTROCHEMICAL
SCIENCE
www.electrochemsci.orgA Comparative Study on the Electrochemical Behaviour of
Aluminium and 8090 Al- Li-Cu-Mg Alloy in Acid Rain Solution
Zora Pilić*
and Ivana Martinović
Department of Chemistry, Faculty of Science and Education, University of Mostar, Mostar, Bosnia and Herzegovina
*
E-mail: [email protected]
Received: 10 February 2017 / Accepted: 18 March 2017 / Published: 12 April 2017
The growth mechanism and properties of the oxide films on aluminium and 8090 Al-Li-Cu-Mg alloy were studied in simulated acid rain (pH 4.5) by electrochemical techniques, cyclic voltammetry and electrochemical impedance spectroscopy. The potentiodynamic formation of anodic oxide film on aluminium and 8090 Al-Li-Cu-Mg alloy surfaces were described in terms of high field model. This is justified by the obtained values of kinetic parameters: the electric field strength (~106
V cm–1), ionic conductivity through the film (~10–12 S cm–1 and 10–13 S cm–1) and half jump distance (~0.150 nm). The impedance data shows that protective passive oxide film on aluminium and Al-Li-Cu-Mg alloy can be formed spontaneously at the open circuit potential in the studied solution with a high resistance (119 k cm2 for Al and 144 k cm2 for Al-Li-Cu-Mg alloy). Both electrochemical techniques revealed that the oxide film on Al-Li-Cu-Mg alloy has better protective properties than pure aluminium. The concentration of the metallic ions released into solution from aluminium and Al-Li-Cu-Mg alloy and measured by atomic absorption spectroscopy was in accordance with the results obtained from the electrochemical techniques.
Keywords: Aluminium, 8090 Al-Li-Cu-Mg alloy, Anodic film, Simulated acid rain, Cyclic voltammetry, Electrochemical impedance spectroscopy, Atomic absorption spectrometry.
1. INTRODUCTION
and resistance [1–9]. The stability of the oxide film on aluminium depends on temperature, chemical composition and pH of the electrolyte, while the thickness of the anodic film is determined by the applied anodizing potential [1].
A passive oxide film forms naturally on the aluminium surface under usual atmospheric conditions and it is stable in environments with pH between 4 and 9. However, in polluted atmospheric conditions (even in pH range in which the oxide film is stable), the protective surface film can be destroyed and corrosive attack takes place due the presence of aggressive ions [10, 11]. Aggressive anions degrade the oxide and cause film breakdown and pitting corrosion.
Acid rain corrosion has become an increasing concern due to increasing air pollution as a result of industrialization and the burning of fossils fuels containing gaseous acid oxides. These oxides dissolve in the rain forming the acid rain. The acid rain conditions lead to the deterioration of water quality, human health as well as metals subjected to polluted environments. The investigation of the corrosion mechanism of metals in different harsh environments enables their longer use and in the same time producing less waste and using less energy.
Gerengi et al. [11, 12] investigated the corrosion behaviour of aluminium 6060 and 6082 by scanning electron microscopy, atomic force microscopy, potentiodynamic polarization and dynamic electrochemical impedance spectroscopy in simulated acid rain, as well in pure water. Their measurements reveal that the pH of the studied environment is very effective on electrochemical corrosion process and that the protection film formed in the absence of acid rain has great importance against corrosion. They showed that the AA6060 and AA6082 have similar corrosion behaviours in pure and acid rain environments, but the AA6060 alloy was more resistant to corrosion in an acid rain environment than the AA6082 alloy.
Aluminium alloys containing lithium are potential materials for the aerospace applications due to their increased specific strength and elastic modulus and lowered density compared to the conventional used aluminium 2xxx and 7xxx series [13–16] alloys.
The electrochemical behaviour of 8090 Al- Li-Cu-Mg alloy was subject of several papers, but there are many disagreements about the corrosion behaviour of this alloy. Ricker and Duquette [17] found an increased corrosion susceptibility of an Al–4.2 Mg–2.1 Li alloy compared with the 7050 (Al– 6.5Zn– 2.4Mg–2.2Cu) alloy. De Jong and Martens [18] found that the pitting potential of Al– Cu–Mg (–Li) alloys became slightly more negative with lithium additions. In this investigation the kinetics of growth and electrochemical properties of the oxide films on the aluminium and 8090 Al- Li-Cu-Mg alloy in simulated acid rain, pH 4.5 was studied by using the electrochemical techniques of cyclic voltammetry (CV) and electrochemical impedance spectroscopy (EIS). The concentration of Al ions released during the oxidation process was performed using atomic absorption spectrometry (AAS).
2. EXPERIMENTAL PROCEDURE
cm2, respectively. The electrodes were mechanically abraded by 1200 grade emery paper, degreased with ethanol in an ultrasonic bath and rinsed with ultra pure water (18.2 M cm, produced by Millipore Simplicity UV Water Purification System). Prior to each measurement electrodes was polarized at –1.60 V vs. Ag | AgCl | 3 M KCl electrode for 120 seconds to remove air-formed oxide from the surface.
The electrochemical measurements were performed at room temperature in a standard three electrode cell. The counter electrode was a platinum electrode and the reference electrode, to which all potentials in the paper are referred, was an Ag | AgCl | 3 M KCl.
The electrolyte was a simulated acid rain solution. Chemical composition of the simulated acid rain [19] is given in Table 1. The pH value of solution was 4.5 and electrical conductivity 1.306 mS cm─1. pH value was adjusted by the addition of the appropriate amount of 0.5 mol L─1 H2SO4. All
chemicals were of p.a. purity and obtained from Sigma Aldrich.
Table 1. Chemical composition of the simulated acid rain solution (g L–1).
NH4NO3 MgSO4 ∙ 7H2O Na2SO4 KHCO3 CaCl2 ∙ 2H2O
0.13 0.31 0.25 0.13 0.31
Electrochemical techniques, cyclic voltammetry and electrochemical impedance spectroscopy were performed with an Autolab PGSTAT320N controlled by a personal computer using Nova 1.5 software. CV measurements were carried out in the potential range between –1.60 V and –0.20 V, with scan rates from 10 to 100 mV s–1.
EIS measurements were carried out in the frequency range between 10 kHz and 5 mHz with the ac amplitude ±10 mV at constant potential. EIS measurements were performed at the open circuit potential, EOCP (–0.485 V) and on E = –0.850 V for both, aluminium and 8090 Al- Li-Cu-Mg alloy.
Prior to each measurement the electrodes were stabilized for 30 min at the selected potentials. This procedure gave good reproducibility of results.
The concentrations of the Al ions released into simulated acid rain solution after 60 minutes of specimens’ immersion at open circuit potentials were obtained by atomic absorption spectrometry. Since the EIS measurements lasted approx. 60 minutes, the concentration of released ions was determined after this period of time.
3. RESULTS AND DISCUSSION
3.1. Cyclic voltammetry
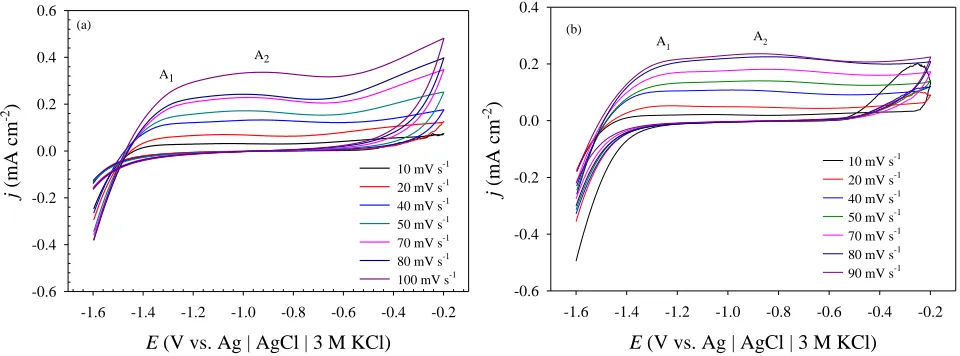
scan rate. The first oxidation peak, A1, at around –1.40 V, is related to the initial phase of oxide growth
[1]. In this phase mobile Al ions accumulate at the interface metal/solution but because of small amount of ions electric field strength is insufficient to move them. The second anodic peak A2, at
around –0.90V can be ascribed to the formation of a Al(III) oxide. At potentials more positive than – 0.90 V, current profile reaches a steady-state value (jpl) that remains constant up to –0.30 V. This is a
passive region where oxide film is thickening with increasing anodic potential [1, 7, 20]. Similar potentiodynamic E–j profiles were also obtained for Al-Li-Cu-Mg alloy in the same solution (Fig. 1b.).
During the cathodic sweep there is no presence of cathodic reduction of alumina film formed during the anodic sweep. Cyclic voltammograms obtained indicate that the formation of oxide films on the surfaces of Al and Al-Li-Cu-Mg alloy is a typical irreversible process [1, 7, 20]. At low scan rates (≤10 mV s-1) the Al-Li-Cu-Mg alloy undergoes pitting corrosion at potential higher than -0.5 V. Aluminium–lithium alloys are susceptible to pitting corrosion [21].
E (V vs. Ag | AgCl | 3 M KCl)
-1.6 -1.4 -1.2 -1.0 -0.8 -0.6 -0.4 -0.2
j (mA c m -2 ) -0.6 -0.4 -0.2 0.0 0.2 0.4 0.6
10 mV s-1
20 mV s-1
40 mV s-1
50 mV s-1
70 mV s-1
80 mV s-1
100 mV s-1
A1
A2
(a)
E (V vs. Ag | AgCl | 3 M KCl)
-1.6 -1.4 -1.2 -1.0 -0.8 -0.6 -0.4 -0.2
j (m A c m -2 ) -0.6 -0.4 -0.2 0.0 0.2 0.4
10 mV s-1
20 mV s-1
40 mV s-1
50 mV s-1
70 mV s-1
80 mV s-1
90 mV s-1
A1 A2
[image:4.596.58.538.306.484.2](b)
Figure 1. The cyclic voltammograms of (a) Al and (b) 8090 Al-Li-Cu-Mg alloy recorded in simulated acid rain with increasing scan rates.
(mV s-1)
0 10 20 30 40 50 60 70
jp (m A cm -2 ) 0.00 0.04 0.08 0.12 0.16 0.20 0.24 Al Al-Li-Cu-Mg (a) 9914 . 0 10 31 . 6 10 95 .
3 3 3 2
R x y 9989 . 0 10 01 . 9 97 .
2 3 2
R x
y
log ( , mV s-1)
1.0 1.2 1.4 1.6 1.8
log ( jp, m A cm -2) -1.8 -1.6 -1.4 -1.2 -1.0 -0.8 -0.6 -0.4 Al Al-Li-Cu-Mg
(b) y1.14x2.63 R20.9877
9986 . 0 81 . 2 15 .
1 2
x R y
Figure 2. (a) Values of the peak current densities (jp) as a function of scan rate, and (b) values of the
logarithm of peak current densities (log jp) as a function of logarithm of scan rate (log ) for
[image:4.596.76.523.542.704.2]
Analysis of the influence of scan rate, on the current density, jp of anodic peak A2 showed
that current density of anodic peak A2 increases linearly with the scan rate and potential of peak A2
shifts to more positive values.Changes in scan rate had no influence on the value of cathodic current density i.e. the cathodic current density was independent of the scan rate [1].
Linear dependences of peak current densities, jp on the scan rate, (Fig. 2a)and of log jp on the
log with the slope ≈ 1 (Fig. 2b)are obtained for peak A2 for both materials, Al and Al-Li-Cu-Mg
alloy. The obtained linear relationship indicates kinetic control of the oxidation process of Al in Al2O3,
with charge transfer being the slow step of the reaction [20].
3.2. Formation and growth of the anodic film
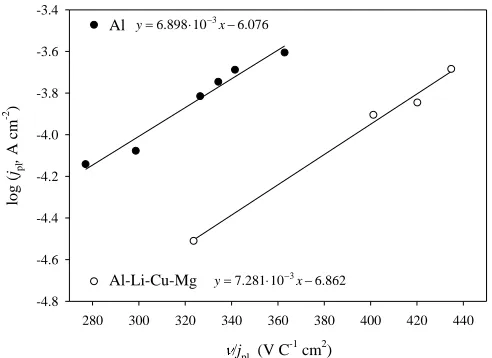
The steady state values of current density, in the potential range from –0.8 to –0.3 V indicate steady state film growth in the passive region. Obtained linear dependence between logjpl and values
of (/jpl) (Fig. 3) indicates that growth of the oxide film on the Al and Al-Li-Cu-Mg alloy takes place
due to the ionic conductivity under the high electric field within the oxide film described by [22–25]:
BA
jpl exp (1)
where jpl is the ionic current density for oxide growth, is the electric field within the oxide,
and A and B are temperature-dependent parameters of the oxide. For the potentiodynamic oxide growth, provided that the potential drop at the interfaces is negligible and in the absence of space charge effects, the following expression for the steady-state current density (jpl) is valid[23, 25]:
m
pl
pl log /2.3 /
logj A z F B V ν j (2)
where Vm is the molar volume of the growing phase and is the scan rate.
Under the assumption that on both, Al and Al-Li-Cu-Mg alloy the oxide layer is mostly composed of Al2O3 (M = 102 g mol–1 and = 3.2 g cm–3; Vm = 31.88 cm3 mol–1) [1, 26, 27], the kinetic
parameters A and B were determined from intercept and slope of the linear dependence log jpl vs. (
/jpl) and shown in Table 2. Obtained values are in an agreement with reported values [1]. The product
of A and B represents the ionic conductivity of the oxide layer during growth. Values are also shown in Tab. 2.
The values of half jump distance for aluminium ions, a were calculated according to the theory of high field ion transport [1, 28, 29]:
RT zF * a
B (3)
where z is the valency of the moving ion, F is the Faraday constant, R is the gas constant and T is the temperature and presented in Tab. 2. The values of electric field strength were calculated according to the equation (1) using values of jpl (Fig. 1, Tab. 2) and also presented in Tab. 2. The
/jpl (V C-1 cm2)
280 300 320 340 360 380 400 420 440
log
(
jpl
,
A c
m
-2 )
-4.8 -4.6 -4.4 -4.2 -4.0 -3.8 -3.6 -3.4
076 . 6 10 898 .
6 3
x
y
862 . 6 10 281 .
7 3
x
y
Al
[image:6.596.174.420.75.254.2]Al-Li-Cu-Mg
Figure 3. The dependence of log jpl vs. /jpl for the anodic growth of Al2O3 on the Al and
Al-Li-Cu-Mg alloy in simulated acid rain solution.
Table 2. The kinetic parameters for the oxide film growth on the Al and 8090 Al-Li-Cu-Mg alloy in simulated acid rain solution.
material jpl / mA cm-2 A /A cm-2 B / cm V-1 AB / S cm-1 / V cm-1 a* / nm
Al 0.032 8.3910-7 1.765 10-6 1.48 10-12 2.06106 0.151 8090
Al-Li-Cu-Mg 0.030 1.3810
-7
1.8410-6 2.54 10-13 2.94106 0.157
The total charge used for film formation, QA has been determined by integration of the area
under the curve in the obtained anodic part of cyclic voltammograms from Fig. 1 and shown in Table 3. Under assumption that the surface layer on the Al and Al-Li-Cu-Mg alloy is mostly composed of Al2O3 oxide [1, 26, 27], its thickness, d was calculated from the determined charge, QA:
σ Q F z ρ
M
d A
(5)
where M is the molar mass of Al2O3, is density of Al2O3, z is the number of electrons, F is the
Faraday constant and is the roughness factor of the surface ( = 2). The calculated thickness values are shown in Table 3. The calculated thickness value is in good agreement with the literature [1, 30].
Table 3. Anodic charges and thickness of the oxide film on the Al and Al-Li-Cu-Mg alloy in acid rain solution.
material QA / mC cm-2 d / nm
Al 8.067 2.21
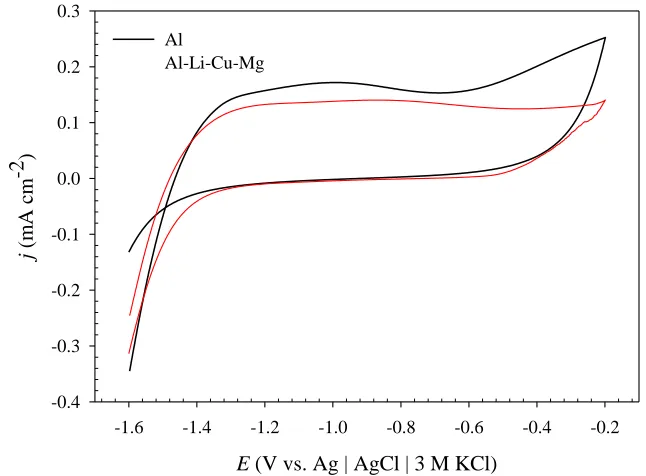
Comparison of electrochemical behaviour of Al and Al-Li-Cu-Mg alloy recorded by CV reveals that the oxide film on Al-Li-Cu-Mg alloy shows better properties than those on pure Al. Under same experimental condition currents densities for Al are higher than for Al-Li-Cu-Mg alloy and the width of the passive range is broader for Al-Li-Cu-Mg alloy (Fig. 4). Lower value of film thickness for Al-Li-Cu-Mg alloy (Table 3) also indicates better protective properties. However, at lower scan rates the Al-Li-Cu-Mg alloy undergoes pitting corrosion (Fig 1).
E (V vs. Ag | AgCl | 3 M KCl)
-1.6 -1.4 -1.2 -1.0 -0.8 -0.6 -0.4 -0.2
j
(m
A c
m
-2 )
-0.4 -0.3 -0.2 -0.1 0.0 0.1 0.2 0.3
Al
Al-Li-Cu-Mg
Figure 4. The cyclic voltammograms of the aluminium and 8090 Al-Li-Cu-Mg alloy recorded in simulated acid rain solution. Scan rate, = 50 mV s–1.
3.3. Electrochemical impedance spectroscopy
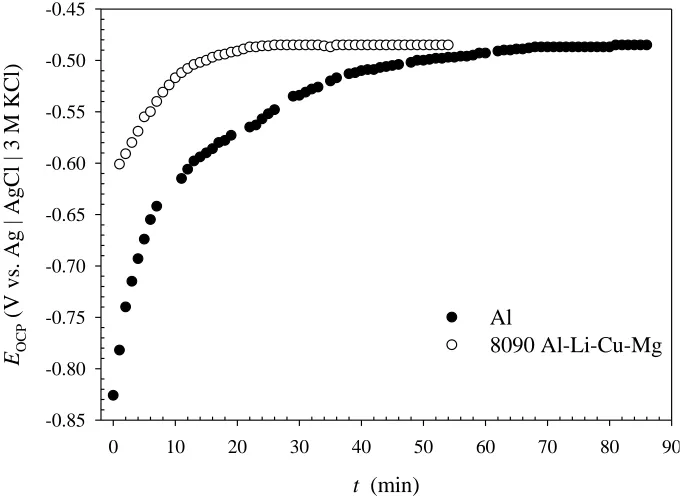
Figure 5 shows the variation of EOCP of Al and Al–Li-Cu-Mg samples with time in the
simulated acid rain solution. As can be seen, the Al–Li-Cu-Mg alloy reaches a stable value of EOCP ≈
−0.485 V, after 20 min., while pure Al achieves a stable value of EOCP ≈ −0.485 V after 1 h.
In order to determine the characteristics and electrical properties of the oxide layer, impedance measurements were performed at open circuit potential and during the anodic polarization, E = –0.850 V.
The electrochemical properties of the oxide film formed on the Al and Al-Li-Cu-Mg alloy in simulated acid rain at the open circuit potential, EOCP = –0.485 V were investigated using EIS. The
[image:7.596.154.477.196.434.2]
t (min)
0 10 20 30 40 50 60 70 80 90
E OCP
(V vs
.
Ag |
AgC
l |
3
M
KC
l)
-0.85 -0.80 -0.75 -0.70 -0.65 -0.60 -0.55 -0.50 -0.45
Al
[image:8.596.130.470.77.325.2]8090 Al-Li-Cu-Mg
Figure 5. Open circuit potential, EOCP vs. time for Al and Al-Li-Cu-Mg alloy in the simulated acid rain
solution.
The impedance spectra for the Al and the Al-Li-Cu-Mg alloy obtained at their open circuit potentials (–0.485 V) are presented in Fig. 6 in the form of Nyquist plots. At this potential, the barrier oxide impedance dominates the total impedance and only one time constant can be observed on Nyquist plots. The responses of the systems were semicircles which is associated with the thickness and dielectric properties of oxide film. The ohmic resistance (R), visible in the high-frequency region, was 50 cm2. The impedance data obtained were analyzed in terms of EEC shown in the detail of Fig. 6. It consists of a CPE in the parallel to the resistor R. For fitting the spectra a constant phase element (CPE) was used instead of an ideal capacitance element to compensate surface heterogeneities [34, 35]. Its impedance may be defined:ZCPE(
)
Q(j
)n
1, where Q is a constant, ω is the angular frequency and n is the CPE power with values between 0.5 and 1 [36]. When n = 1, the CPE describes an ideal capacitor with Q equal to the capacitance (C). For 0.5 < n < 1, the CPE describes a distribution of dielectric relaxation times in frequency space, and when n = 0.5 the CPE represents a Warburg impedance[37]. The oxide film on Al and Al-Li-Cu-Mg alloy is considered to be the parallel circuit of a resistor due to ionic conduction and a capacitance due to the dielectric properties of the oxide [1]. For the both electrodes, the value of n1 points that the constant phase element Q1 is essentially a doublelayer capacitance, Cdl. The charge transfer resistance corresponds to R1. Its numerical value indicates
Zreal (k cm2)
0 20 40 60 80 100 120 140
-Zim
ag
(k
c
m
2 )
0 20 40 60 80 100
120 Al
8090 Al-Li-Cu-Mg
[image:9.596.150.443.75.297.2]Figure 6. Nyquist plot representation of EIS data of theAl and Al-Li-Cu-Mg alloy passivated at the open circuit potential, −0.485 V. Inset: the electrical equivalent circuit used to fit the EIS data.
Table 4. The numerical values of impedance parameters for Al and Al-Li-Cu-Mg alloy in simulated acid rain at EOCP = −0.485 V.
material Q110
6
/
-1
sn cm-2 n1
R /
k cm2
Al 11.52 0.875 119.95
8090 Al-Li-Cu-Mg 6.108 0.955 144.65
The total impedance for impedance spectra recorded at open circuit potential is given by:
1Ω tot
n
j RQ
R R
Z
(6)
The values of R1 obtained were very high, indicating that the oxide films formed spontaneously
at the open circuit potential are very resistive and relatively compact.
Comparing the obtained data (Table 4), it can been seen that aluminium and 8090 Al-Li-Cu-Mg alloy show similar corrosion behaviour in simulated acid rain solution at open circuit potential although the resistance of aluminium is somewhat reduced and capacitance increased in the comparison to the 8090 Al-Li-Cu-Mg alloy.
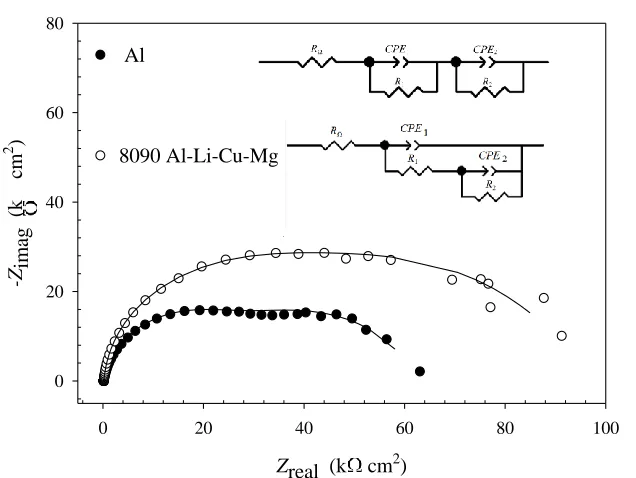
Impedance spectra obtained at –0.850 V on aluminium and 8090 Al-Li-Cu-Mg alloy are presented in Figure 7 in the form of a Nyquist plots. From the Nyquist plots it is obvious that two time constant can be identified. The impedance data obtained were analyzed in terms of EEC shown in the detail of Fig. 7. The impedance spectra for aluminium may be described by R(R1Q1)(R2Q2) equivalent
[image:9.596.66.530.415.504.2]
barrier oxide layer and R1 the resistance to ion migration through the barrier oxide layer. The low
frequency time constant can be related to the properties of the barrier oxide layer/solution interface. R2
may describe the charge transfer resistance across the interface [38].
Zreal (k cm2)
0 20 40 60 80 100
[image:10.596.140.458.139.378.2]-Zim ag (k c m 2 ) 0 20 40 60 80 Al 8090 Al-Li-Cu-Mg
Figure 7. Nyquist plot representation of EIS data of theAl and Al-Li-Cu-Mg alloy passivated at the E = −0.850 V. Inset: the electrical equivalent circuits used to fit the EIS data.
Table 5. The numerical values of impedance parameters for Al and Al-Li-Cu-Mg alloy in simulated acid rain at E = −0.850 V.
material Q110
6
/
-1
sn cm-2 n1
R 1/
k cm2
Q2106 /
-1
sn cm-2
n2
R 2/
k cm2
Al 16.121 0.946 23.723 86.522 0.774 38.421
8090
Al-Li-Cu-Mg 8.125 0.973 50.777 57.841 0.802 37.723
It can be seen from Table 5 that the 8090 Al-Li-Cu-Mg alloy has higher resistance values and more compact barrier layer than pure aluminium in simulated acid rain solution at E = −0.850 V.
The total impedance Z for the investigated system at E = –0.850 V is given by:
1 1
2 12 2 2 1 1 1 Ω tot n n j Q R R j Q R R R Z
(7)
and for Al-Li-Cu-Mg alloy at same potential is given by:
1 1 2 2 2 1 n 1 tot 1 2 1 n j Q R R R jω Q R Z [image:10.596.65.532.467.572.2]
3.4. Atomic absorption spectrometry
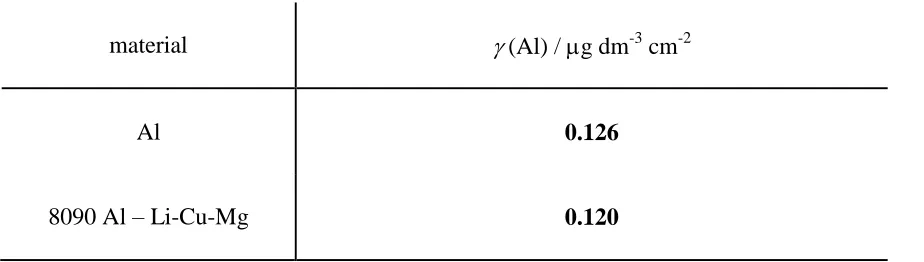
[image:11.596.76.538.234.365.2]The results obtained in the static immersion test are listed in Table 6. As can be seen from Table 6, a slightly higher quantity of Al was released from the pure aluminium than from the Al-Li-Cu-Mg alloy. These results are in good agreement with the corresponding resistances obtained by electrochemical techniques.
Table 6. The quantities of Al ions dissolved during 1 hour-immersion of aluminium and 8090 Al-Li-Cu-Mg specimens in simulated acid rain at open circuit potential.
material (Al) / g dm-3 cm-2
Al 0.126
8090 Al – Li-Cu-Mg 0.120
From the results of AAS it is obvious that corrosion of aluminium and Al-Li-Cu-Mg alloy under acid rain conditions increases the concentration of metals in the environment.
4. CONCLUSION
Cyclic voltammetry and electrochemical impedance spectroscopy were used to study passivation and corrosion behaviours of the Al and Al-Li-Cu-Mg alloy in a simulated acid rain solution with a pH of 4.5. The growth of the anodic oxide film on the Al and Al-Li-Cu-Mg alloy, under potentiodynamic conditions, occurs under a high -field migration mechanism. Values of electric field strength, parameters A and B characterising the anodic growth, ionic conductivity through the film and half jump distance were determined.
Cyclic voltammetry revealed that Al-Li-Cu-Mg alloy shows better electrochemical properties than pure Al. Thickness of oxide films obtained by analyzing the anodic current curves show that film with better protection properties forms on Al-Li-Cu-Mg alloy (1.70 nm) than on pure Al (2.20 nm).
At the open circuit potential, both pure metal and alloy underwent passivation, indicating that the oxide films formed spontaneously at the open circuit potential are very resistant (144 k cm2 for Al-Li-Cu-Mg alloy and 119 kcm2 for Al). In case of 8090 Al-Li-Cu-Mg alloy obtained charge transfer resistance value is higher and double layer capacitance is reduced in comparison to pure aluminium.
References
1. D. Hasenay and M. Šeruga, J. Appl. Electrochem., 37 (2007) 1001. 2. G. E. Thompson, Thin Solid Films, 297 (1997) 192.
3. M. M. Lohrengel, Mater. Sci. Eng., R11 (1993) 243.
4. A. Despić and V.P. Parkhutik in: J. O. Bockris, R. E. White and B. E. Conway (Eds) Modern aspects of electrochemistry, vol 20, Plenum Press, (1989) New York, USA.
5. J. Bessone, C. Mayer, K. Juttner and W. J. Lorenz, Electrochim. Acta, 28 (1983) 171. 6. S. Gudić, J. Radošević and M. Kliškić, J. Appl. Electrochem., 26 (1996) 1027.
7. S. Gudić, J. Radošević, D. Krpan-Lisica and M. Kliškić, Electrochim. Acta, 46 (2001) 2515. 8. S. S. Abdel Rehim, H. H. Hassan and M. A. Amin, J. Appl. Electrochem., 32 (2002) 1257. 9. N. M. Yakovleva, L. Anicai, A. N. Yakovlev, L. Dima, E. Y. Khanina and E. A. Chupakhina,
Inorg. Mater., 39 (2003) 58.
10. M. Metikoš-Huković and R. Babić, J. Appl. Electrochem., 28 (1998) 433.
11. H. Gerengi, G. Bereket and M. Kurtay, J. Taiwan. Inst. Chem. Eng., 58 (2016) 509. 12. H. Gerengi, P. Slepski, E. Ozgan and M. Kurtay, Mater. Corros., 66 (2015) 233.
13. K. S. Ghosh, S. Mukhopadhyay, B. Konar and B. Mishra, Mater. Corros., 64 (2013) 890.
14. J. R. Davis, ASM Specialty Handbook, Aluminum and Aluminum Alloys, ASM International, The Materials Information Society, (1998) Ohio, USA.
15. P. J. Gregson and H. M. Flower, in: T. Sheppard (Ed.), Proc. Int. Conf. on Aluminum Technology’86, The Institute of Metals, London, United Kingdom, 1986, 423.
16. E. J. Lavernia, T. S. Srivatsan and F. A. Mohamed, J. Mater. Sci., 25 (1990) 1137.
17. R. E. Ricker and D. J. Duquette in: C. Baker, P. J. Gregson, S. J. Harris and C. J. Peel (Eds), Aluminum Lithium III, Proc. 3rd Int. Conf. on Aluminum Lithium Alloys, The Institute of Metals, London, United Kingdom, 1986, 581.
18. H. F. De Jong and J. H. M. Martens, Aluminum, 61(1985) 416.
19. G. Seufert, V. Hoyer, H. Wollmer and U. Arndt, Environ. Pollut., 68 (1990) 205. 20. Z.Pilić and I. Martinović,Int. J. Mater. Res., 107 (2016) 925.
21. P. L. Lane, J. A. Gray, C. J. E. Smith, in: C. Baker, P. J. Gregson, S. J. Harris, C. J. Peel (Eds.), Proc. 3rd Int. Conf. On Aluminum Lithium Alloys, The Institute of Metals, London, United Kingdom, 1986, 273.
22. M. J. Dignam, in: J. O’M. Bockris, B. E. Conway, E. Yeager, R. E. White (Eds.), Comprehensive Treatise of Electrochemistry, Vol. 4., Plenum Pub. Corp., (1981) New York, USA.
23. E. M. Patrito, R. M. Torresi, E. P. M. Leiva and V. A. Macagno, J. Electrochem. Soc., 137 (1990) 524.
24. V. Brunetti and M. Lopez Teijelo, J. Electroanal. Chem., 613 (2008) 16.
25. O. E. Linarez Pérez, M. A. Pérez and M. López Teijelo, J. Electroanal. Chem., 632 (2009) 64. 26. A. Conde, M. A. Arenas, A. de Frutos and J. de Damborenea, Electrochim. Acta, 53 (2008) 7760. 27. A. Conde and J. de Damborenea, Electrochim. Acta., 43 (1998) 849.
28. T. P. Moffat and R. H. Latanision, J. Electrochem. Soc., 139 (1992) 1869. 29. S. Omanović and M. Metikoš-Huković, Solid State Ionics, 78 (1995) 69.
30. C. J. Boxley, J. J Watkins and H. S. White, Electrochem. Solid-State Lett., 6 (10) (2003) B38. 31. A. Güntherschulze and H. Betz, Z. Phys., 71 (1931) 106.
32. Z. Szklarska – Smialowska, Corros. Sci., 41 (1999) 1743.
33. A. A. Girginov, A. S. Zahariev and M. S. Machkova, Mater. Chem. Phys., 76 (2002) 274.
34. J. R. Macdonald, Impedance spectroscopy, emphasizing solid materials and systems, Wiley, (1987) New York, USA.
35. E. M. A. Martini and I. L. Muller, Corros. Sci., 42 (2000) 443. 36. U. Rammelt and G. Reinhard, Electrochim. Acta, 35 (1990) 1045.
38. B. Benfedda, L. Hamadou, N. Benbrahim, A. Kadri, E. Chainet and F. Charlotc, J. Electrochem. Soc., 159(8) (2012) C372.