Int. J. Electrochem. Sci., 14 (2019) 6948 – 6975, doi: 10.20964/2019.07.64
International Journal of
ELECTROCHEMICAL
SCIENCE
www.electrochemsci.org
A Study on the Water Splitting using Polymer Electrolyte
Membrane for producing Hydrogen and Oxygen
Chang-Hoon Je, Hyung-Man Kim*
Department of Electronic Telecommunication, Mechanical & Automotive Engineering and High Safety Vehicle Core Technology Research Center, INJE University, 197 Inje-ro, Gimhae-si, Gyeongsangnam-do 50834, Republic of Korea
*E-mail: [email protected]
Received: 4March 2019 / Accepted: 10 May 2019 / Published: 10June 2019
Hydrogen is expected to be the clean and sustainable fuel as well as the most promising energy carrier. Water splitting using polymer electrolyte membrane have studied numerically and experimentally for producing hydrogen and oxygen by electrolysis in conjunction with intermittent renewable energies. In this study, a control-oriented model for polymer electrolyte membrane electrolyzer are developed to calculate mole balance and electrochemical reaction between at the anode and at the cathode. Numerical simulations are performed using MATLAB® and Simulink® software packages. The electrolyzer test station equipped with flow, temperature and power controllers are manufactured to evaluate the flow and temperature characteristics of circulating water, the uniformity of the pressure over the cell area, then enhance the performance of polymer electrolyte membrane electrolyzer. DC power supply can simulate experimentally the power of renewable energies. The numerical and experimental results are capable of characterizing the flow and temperature characteristics of circulating water and enhancing the performance of polymer electrolyte membrane electrolyzer, then developing the highly efficient control strategy. This polymer electrolyte membrane electrolyzer will be combined with polymer electrolyte membrane fuel cell to establish a regenerative fuel cell with the integrated control system.
Keywords: water splitting; hydrogen; polymer electrolyte membrane electrolyzer; electrochemical reaction; regenerative fuel cell
1. INTRODUCTION
because there is pollution of carbon dioxide (CO2) emitted by burning fossil fuels [2]. Hydrogen is the clean and sustainable in the energy field and use as an energy carrier as well as an energy storage system that harmonizes the fluctuating nature of renewable energies [3].
Regardless of which future energy resources can be developed, the convenient, clean, safe, efficient and flexible energy carriers are necessary for the energy requirements for delivery to the end users. Energy carriers are energy forms which have been transformed from primary energy sources. Electricity is a convenient form of energy and many advantages to generate cleanly from various energy sources and easy to transport and deliver to the final users, on the other hand, the production of the energy carrier from fossil resources cannot certainly be both clean and sustainable. Hydrogen is also a clean, sustainable, efficient and flexible energy carrier and easily compensates the electricity. The two energy carriers of the electricity and the hydrogen can satisfy all energy requirements in the future which can construct the individual and independent energy systems [4,5].
Hydrogen production can have diverse technologies such as reforming of hydrocarbons, the gasification of coal and biomass, the electrolysis of water using nuclear and fossil or renewable energy sources, photocatalytic splitting of water and etc. [6-9]. Among hydrogen production technologies, the water electrolysis connected with renewable energy sources produces hydrogen and oxygen cleanly because of the highly efficient and pure production of hydrogen and oxygen [10-15].
Polymer electrolyte membrane (PEM) electrolyzer are considered the most promising technologies for hydrogen generation connected with renewable sources. The PEM electrolyzers have many advantages of simple structure, both efficient and sustainable operation and its ability to operate at high current densities among the different types of electrolyzers. The PEM electrolyzers retain highly pure, efficient and sustainable operation at high current density levels. Electrolysis is the decomposition of water into hydrogen and oxygen gas because of the passage of an electric current and the reaction has a standard potential of −1.23 V, meaning it ideally requires a potential difference of 1.23 volts to split water. In the PEM electrolyzer experiment, direct current (DC) voltage is supplied from renewable energies. The PEM electrolyzer utilizes a solid polymer electrolyte (SPE) to conduct protons from the anode to the cathode while insulating the electrodes electrically. The PEM electrolyzer operate with a very thin membrane while still allowing high pressures, resulting in low ohmic losses, primarily caused by the conduction of hydrogen protons (H+) across the membrane and recombination at the cathode with the returning electrons (e-) and forms hydrogen. The oxidation and reduction reactions taking place on the anode and the cathode side of PEM electrolyzer is commonly referred to as the oxygen evolution reaction (OER) and the hydrogen evolution reaction (HER), respectively. At the anode, the liquid water reactant is supplied to catalyst where the supplied water is oxidized to O2, H+ and e-. At the cathode, the supplied electrons and the protons that have conducted through the membrane are combined to create gaseous H2 [16].
Hydrogen generation through water electrolysis from renewable energy is more environmentally friendly, but it is not yet a cost-effective method compared to other technologies. The milestone report of National Renewable Energy Laboratory (NREL) in USA suggests that 80% of total hydrogen from large scale electrolyzers is electricity cost. Therefore, improvement in the electrical energy efficiency of the electrolyzers is a matter of prime importance [17-19].
suitable for dynamic simulation and analyze its dynamic behaviors in full. A new control-oriented model for PEM electrolyzer calculates mole balance and electrochemical reaction between at subsystems the anode and at the cathode. The model can optimize the PEM electrolyzer and determine the control strategy that can assure highly efficient, reliable and durable operation of the PEM electrolyzer system. The flow and temperature characteristics of circulating water are evaluated in order to optimize design and operation of PEM electrolyzer in the channel during gas production at the macro-scale. The effect of the flow and temperature characteristics on the cell performance was investigated experimentally, then the optimal flow rate and temperature of the circulating water are evaluated based on mass balance analysis. The numerical and experimental results are used to optimize PEM electrolyzer and to determine the control strategy.
PEM electrolyzer of hydrogen generation developed in this study will combine with PEM fuel cell of electricity production to establish a regenerative fuel cell (RFC) with integrated control system using intermittent electric power from renewable energies.
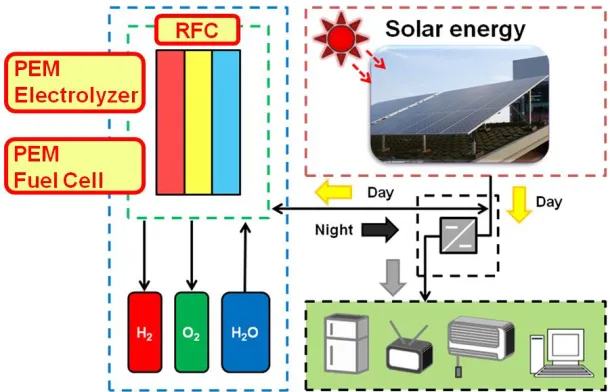
Figure 1. Schematic diagram of regenerative fuel cell operation with both PEM electrolyzer and PEM fuel cell.
[image:3.596.131.466.304.491.2] [image:3.596.146.451.538.734.2]
As shown in Fig. 1, the RFC is composed of PEM electrolyzer which produces hydrogen and oxygen from renewables and water and PEM fuel cell which utilizes hydrogen and oxygen, produces and supplies electricity to industrial or residential load in the form of distributed power generation. If photovoltaic systems remains matching the sun dependent power supply with the time dependent power demand of the residence. More specifically, the RFC as an energy storage system be used in conjunction with the solar photovoltaic system, as shown in Fig. 2. During daytime, photovoltaic system supplies electricity sufficiently to meet the residential load and next to operate the electrolyzer mode of RFC. The PEM electrolyzer in RFC takes in electricity and water to produce and store hydrogen and oxygen. During nighttime, without solar energy, the PEM fuel cell in RFC takes in stored hydrogen and oxygen to produce and supply electricity to the residence.
2. NUMERICAL ANALYSIS
2.1. PEM Electrolyzer Modeling
When water is supplied to the anode reaction interface, the oxidation reaction (1), that is, the OER takes place on the anode side of the PEM electrolyzer. Here the liquid water (H2O) reactant is supplied to catalyst where the supplied water is oxidized to oxygen gas (O2), protons and electrons. The reduction reaction (2), that is, the HER takes place on the cathode side of a PEM electrolyzer. Here the supplied electrons and the protons that have conducted through the membrane are combined to create gaseous hydrogen gas (H2). Combining either half reaction pair, that is, the overall reaction (3) yields the same overall decomposition of water into oxygen and hydrogen. The number of hydrogen molecules produced is thus twice the number of oxygen molecules. Assuming equal temperature and pressure for both gases, the produced hydrogen gas has therefore twice the volume of the produced oxygen gas. The number of electrons pushed through the water is twice the number of generated hydrogen molecules and four times the number of generated oxygen molecules. The open circuit voltage of an operating PEM electrolyzer is a potential difference of 1.23 volts to split water, as in Eqs. (3) and (4). The actual value for open circuit voltage can vary because the operation of PEM electrolyzer experiences other voltage losses from internal electrical resistances, proton conductivity and mass transport through the cell and catalyst utilization.
Oxidation at the anode: 2H2O(l) → O2(g) + 4H+(aq) + 4e− (1)
Reduction at the cathode: 4H+(aq) + 4e− → 2H2(g) (2)
Overall reaction: 2H2O(l) + 237.2 kJ/mol → 2H2(g) + O2(g) (3)
Open circuit voltage: 𝑉OCV0 =∆𝐺0
𝑛∙𝐹 =
237.2 kJ/mol
2×96,485 C/mol= 1.23 V (4)
where aq, n, F are aqueous solution, the number of electrons and Faraday’s constant. In pursuance of these reactions, multi-physics phenomena occur simultaneously, such as thermochemical, fluidic, thermal and electrical phenomena. As the involved mechanisms are covering different physical disciplines, they need to be properly decoupled with the balance of plant (BoP) which is composed of various submodels.
2.1.1. Anode Submodel
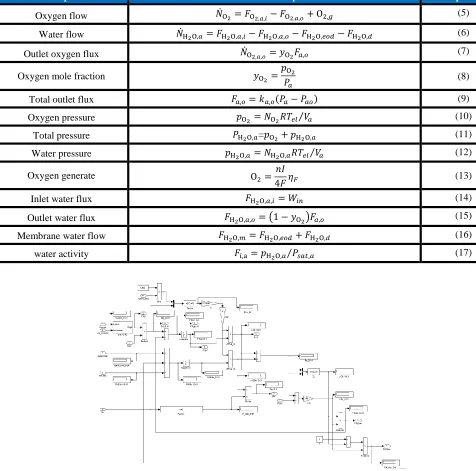
Electron transfer occurs when an electron relocates from a molecule to another such chemical entity such as hydrogen protons. Electron transfer is a mechanistic description of HER and OER occurred at the anode and the cathode of PEM electrolyzer, respectively. The constitutive equations for simulating anode submodel are described in Table 1 and the Simulink diagram for simulating anode submodel is shown in Fig. 3.
Table 1. Constitutive equations for modeling anode submodel [16,26].
Description Mathematical expression Eqation
Oxygen flow 𝑁̇O2 = 𝐹O2,𝑎,𝑖− 𝐹O2,𝑎,𝑜+ O2,𝑔 (5)
Water flow 𝑁̇H2O,𝑎= 𝐹H2O,𝑎,𝑖− 𝐹H2O,𝑎,𝑜− 𝐹H2O,𝑒𝑜𝑑− 𝐹H2O,𝑑 (6)
Outlet oxygen flux 𝑁̇O2,𝑎,𝑜= 𝑦O2𝐹𝑎,𝑜 (7)
Oxygen mole fraction 𝑦O2=𝑝O2
𝑃𝑎
(8)
Total outlet flux 𝐹𝑎,𝑜= 𝑘𝑎,𝑜(𝑃𝑎− 𝑃𝑎𝑜) (9)
Oxygen pressure 𝑝O2 = 𝑁O2𝑅𝑇𝑒𝑙⁄𝑉𝑎 (10)
Total pressure 𝑃H2O,𝑎=𝑝O2+ 𝑝H2O,𝑎 (11)
Water pressure 𝑝H2O,𝑎 = 𝑁H2O,𝑎𝑅𝑇𝑒𝑙⁄𝑉𝑎 (12)
Oxygen generate O2=
𝑛𝐼
4𝐹𝜂𝐹 (13)
Inlet water flux 𝐹H2O,𝑎,𝑖= 𝑊𝑖𝑛 (14)
Outlet water flux 𝐹H2O,𝑎,𝑜= (1 − 𝑦O2)𝐹𝑎,𝑜 (15)
Membrane water flow 𝐹H2O,𝑚= 𝐹H2O,𝑒𝑜𝑑+ 𝐹H2O,𝑑 (16)
water activity 𝐹𝑖,a= 𝑝H2O,𝑎⁄𝑃𝑠𝑎𝑡,𝑎 (17)
[image:6.596.48.524.252.723.2]
Faraday efficiency (𝜂𝐹), defined as the relation between the real hydrogen flow rate and the theoretical hydrogen flow rate, is caused by parasitic current losses, and for PEM electrolyzers it is in general assumed to be more than 99% [16,25-26].
2.1.2. Cathode Submodel
Table 2. Constitutive equations for modeling cathode submodel [16,26].
Description Mathematical expression Eqation
Hydrogen flow 𝑁̇H2= 𝐹H2,𝑐,𝑖− 𝐹H2,𝑐,𝑜+ H2,𝑔 (18)
Water flow 𝑁̇H2O,𝑐= 𝐹H2O,𝑐,𝑖− 𝐹H2O,𝑐,𝑜− 𝐹H2O,𝑒𝑜𝑑− 𝐹H2O,𝑑 (19)
Outlet hydrogen flux 𝑁̇H2,𝑐,𝑜= 𝑦H2𝐹𝑐,𝑜 (20)
Hydrogen mole fraction 𝑦
H2= 𝑝H2
𝑃𝑐
(21)
Total outlet flux 𝐹𝑐,𝑜= 𝑘𝑐,𝑜(𝑃𝑐− 𝑃𝑐𝑜) (22)
Hydrogen pressure 𝑝H2= 𝑁H2𝑅𝑇𝑒𝑙⁄𝑉𝑐 (23)
Total pressure 𝑃𝑎=𝑝H2+ 𝑝H2O,𝑐 (24)
Water pressure 𝑝H2O,𝑐= 𝑁H2O,𝑐𝑅𝑇𝑒𝑙⁄𝑉𝑐 (25)
Hydrogen generate H2,𝑔 =
𝑛𝐼
2𝐹𝜂𝐹 (26)
Inlet water flux 𝐹H2O,𝑐,𝑖= 0 (27)
Outlet water flux 𝐹H2O,𝑐,𝑜= (1 − 𝑦H2)𝐹𝑐,𝑜 (28)
Membrane water flow 𝐹H2O,𝑚 = 𝐹H2O,𝑒𝑜𝑑+ 𝐹H2O,𝑑 (29)
[image:7.596.49.556.209.704.2]water activity 𝐹𝑖,c= 𝑝H2O,𝑐⁄𝑃𝑠𝑎𝑡,𝑐 (30)
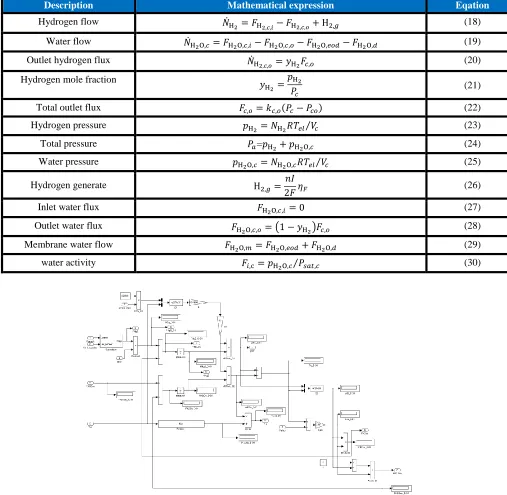
Figure 4. Simulink diagram of PEM electrolyzer cathode submodel.
for simulating cathode submodel are described in in equations of Table 2 and the Simulink diagram of cathode submodel is shown in Fig. 4.
2.1.3. Membrane Submodel
[image:8.596.56.566.287.739.2]Membrane submodel is indispensable to investigation into the water transport phenomena inside PEM electrolyzer. Two main water flows occur across the membrane as follows: proton (H+) migrates from the anode to the cathode side by the drag of water molecules, that is, electro-osmotic drag transport; the concentration gradient of water between the anode and cathode arouses back diffusion which prevent against drying of the membrane from the anode side.
Table 3. Constitutive equations for modeling membrane submodel [5,16].
Description Mathematical expression Eqation
Electro-osmotic drag 𝐹H2O,𝑒𝑜𝑑 = 𝑛𝑑
𝑖
𝐹𝑀H2O𝐴𝑛 (31)
Electro-osmotic drag
coefficient 𝑛𝑑 = 0.0029𝜆𝑚
2 + 0.05𝜆𝑚− 3.4 × 10⁻¹⁹, 0 < 𝑎𝑎≤ 1 (32)
Membrane water content λ = 0.43 + 17.81𝑎𝑎− 39.85𝑎𝑎 2+ 36𝑎
𝑎 3, 0 < 𝑎
𝑎≤ 1 λ = 14 + 1.4(𝑎𝑎− 1), 1 < 𝑎𝑎≤ 3
(33)
Water diffusion through the
membrane 𝐹H2O,𝑑= 𝐷𝑤
(𝐶𝑤,𝑐− 𝐶𝑤,𝑎) 𝑡𝑐𝑚
𝑀H2O𝐴𝑛 (34)
Water diffusion coefficient
𝐷𝑤= 𝐷𝜆exp [2416 ( 1 303−
1 𝑇𝑒𝑙
)]
𝐷𝜆 = 10−10, 𝜆𝑚< 2
𝐷𝜆= 10−10[1 + 2(𝜆𝑚− 2)], 2 ≤ 𝜆𝑚< 3 𝐷𝜆= 10−10[3 − 1.67(𝜆𝑚− 3)], 3 ≤ 𝜆𝑚< 4.5 𝐷𝜆= 1.25 × 10⁻¹⁰, 𝜆𝑚≤ 4.5
(35)
Water vapor concentration for the anode and the anode surface of the membrane
𝐶𝑤,𝑐 = 𝜌𝑚,𝑑𝑟𝑦 𝑀𝑚,𝑑𝑟𝑦
𝜆𝑐
𝐶𝑤,𝑎= 𝜌𝑚,𝑑𝑟𝑦 𝑀𝑚,𝑑𝑟𝑦
𝜆𝑎
(36)
Two main water flows depend on the hydration state of the membrane. The constitutive equations for simulating membrane submodel are described in equations of Table 3 and the Simulink diagram of membrane submodel is shown in Fig. 5.
2.1.4. Voltage Submodel
The operating mode depends on the operating conditions such as stack temperature, average current density, operating voltage, steam utilization and the inlet gas composition, as well as materials selection and cell and stack geometry.
Table 4. Constitutive equations for modeling voltage ancillary [16,28].
Description Mathematical expression Eqation
Electrolyzer voltage 𝑉𝑒𝑙 = 𝐸 + 𝑉𝑎𝑐𝑡+ 𝑉Ω (37)
Circuit voltage
(Nernst Equation) 𝐸 = 𝐸0+
𝑅𝑇𝑒𝑙 2𝐹 [ln (
𝑝H2𝑝O2 𝑝H2O
)] , 𝐸0=Δ𝐺𝑓
2𝐹 (38)
Activation polarrization 𝜂𝑎𝑐𝑡 = 𝑅𝑇
𝐹 𝑠𝑖𝑛ℎ −1( 𝑖
2𝑖0 ) =𝑅𝑇
𝐹 [ 𝑖 2𝑖0 √( 𝑖 2𝑖0 ) 2
+ 1] (39)
Water diffusion through the
membrane 𝑉Ω= 𝑖𝑅Ω, 𝑅Ω=
𝑡𝑚
𝜎𝑚 (40)
Conductivity 𝜎𝑚= (0.00514𝜆𝑚− 0.00326) exp [1268 ( 1 303−
1 𝑇𝑒𝑙
)] (41)
Figure 6. Simulink diagram of PEM electrolyzer voltage submodel.
[image:9.596.48.540.269.702.2]
performance of PEM electrolyzer in both cell voltage and endothermic operation mode. Current density is another influential factor, in both cell voltage and operation mode. The cell voltage of PEM Electrolyzer is the sum of the cell potential at open circuit voltage and three overpotentials composed of activation, ohmic and concentration polarization losses. The constitutive equations for simulating membrane submodel are described in Table 4 and the Simulink diagram of voltage submodel is shown in Fig. 6.
2.1.5. Storage Submodel
[image:10.596.59.543.343.667.2]The Produced H2 and O2 by PEM electrolyzer is stored in H2 and O2 bottles. Constant H2 flow fills up the bottle until its pressure reaches up the PEM electrolyzer cathode pressure. Constitutive equations for modeling storage submodel are described in Eq. 42 of Table 5 and the Simulink diagram of storage submodel is shown in Fig. 7.
Table 5. Constitutive equations for modeling storage submodel [16,25].
Description Mathematical expression Eqation
Storage pressure 𝑃𝑏− 𝑃𝑏,𝑖 = 𝑧
𝑁H2𝑅𝑇𝑏 𝑀H2𝑉𝑏
(42)
Figure 7. Simulink diagram of PEM electrolyzer storage submodel.
[image:10.596.188.439.381.668.2]
2.2. Numerical Results and Discussion
In this model, the influences of temperature and current density have been considered in the typical range of temperature (20-80℃) and current density (0-1.4 A/cm2) on PEM electrolysis. The polarization curve of PEM electrolyzer is very important factor in the model and has been modeled voltage as a variable which depends on the input current, the temperature of water and some constitutive internal variables. Fig. 8 shows schematic of PEM electrolyzer storage submodel.
Some important assumptions for PEM electrolyzer modeling are considered as follows: (1) pressure effects are neglected because of the coupling with intermittent and variable renewable sources, then high-pressure electrolyzers have no regard. High-pressure electrolyzers coupled with intermittent renewable sources not yet operate normally. The pressurized electrolyzers has many advantages to generate the compressed hydrogen directly into storage, to reduce energy consumption in the compression of H2 and O2 bottles; (2) PEM electrolyzer is assumed to be a uniform temperature distribution; (3) cell voltage is shown as function of input current density and can be produced from the active area of cells; (4) membrane is supposed to be fully hydrated and its conductivity depends on temperature.
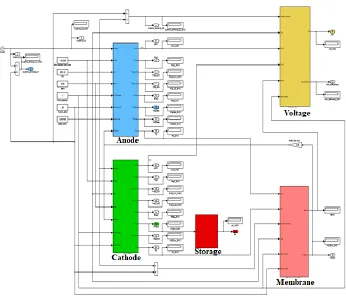
Figure 8. Simulink diagram of PEM electrolyzer system.
[image:11.596.123.469.365.662.2][image:12.596.48.566.209.726.2]
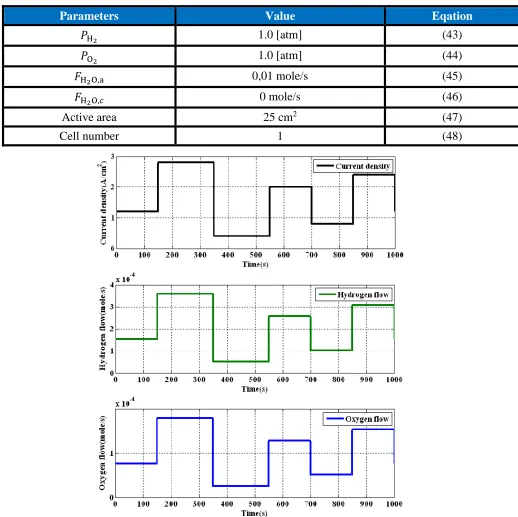
presented in Fig. 9. The operating current density increased stepwise from 1.2 to 2.8 A/cm2 at t =150 s, decreased stepwise from 2.8 to 0.4 A/cm2 at t = 350 s, increased stepwise from 0.4 to 2.0 A/cm2 at t = 550 s, decreased stepwise from 2.0 to 0.8 A/cm2 at t = 700 s, increased stepwise from 0.8 to 2.4 A/cm2 at t = 850 s, and returned to 1.2 A/cm2 at t = 1,000 s. The partial pressures of hydrogen and oxygen are synchronized with transient current density. The flow rate of hydrogen generation calculated in Eq. 26 of Table 2 can be confirmed to be double that of oxygen generation calculated in Eq. 13 of Table 1. Table 6. Parameters used in PEM electrolyzer modeling.
Parameters Value Eqation
𝑃H2 1.0 [atm] (43)
𝑃O2 1.0 [atm] (44)
𝐹H2O,a 0,01 mole/s (45)
𝐹H2O,𝑐 0 mole/s (46)
Active area 25 cm2 (47)
Cell number 1 (48)
Figure 10. History of hydrogen storage pressure with current density increase from 0 A/cm2 to 40 A/cm2 at t = 1,000 s.
Storage submodel shows storage dynamics of the generated hydrogen in a bottle by taking account the initial hydrogen level in it and compressibility of the hydrogen. When current density increases from 0 to 40 A/cm2 at t = 1,000 s, hydrogen storage pressure is calculated in Eq. 22 of Table 2 and the pressure of hydrogen bottle changes as shown in Fig. 10. PEM electrolyzer can operated below the safe pressure range of hydrogen bottle and if the pressure of hydrogen bottle reaches the safe pressure range, PEM electrolyzer and input current stop working.
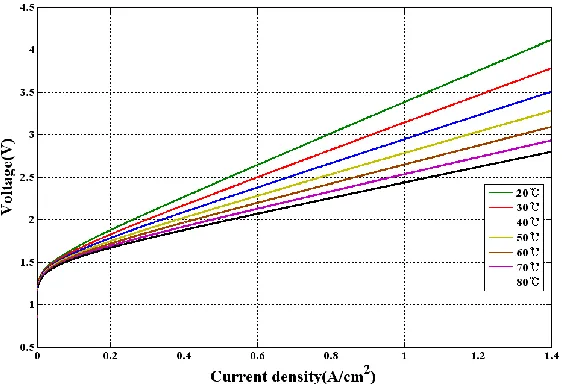
Figure 11. Effects of current density and water temperature on the voltage of PEM electrolyzer.
[image:13.596.172.422.78.282.2] [image:13.596.157.438.480.672.2]
analyzed and compare with numerical results. The 𝑖 − 𝑉 polarization curve of PEM electrolyzer is the most important performance from both numerical and experimental results. The polarization curve has been modelled on variable voltage as a function of the input current density (0-1.4 A/cm2) and the temperature of water (20-80℃) and some constitutive internal parameters given in Table 6. As given in Eq. 36 of Table 4, the applied voltage of PEM electrolyzer is a sum of the circuit voltage calculated in Nernst equation in Eq. 38 of Table 4, the activation polarization calculated in Eq. 38 of Table 4 and ohmic polarization calculated in Eq. 39 of Table 4. The 𝑖 − 𝑉 polarization curves of PEM electrolyzer at different water temperature are shown in Fig. 11. The applied voltage of PEM electrolyzer is an infinite value at which the current flow starts, 𝑖= 0 A/cm2, increases non-linearly almost up to 𝑖= 0.05 A/cm2, and then can be approximated as linear increase [27]. The slope of this linear curve represents the internal electrical resistance of a PEM electrolyzer cell and this approach has been applied and tested [28].
Figure 12. Simulink diagram of PEM electrolyzer mass balance analysis.
[image:14.596.133.460.268.413.2] [image:14.596.154.437.480.705.2]
Simulink diagram of PEM electrolyzer based on mass balance analysis for evaluating the optimal flow rate of the circulating water is added to the model, as shown in Fig. 12. However, if flow rate of hydrogen generation on molar basis exceed that of the introduced water, Simulink diagram of PEM electrolyzer based on mass balance analysis failed to calculate the optimal flow rate of the circulating water, as shown in Fig. 13. Therefore, evaluation for the flow characteristics of circulating water in the channel during gas production at the macro-scale can be used to optimize the design and operation of a PEM electrolyzer and investigate the effect of the flow characteristics on the cell performance experimentally.
3. EXPERIMENT
PEM electrolyzer is designed to operate over a wide range of input powers, then lead to utilize efficiently renewable power sources which are intermittent and variable in nature. One of the most promising options for producing hydrogen from a clean renewable energy source is via electrolysis coupled with a solar generator [29]. In the previous paper, PEM electrolyzer system is investigated experimentally to produce hydrogen and oxygen from water and programmable power supply simulated PV including numerous support components as well as external connections for electrical supply, water supply and drain, hydrogen and oxygen storage. The assemblage of these components is generally referred to as the BOP.
PEM electrolyzer is an electrochemical device to convert electricity and water into hydrogen and oxygen, then these gases can be used as a means to store energy for later use. These uses can range from electrical grid stabilization from dynamic electrical sources, that is, renewable power generation to distributed hydrogen production as a fuel for fuel cell vehicles. The PEM electrolyzer utilizes a solid polymer electrolyte (SPE) to conduct protons from the anode to the cathode while insulating the electrodes electrically. A portion of the required energy for a sustained electrolysis reaction is supplied by thermal energy and the remainder is supplied through electrical energy. The OER takes place on the anode side of a PEM electrolyzer. Here the liquid water reactant is supplied to catalyst where the supplied water is oxidized to oxygen, protons and electrons, while the HER takes place on the cathode side of a PEM electrolyzer. Here the supplied electrons and the protons that have conducted through the membrane are combined to create gaseous hydrogen. The PEM electrolyzer is coupled with a solar panel for the production of hydrogen, however the solar panel could be replaced with any source of electricity. The produced hydrogen and oxygen can permeate across the membrane, referred to as crossover. The flow rates of hydrogen and oxygen production depend on the amount of DC power which supply to the PEM electrolyzer. The required voltage and current are specified when an electric potential is applied to the cell number and area of the PEM electrolyzer [9].
3.1. Experimental Setup
protons (H+) and electrons (e-). Solvated protons formed at the anode migrate through the membrane to the cathode, which are reduced to molecular hydrogen (H2). While protons pass across the membrane, water molecules accompany the protons through the membrane from the anode to the cathode by an electric field. If the above membrane technology is applied, PEM electrolyzer uses pure water as the circulation fluid, which brings about a simpler BoP and a lower leak current. Moreover, gaseous products of H2 and O2 are produced at the backside of interpolar field, which leads to a lower ohmic loss and a higher purity of gases.
The uncombined water is resupplied to the cell, thus water is vitally recirculated between the anode and the accumulator by a circulation pump. This pump capacity can be determined based on both the pressure drop and the flow rate of the circulating water. Without general standard for the flow rate, a typical flow rate might be around ten times more than that of the water consumed at the anode [30]. In consideration of the configuration of PEM electrolyzer, there are some specific properties required for the membrane electrolyte such as proton conductivity, low gas permeability, chemical and mechanical stability, low cost and high durability.
3.1.1 PEM Electrolyzer Test Station
[image:16.596.128.465.362.519.2]
Figure 15. PEM electrolyzer test station built in PSSEL laboratory of INJE University.
[image:17.596.189.405.68.276.2]
PEM electrolyzer is operated and measured by the PEM electrolyzer test station, as shown in Figs. 14 and 15 [31-37]. The PEM electrolyzer is a single cell with the active area of 25 cm2 which has the same as the components, but is dissimilar to PEM fuel in the properties of membrane electrode assembly (MEA).
In order to control and measure the input power, operating temperature and water flow rate of PEM electrolyzer, the BOP system of PEM electrolyzer is organized by the numerous support components such as programmable power supply simulated PV, external connections for electrical supply, water supply and drain, hydrogen and oxygen storage. All data are controlled and recorded by a data acquisition system (DEWE-5000) for further analysis.
Liquid water is fed from water tank by an adjustable peristaltic pump (Laing D5 vario) and the flow rate of introduced water is adjusted to testing value by liquid mass flow controller (Bronkhorst Mini Cori Flow Controller).
[image:18.596.175.425.303.706.2]
Figure 18. Programmable DC power control component of PEM electrolyzer system.
Figure 19. Temperature control component of PEM electrolyzer system.
[image:19.596.136.460.75.292.2] [image:19.596.133.443.338.547.2]
into hydrogen and oxygen and can provide with programmable logic controller over a wide range of input powers, allowing it to utilize intermittent renewable power sources according to time and weather conditions. Electric load (Kikusui PLZ334W) is used to prevent the reversal of current unconsumed in the PEM electrolyzer. The input and remaining powers are controlled and recorded by a data acquisition system.
Hydrogen and oxygen leaves the PEM electrolyzer mixed with water, therefore, two phases have to be separated with cooling chamber and water separator. After separating the water, both gases are dried to measure the amount of the gases correctly. Regulator (Crown GSV1) is used to control the pressures of hydrogen and oxygen inside the PEM electrolyzer. The flow rates of hydrogen and oxygen are measured with a gas mass flow controller (Kofloc 3660). Flow diagram of hydrogen and oxygen measure component is shown in Fig. 20 and the detailed design and manufacture of the cooling chamber is shown in Fig. 21. The generated pressures of hydrogen and oxygen gases are measured by pressure sensor (Autonics PSAN) and both gases are compressed to store in pressure bottles of 1.4 L and 7 bar. Compressor is operated strictly at optimal pressure between the small sized gas mass flow controller and the large sized pressure bottle. Flow diagram of hydrogen and oxygen storage component is shown in Fig. 22. Table 7 shows a summary of sensor and equipment shown in the control system for the test station.
Figure 20. Hydrogen and oxygen measuring component of PEM electrolyzer system.
[image:20.596.159.439.381.528.2] [image:20.596.138.464.544.755.2][image:21.596.134.459.79.236.2]
Figure 22. Pressure storage component of PEM electrolyzer system.
Table 7. A summary of sensor and equipment are measured by the control system for the test station.
Description Source Sensor Range Quantity Signal Physical
Cell power supply Agilent 8735 A, 30 V, 110 A, 3.3 kW DC voltage 0-5 V 0-30 V
0-110 A 1
Water supply (water pump) Laing D5 vario,
25 LPM, H2O - - 0-25 LPM 2
Water flow- rate (L-MFC)
Bronkhorst Mini Cori Flow Controller, 2 kg/h, H2O
DC voltage 0-5 V 0-25 kg/h 2
Water pressure (RV) OSCAR E292L,
0.35 MPa - - 0.05-0.35 MPa 2
Back pressure (Regulator) Crown GSV1-3-04B3-4-F4TF, 3 MPa - - 0-3 MPa 2
Water removing
(water separator) KCC KWS 300-02, 300 l/min - - - 2
Hydrogen flowrate KOFLOC 3660, 20 SLPM, H2 DC voltage 0-5 V 0-20 SLPM 1
Oxygen flowrate KOFLOC 3660, 20 SLPM, O2 DC voltage 0-5 V 0-2 SLPM 1
Gas pressure Autonics PSAN-L1C(P)V, 1 MPa DC voltage 0-5 V 0-5 V (on/off) 4
Gas Compressor KNF N145 ANE, 30 l/min 7 bar - - - 2
Gas Storage
(Storage tank) Hansol, 7 bar 1.4 L - - 0-5 bar 2
Water temperature At water tank PT 100Ω - - 1
Cell temperature Attached to bipolar plate Type K - - 2
Line temperature At water tube Type K - - 6
[image:21.596.56.567.317.745.2]
bottle and produces electricity. Regenerative fuel cell, which comprises of PEM electrolyzer and PEM fuel cell, can provide electric power sustainably in the form of distributed generation by smartly combining with renewable energies.
3.1.2 Single Cell PEM Electrolyzer
PEM electrolyzer is a single cell with the active area of 25 cm2 which has the same as components, but is different properties of MEA from PEM fuel cell. As shown in Fig. 23, the configuration of PEM electrolyzer is organized MEA including membrane, catalyst layers (CLs), gas diffusion layers (GDLs), gaskets and bipolar plates (BPs) including flow channels, current collectors and end plates.
Figure 23. Schematic of a single cell PEM electrolyzer which has the same components as and different MEA properties from PEM fuel cell.
[image:22.596.133.462.279.499.2]
Figure 24. Photographs of 5 layer MEA assembly: (a) anode; (b) cathode.
[image:23.596.135.467.70.283.2] [image:23.596.141.451.325.691.2]
To investigate the influence of the flow characteristics on the cell performance and pressure drop, PEM electrolyzer is experimentally evaluated for four different BPs, each different flow field; (a) 5-pass 4-turn serpentine flow field, (b) 1-pass 24-turn serpentine flow field, (c) 2-pass 12-turn serpentine flow field and (d) 25-pass parallel flow field, when the flow filed of the both electrode sides is the same. The serpentine flow field among four different BPs is actively and repeatedly occurred vertical upward and downward compared to the parallel flow field. Although the flow rate is kept constant, the 5-pass 4-turn serpentine flow field in the channel become the most efficient among three serpentine flow fields [39]. Therefore, the numerical analysis-based design of the BP with 5-pass 4-turn serpentine flow field is used in this study.
As shown in Figure 14, both thermocouples inserted in the body and electric heaters on the cover plates of the cell control the temperature of the cell. DC power for splitting water is supplied from a power source to the cell through current collector and cell voltage was measured at each current density. In order to minimize ohmic loss, the current collector is made of aluminum coated with copper and designed considering the combination with end plate as shown in Fig. 25.
The design of end plate affects the performance of GDL when clamping the cell, therefore, need to be optimized for increasing the mass transfer through the GDL and reducing the contact resistance inside the cell. The end plate used in this study is designed optimally to have the uniform pressure over the cell area and minimize the deformations of the membrane, the GDL and the gaskets, as shown in Fig. 25. Three ranges of pressure measurement film (Fujifilm, two-sheet type, 0.2-0.6/0.5-2.5/2.5-10 MPa, ±10%) are used to evaluate the uniformity of the pressure over the cell area. The testing results of the pressure distribution over the cell area show the optimal clamping force of 92.5 kgf. Before the experiment, the pressure distribution over the cell area is always confirmed to be uniform at the clamping force of 92.5 kgf.
[image:24.596.166.421.495.701.2]
3.2. Experimental Results and Discussion
Both the influences of current density and temperature on voltage change and the influences of the temperature change in water flow at 80℃ representing the highest performance current density on current density and producing flow rate of hydrogen and oxygen are measured to verify the theoretical performance of PEM electrolyzer. The 𝑖 − 𝑉 polarization curve for current density and temperature fluctuation shown in Fig. 26, shows when the current density is 0, cell voltage starts from 1.48 V. As the current density increase, the cell voltage is increase too. As the rise of temperature, the cell voltage is decrease. In this study, the result of experiment show that the increase of temperature affect to minimize the polarization loss and the electrolyzer can produce same amount of hydrogen by using less electric power. Also Fig. 26 has similar pattern with numerical result of Fig. 11. So we can roughly expect to current density and temperature fluctuation.
Figure 27. Experimental effects of current density and water flow rate on the flow rates of hydrogen and oxygen produced in PEM electrolyzer.
Fig. 27 shows that when the temperature of both PEM electrolyzer and water is kept 80℃, the increase of hydrogen flow is about two times more than oxygen flow through the producing flow rate of hydrogen and oxygen as water flow rate and current density change. As for the flow rate of water is changed and supplied to cell, we can find the decrease of water flow reduces the flow rates of hydrogen and oxygen on both the oxygen and hydrogen sides, respectively.
4. CONCLUSIONS
[image:25.596.160.422.304.507.2]
temperature and current density. We confirm that analytical result to make experimental equipment and carry out the experiment. As the current density increases, the high pressure is loaded and amount of products, hydrogen and oxygen, are increase.
As the temperature is increased, the polarization loss will decrease. So the electrolyzer can produce 2 times the flow rate of hydrogen more than that of oxygen by using the same electric power. Also, both analytical result and experimental result of 𝑖 − 𝑉 polarization curve have similar pattern so we can use analytical model to expect rough performance about current density, temperature and flow rates. Henceforth, an in-depth study will be needed to provide the correlation between the water supplied to PEM electrolyzer and the performance of PEM electrolyzer.
NOMENCLATURE
𝐴 Active area [cm2] 𝑃
𝑐,𝑜 Pressure at the cathode outlet [J cm-3] 𝛼𝑘 Activity of water stream k, dimensionless 𝑃𝑠𝑎𝑡,𝑎 Saturated Pressure at the anode [J cm-3]
𝐶𝑤,𝑎 Water concentration for the anode surface of the
membrane [mol m-3] 𝑃𝑠𝑎𝑡,𝑐 Saturated Pressure at the cathode [J cm-3]
𝐶𝑤,𝑐 Water concentration for the cathode surface of the
membrane [mol m-3] 𝑝𝐻2 Partial pressure of hydrogen [J cm
-3]
𝐷𝑤 Diffusion coefficient of water [cm2 s-1] 𝑝𝐻2𝑂 Partial pressure of water [J cm -3]
𝐷𝜆 Diffusion coefficient of water content in the
membrane [cm2 s-1] 𝑝𝑂2 Partial pressure of oxygen [J cm
-3]
𝐸 Nernst potential [V] 𝑅 Universal gas constant [8.314 J mole-1 K-1]
𝐹 Faraday constant [96500 mol C-1] 𝑡
𝑚 Thickness of the membrane [m] 𝐹𝑎,𝑜 Flowrate at the anode outlet [mole s-1] 𝑦𝐻2 Molar fraction of hydrogen 𝐹𝑐,𝑜 Flowrate at the cathode outlet [mole s-1] 𝑦𝑂2 Molar fraction of oxygen 𝐹𝐻2𝑂,𝑑 Flowrate of water in diffusion [mole s-1] Greek symbols
𝐹𝐻2𝑂,𝑒𝑜𝑑 Flowrate of water in electro-osmotic drag [mole s-1] α Net water flux per proton flux
𝑖 Local current density [A cm-2] 𝜂
𝐹 Faraday Efficiency
𝑖0 Exchange current density [A cm-2] λ Water content in the membrane
𝑘𝑎,𝑜
Flow coefficient at the anode outlet
[mole cm3 J-1 s-1] ρ Density of the mixture [kg m-3]
𝑘𝑐,𝑜
Flow coefficient at the cathode outlet
[mole cm3 J-1 s-1] 𝜎𝑚 Membrane conductivity [ohm−1·m−1] 𝑀𝐻2𝑂 Molecular weight of water [g] Subscript and superscripts
𝑀𝑚,𝑑𝑟𝑦 Equivalent weight of a dry membrane [kg mol-1] 𝑎 Anode
𝑁̇𝐻2 Molar flowrate of hydrogen [mole s-1] 𝑐 Cathode
𝑁̇𝐻2𝑂,𝑎 Molar flowrate of water at the anode [mole s
-1] 𝑎𝑣𝑒 Average value
𝑁̇𝐻2𝑂,𝑐 Molar flowrate of water at the cathode [mole s
-1] 𝑒𝑙 Electrolyzer
𝑁̇𝑂2 Molar flowrate of oxygen [mole s
-1] 𝑒𝑜𝑑 Electro-osmotic drag
𝑛 Cell number 𝑘 Stream
𝑛𝑑 Electro-osmotic drag coefficient 𝑤 Water
ACKNOWLEDGEMENTS
This work was supported partly by Basic Science Research Program through the National Research Foundation of Korea (NRF) funded by the Ministry of Education (No. 2019R1I1A3A03050441) (No. 2015R1D1A1A02060006) and partly by Korea-Canada Cooperative Development Program (No. 2018K1A3A1A74064262) funded by the National Research Foundation of Korea (NRF).
References
1. R.K. Pachauri, A. Reisinger, Core Writing Team, editors. Climate Change 2007 Synthesis Report. (2008) Intergovernmental Panel on Climate.
2. Tanaka N, editors. World Energy Outlook (2009) International Energy Agency. 3. S. Becker, V. Karri, Int. J. Hydrog. Energy 35 (2010) 9963.
4. S. Dunn, Int. J. Hydrog. Energy 27 (2002) 235.
5. K.S. Choi, B.G. Kim, K. Park, H.-M. Kim, Comput. Fluids 69 (2012) 81.
6. M. Conte, A. Iacobazzi, M. Ronchetti, R. Vellone, J. Power Sources 100 (2001) 171.
7. A.L. Duigoua, J.-M. Borgard, B. Larousse, D. Doizi, R. Allen, B.C. Ewanb, G.H. Priestman, R. Elder, R. Devonshire, V. Ramos, G. Cerri, C. Salvini, A. Giovannelli, G.D. Maria, C. Corgnale, S. Brutti, M. Roeb, A. Noglik, O. Baudouin, Int. J. Hydrog. Energy 32 (2007) 1516.
8. R.C. Saxena, D. Seal, S. Kumar, H.B. Goyal, Renew. Sust. Energ. Rev. 12 (2008) 1909. 9. R.E. Clarke, S. Giddey, S.P.S. Badwal, Int. J. Hydrog. Energy 35 (2010) 928.
10. F. Barbir, Sol Energy 78 (2005) 661.
11. S.A. Grigoriev, V.I. Porembsky, V.N. Fateev, Int. J. Hydrog. Energy 31 (2006) 171.
12. S. Siracusano, A.D. Blasi, V. Baglio, G. Brunaccini, N. Briguglio, A. Stassi, R. Ornelas, E. Trifoni, V. Antonucci, A.S. Aricòa, Int. J. Hydrog. Energy 36 (2011) 3333.
13. A.S. Aricò, M. Girolamo, S. Siracusano, D. Sebastian, Vincenzo Baglio, M. Schuster, Membranes
7(25) (2017) 7020025; 1-16.
14. A. Cots, P. Bonete, D. Sebastian, V. Baglio, A.S. Arico, R. Gomez, ACS Appl. Mater. Interfaces
(2018) 25393.
15. X. Sun, K. Xu, C. Fleischer, X. Liu, M. Grandcolas, R. Strandbakke, T.S. Bjørheim, T. Norby, A. Chatzitakis, Catalyst 8 (2018) 120657; 1-41.
16. H. Görgün, Int. J. Hydrog. Energy 31 (2006) 29.
17. Ivy J, Summary of Electrolytic Hydrogen Production, (2004) National Renewable Energy Laboratory.
18. N.V. Dale, M.D. Mann, H. Salehfar, J. Power Sources 185 (2008) 1348. 19. P. Choi, D.G. Bessarabovb, R. Dattaa, Solid State Ion. 175 (2004) 535.
20. K.W. Harrison, E. Hernández-Pacheco, M. Mann, H. Salehfar, J. Fuel Cell Sci. Tech. 3 (2006) 220.
21. F. Marangio, M. Santarelli, M. Cali, Int. J. Hydrog. Energy 34 (2009) 1143. 22. M. Santarelli, P. Medina, M. Cali, Int. J. Hydrog. Energy 34 (2009) 2519. 23. M.E. Lebbal, S. Lecoeuche, Int. J. Hydrog. Energy 34 (2009) 5992.
24. R.L. LeRoy, C. Bowen, D.J. LeRoy, J. Electrochem. Soc. 127 (1980) 1954.
25. R. O’hayre, S.-W. Cha, W.G. Colella, F.P. Prinz, Fuel Cell Fundamentals, 3rd Edition, (2008) John Wiley and Sons Ltd, London, UK.
26. R. García-Valverde, C. Miguel, R. Martínez-Béjar, A. Urbina, Int. J. Hydrog. Energy 33 (2008) 5352.
27. O. Atlam, M. Kolhe, Energ. Convers. Manage. 52 (2011) 2952. 28. O. Atlam, Int. J. Hydrog. Energy 34 (2011) 6589.
Yoshida, Int. J. Hydrog. Energy 35 (2010) 9550.
31. R. Balaji, N. Senthil, S. Vasudevan, S. Ravichandran, S. Mohan, G. Sozhan, S. Madhu, J. Kennedy, S. Pushpavanam, M. Pushpavanam, Int. J. Hydrog. Energy 36 (2011) 1399. 32. Bonghwan Lee, Kiwon Park and Hyung-Man Kim, Int. J. Electrochem. Sci. 8 (2013) 235. 33. Ö.F. Selamet, F. Becerikli, M.D. Mat, Y, Kaplan, Int. J. Hydrog. Energy 36 (2011) 11480. 34. R. García-Valverde, N. Espinosa, A. Urbina, Int. J. Hydrog. Energy 37 (2012) 1927. 35. L. Ma, S. Sui, Y. Zhai, Int. J. Hydrog. Energy 34 (2009) 678.
36. S.-D. Yim, W.-Y. Lee, Y.-G. Yoon, Y.-J. Sohn, G.-G. Park, T.-H. Yang, C.-S. Kim, Electrochim. Acta 50 (2004) 713.
37. S.-D. Yim, G.-G. Park, Y.-J. Sohn, W.-Y. Lee, Y.-G. Yoon, T.-H. Yang, S. Um, S.-P. Yu, C.-S. Kim, Int. J. Hydrog. Energy 30 (2005) 1345.
38. A.T. Marshall, S. Sunde, M. Tsypkin, R. Tunold, Int. J. Hydrog. Energy 32 (2007) 2320. 39. K.S. Choi, H.-M. Kim, S.-M. Moon, Int. J. Hydrog. Energy 36 (2011) 1613.
![Table 3. Constitutive equations for modeling membrane submodel [5,16].](https://thumb-us.123doks.com/thumbv2/123dok_us/1766718.130432/8.596.56.566.287.739/table-constitutive-equations-for-modeling-membrane-submodel.webp)
![Table 4. Constitutive equations for modeling voltage ancillary [16,28].](https://thumb-us.123doks.com/thumbv2/123dok_us/1766718.130432/9.596.48.540.269.702/table-constitutive-equations-modeling-voltage-ancillary.webp)
![Table 5. Constitutive equations for modeling storage submodel [16,25].](https://thumb-us.123doks.com/thumbv2/123dok_us/1766718.130432/10.596.188.439.381.668/table-constitutive-equations-for-modeling-storage-submodel.webp)