Digital workers by design?
An example from the on-demand economy
Ilaria Maselli and Brian Fabo
No. 414 / October 2015
Abstract
Recent organisational and technological changes à la Uber have generated a new labour market fringe: a digital class of workers and contractors. In this paper we study the case of CoContest, a crowdsourcing platform for interior design. Our objective is to investigate how profitable this type of work can be, also from a cross-country perspective, and why professionals choose to supply work on such a platform.
Given the low returns, one might expect to see a pattern of northern employer/southern contractor. Yet analysis reveals a more nuanced pattern, in which designers supply their work even if they live in Italy, which is a high-income country. For these designers work on CoContest can make sense if they are new to the labour market and face high entry barriers, although crowdsourcing does not offer them profitable employment full time. The case of Serbia, the second-largest supplier of designers, is different, however. As a result of differences in purchasing power, if the market grows experienced Serbian designers can expect to make a living from crowdsourced contracts.
CEPS Working Documents are intended to give an indication of work being conducted within CEPS’ research programmes and to stimulate reactions from other experts in the field. The opinions expressed in this document are the sole responsibility of the authors and do not necessarily represent the official position of CEPS.
ISBN 978-94-6138-484-3
Contents
1. The context: how labour demand interacts with technology ...1
1.1 Research objectives and methodology ...1
2. CoContest in numbers ...3
2.1 A global overview of designers ...3
2.2 CoContest in Italy ...5
2.3 CoContest in Serbia ...8
2.4 By contest ...8
3. CoContest: a discussion ... 10
4. Conclusions ... 12
1
Digital workers by design?
An example from the on-demand economy
Ilaria Maselli and Brian Fabo
*CEPS Working Document No. 414 / October 2015
1.
The context: how labour demand interacts with technology
Recent organisational and technological changes have generated a new fringe of labour market: a digital class of workers and contractors. If until a decade ago offshoring was the prerogative of large multinationals, today it is also accessible to small companies and consumers who can have recourse to a vast crowd of workers across the globe to perform tasks such as making a restaurant reservation, running a logistic regression, or designing logos. This evolution is possible thanks to platforms such as Amazon Mechanical Turk (hereafter, AmTurk), Wonolo (short for Work. Now. Locally) oDesk (now UpWork), Fancy Hands, Desisgns99 and CoContest, which reduce the costs associated with distance.
The sector is still small but growing exponentially. Agrawal et al. (2013) document that between 2009 and 2013 the quarterly wage bill on oDesk went from $10,000,000 to $100,000,000, and that the number of employers and working contractors increased by 800% and 1,000% respectively. PwC (2015) estimates that five key sharing sectors: travel, car- sharing, finance, staffing, and entertainment have the potential to increase global revenues from roughly $15 billion today to around $335 billion by 2025.
Uber-type technology is creating new forms of organisation and a new sector: the ‘on-demand’ economy whose workers form a new transnational working class – what Huws (2014) calls the cybertariat. Digital workers are still a small share of the labour force, but they are worth studying because the group is likely to grow.
The pioneer in the field of crowdsourcing work is AmTurk, where workers from all around the world perform small tasks that which are not easily handled by artificial intelligence, such as identifying specific items on pictures uploaded to a website hosting user-generated content. Other similar examples of crowdsourced work are TaskRabbit, Upwork, Fancy Hands, freelancer.com, etc., where contractors can be hired to perform tasks of varying levels of complexity.
1.1
Research objectives and methodology
The organisation of this sector raises a number of questions: does it create quality jobs or just digital sweatshops? Are digital workers fairly remunerated? How can regulation be imposed on transnational services? In this study we focus on aspects related to the labour market, in particular the impact of technology on highly qualified professions – their demand, supply and remuneration, using CoContest as a case study, a crowdsourcing platform for design work.
The case of CoContest is interesting because it concerns high-skilled professionals. When looking for a designer, an individual can either rely on his or her local network or, via the internet, ask an international crowd. In this case technology does not become a substitute for labour, but opens up the market. Anyone looking for new ideas on how to renovate an apartment, organise a garage or optimise office space, for example, can open a contest on the website and receive ten projects from designers around the globe. As a result the task of designing becomes tradable (see Box 1 for further details on how CoContest works).
Existing research in this domain is rather limited. Some have started to use AmTurk to run experiments. Chandler and Kapelner (2013) explore whether the meaningfulness of a task can affect the quality and quantity of work or the remuneration for it. Horton (2010) questioned the idea that crowdsourcing platforms are simply ‘digital sweatshops’ and asked 200 AmTurk workers if they felt fairly treated in the online and offline labour markets. From the technical point of view, we use information openly accessible on the website to create a database by contest and analyse the available information. We downloaded a list of projects, as well as basic information about them through an automatic script, which collected information about all contests on the CoContest website. As a second step, the script went through all contests individually, collecting information about submissions. In section 2.1 we provide descriptive statistics for the entire pool of designers that registered and submitted at least once and analyse the information by contest. In sections 2.2 and 2.3 we provide additional details for the two largest countries represented, Italy and Serbia, respectively. The comparison may seem an unusual one, but in reality it is extremely informative because it represents a high-wage and a medium/low-wage country. In section 3 we discuss how CoContest earnings compare to local wages. In the last section we summarise our conclusions about this specific case of the digital labour market and suggest avenues for further research.
Our work is highly innovative: first of all it opens the literature to a new platform never studied before, CoContest, where high-skilled tasks are crowdsourced. Second, it relies on the entire population of crowdsourced workers of this platform, something that has never been done before in the literature to our knowledge. Third it explores the on-demand economy making use of web data. The underlying objective is to contribute to the debate about the relationship between workers, tasks, technological change and working conditions.1
DIGITAL WORKERS BY DESIGN?AN EXAMPLE FROM THE ON-DEMAND ECONOMY 3
2.
CoContest in numbers
2.1
A global overview of designers
On 02/09/2015, CoContest counted 1,008 registered designers that participated at least once in a contest. We exclude from the analysis designers that submitted only one project. It is possible that they just tried to compete once out of curiosity, mostly unsuccessfully, and then gave up. This reduces the sample to 516 designers.
Box 1. How CoContest works
[image:5.595.76.519.307.467.2]CoContest is an online service allowing individuals around the world to propose ‘contests’ for architects and interior designers to suggest design solutions for a range of properties. Customers are required to i) describe the desired design and timeframe, ii) choose from three possible service variants, iii) communicate with designers to specify requirements, and iv) rank the proposal received at the end of the content according to a set of criteria (see below). CoContest enters the relationship between customers and designers purely as a contact facilitator and receives compensation from the fee paid by the customer. That fee depends on the type of property (see the list of property types, Table 1) and the choice of service variant, of which there are three: concept, project and advanced. The amount varies between €300 for a concept of a room to €2,450 for the advanced design of a big house.
Table 1. CoContest price list (euros)
Concept Project Advanced Concept Project Advanced
Small apt. 400 950 1,450 Living room 300 550 800
Medium apt. 550 1,250 1,850 Kitchen 300 550 800
Large apt. 650 1,600 2,100 Bathroom 300 550 800
Small house 450 1,150 1,650 Bedroom 300 550 800
Medium house
600 1,450 2,050 Small office 350 950 1,450
Big house 700 1,900 2,450 Medium
office
500 1,250 1,850
Loft 500 1,350 1,850 Restaurant 600 1,600 2,100
Source: www.CoContest.com, September 2015.
Designers propose solutions based on the requirements of the customer and the customer then rates all projects. The rating includes criteria such as impact, correspondence, quality, innovation and viability, and the average rating determines the final ranking of proposals. The three projects with the highest rankings ‘split the prize’ by a ratio of 0.7/0.2/0.1.
On average, every designer (who participated in more than one contest) submitted 4.8 projects and was successful 0.7 times, meaning that the submission was ranked 1st, 2nd or 3rd.
[image:6.595.74.525.161.291.2]In total, he/she earned €211, which is €47 per submission on average. Table 2. Summary statistics (sample = 516 designers)
Average total submissions per designer
Average successful submissions per designer
Average success
rate (%)
Average euros earned in total
Average euros earned
per submission
Average 4.8 0.7 13 211 47
Standard deviation 5 1.3 20 493 101
Minimum 2 0 0 0 0
Maximum 48 14 100 6,892 800
Note: Average success rates and average euros earned per submission are not calculated as a ratio of columns two divided by column three and column four divided by two of this table, but the average calculated on the same columns in the microdata.
Source: Authors’ elaboration based on CoContest data.
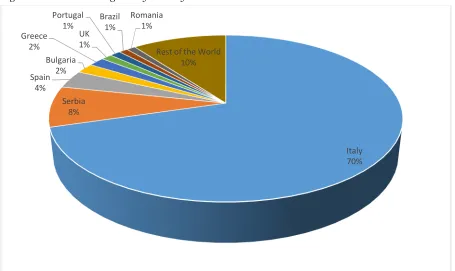
Out of the 516 designers who entered at least one submission, the large majority come from Italy. This is probably because Cocontest is an Italian start-up and chose the home country as its first market before starting to expand. The remaining third of CoContest designers are scattered around the globe. The second-largest representation is Serbia, with 41 designers. Spain follows with 18, then Bulgaria with 10. Many countries are represented with very few designers (10 or fewer) from India to Brazil and including Ukraine.
Figure 1. CoContest designers by country
Source: Authors’ elaboration on CoContest data.
Italy 70% Serbia
8% Spain
4% Bulgaria
2% Greece
2%
UK 1% Portugal
1% Brazil1%
Romania 1%
[image:6.595.70.525.462.733.2]DIGITAL WORKERS BY DESIGN?AN EXAMPLE FROM THE ON-DEMAND ECONOMY 5
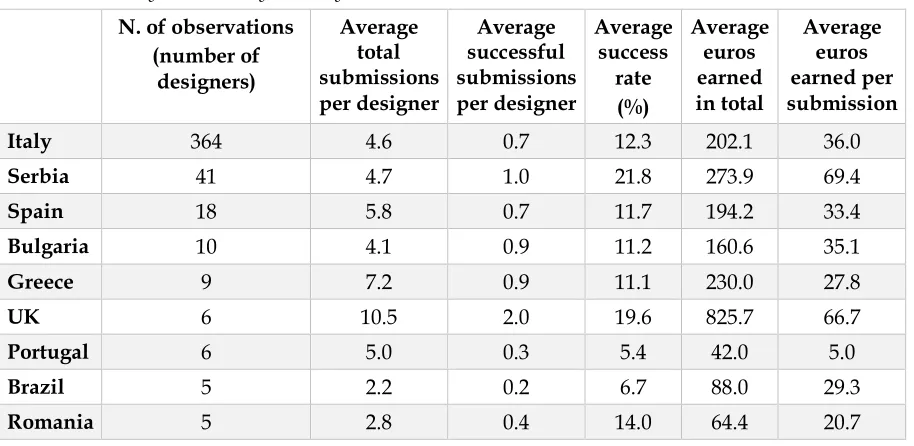
[image:7.595.73.530.145.368.2]We provide descriptive statistics by country, although in all cases except Italy and Serbia the sample is too small to be considered a reliable source of information.
Table 3. Summary statistics by country
N. of observations (number of
designers)
Average total submissions per designer
Average successful submissions per designer
Average success
rate (%)
Average euros earned in total
Average euros earned per submission
Italy 364 4.6 0.7 12.3 202.1 36.0
Serbia 41 4.7 1.0 21.8 273.9 69.4
Spain 18 5.8 0.7 11.7 194.2 33.4
Bulgaria 10 4.1 0.9 11.2 160.6 35.1
Greece 9 7.2 0.9 11.1 230.0 27.8
UK 6 10.5 2.0 19.6 825.7 66.7
Portugal 6 5.0 0.3 5.4 42.0 5.0
Brazil 5 2.2 0.2 6.7 88.0 29.3
Romania 5 2.8 0.4 14.0 64.4 20.7
Source: Authors’ elaboration on CoContest data.
It is interesting to note the case of the Serbian designers, who earned €69 per submission on average, which is approximately 30% higher than the average. Their average success rate is also the highest.
2.2
CoContest in Italy
Given the larger sample, we analyse the Italian case in more depth, focusing on two issues in particular:
o the distribution of CoContest earnings;
o the strategic behaviour of the designers: how do they maximise their income from the website: by targeting the applications? By submitting as many projects as possible? By targeting the size or the type of project?
Two variables are of interest: the total earned via the platform and the average amount earned per contest, whether successful or not.
Figure 2. Italian designers by total earnings, frequencies (sample = 364 designers)
0 versus >0 Share of earners
Source: Authors’ elaboration based on CoContest data.
The same calculations are performed using the variable average euros earned per contest (whether successful or not). Results are shown in Figure 3. Here the differences are much starker. The higher the premium, the lower the number of designers in that category. Many (14.6%) earn on average between €1 and €50 per contest, 11.8% earn between €51 and €100 per contest. But only 0.6% earn between €351 and €450 per contest. These differences could reflect degrees of quality, for instance.
Figure 3. Italian designers by euros earned by submission, frequencies (sample = 364 designers)
0 versus >0 Share of earners
Source: Authors’ elaboration based on CoContest data.
For the next step we investigated whether the average earnings per submission changed with the number of submissions. Results are shown in Table 4. According to the data, the optimisation process can be complex. There is an advantage to increasing the number of submissions: going from 1 to 2 increases the total amount earned by 50%.
0 euros 62% > 0 euros 38%
0 euros > 0 euros
3.8 7.7 5.5 2.7 4.7 3.3 2.7
1.4 1.1 0.8
0.0 2.0 4.0 6.0 8.0 10.0
1 - 100 euros 101 -200 euros 201 -300 euros 301 -400 euros 401 -500 euros 501 -600 euros 601 -700 euros 701 -800 euros 801 -900 euros 901 -1000 euros 0 euros 62% > 0 euros 38%
0 euros > 0 euros
14.6
11.8
4.4 3.0
1.1 1.9
0.0 0.3 0.3 0.0 0.3 0.0
-1.0 1.0 3.0 5.0 7.0 9.0 11.0 13.0 15.0
[image:8.595.69.534.429.620.2]DIGITAL WORKERS BY DESIGN?AN EXAMPLE FROM THE ON-DEMAND ECONOMY 7
Table 4. The Italian case: summary statistics by number of submissions (sample = 364 designers)
N. of observations
(number of designers)
Average total submissions per designer
Average successful submissions per designer
Average euros earned in
total
Average euros earned per submission
>1 submissions 364 4.6 0.7 202.1 44.7
>2 submissions 221 6.2 1.0 296.8 51.2
>3 submissions 160 7.5 1.3 371.2 54.7
>4 submissions 120 8.7 1.5 457.6 61.3
>5 submissions 86 10.1 1.9 554.6 64.6
>6 submissions 61 11.8 2.3 682.1 70.6
>7 submissions 51 12.7 2.5 715.1 66.6
>8 submissions 42 13.7 2.6 724.8 58.7
Source: Authors’ elaboration based on CoContest data.
The most interesting variable is the average euros earned per submission, which is equal to the total amount earned via the platform divided by the number of submissions. This number represents the reward for both the successful and the unsuccessful cases, in other words, for the hours spent drawing the ‘right’ and ‘wrong’ projects. Every designer is aware that only 1 in x proposals will be rewarded since every customer is informed that he/she will receive ten proposals and will have to decide which ones make up the top three.
The money earned per number of submissions increases the more projects a designer submits, indicating that there could be a sort of specialisation and learning process. However, the amount increases only up to “more than 6 submissions”, after which it starts to decline, perhaps signalling that if a designer drafts too many AutoCAD sketches the average quality of these designs starts to decrease.
Figure 4. Euros earned by number of submissions, Italian designers (sample = 364 designers)
[image:9.595.70.525.517.734.2]2.3
CoContest in Serbia
With 41 designers having participated in at least one contest, Serbia is the second-largest group represented. Serbians are more successful than the average for all designers because their success rate is 22%, compared to an average of 13% for whole group.
[image:10.595.70.532.243.403.2]The money, however, was not split among all designers. In fact, 18 designers, or 44% of all Serbian designers, did not earn any money at all − a lower proportion than the Italians. This leaves the remaining 23 designers with some earnings. The distribution of their earnings is shown in Figure 5.
Figure 5. Serbian designers by total earnings, frequencies (sample = 41 designers)
0 versus >0 Share of earners
Source: Authors’ elaboration based on CoContest data.
Success does not always pay off equally; projects differ in total prize and the payoff for second and third place is much lower than the winner’s share. Among the three designers with earnings of over € 1000, the most successful one managed to succeed in 2 contests out of 3 submissions, for a total payoff of €1,624. The second most successful designer only needed 4 successful submissions out of 9 to earn €1,529. Finally, the third most successful designer competed in 21 contests, but only won (either as 1st, 2nd or 3rd) 5 for a total of €1,232.
Consequentially, the successful designers differ greatly in terms of number of submissions, success rate and payoff per project. There does not appear to be a single superior strategy.
2.4
By contest
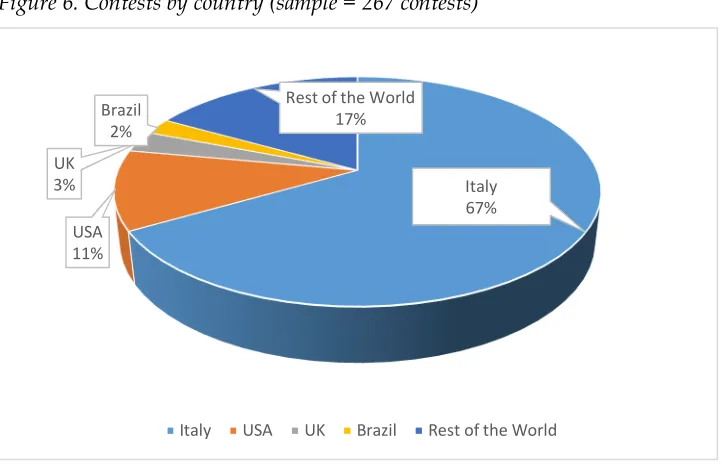
In total, 267 closed contests could be found on the website as of 2/9/2015. The average price was €441 for each. For each request, 10 projects were submitted on average, which entails a deadweight loss of 7 projects given that only the first three are rewarded financially. As can be seen in Figure 6, two-thirds of the requests come from Italy because the start-up is Italian and only in more recent months did they start to expand abroad. Eleven percent of the requests come from the United States, 3% from the UK, and 2% from Brazil. Many countries submit a small number of requests (around 3 or 4), which in total add up to a share of 17% for the ‘Rest of the World’ category in Figure 6. These countries range from Lebanon to Thailand.
0 euro
s 44% > 0
euros 56%
0 euros > 0 euros
12.2
14.6
7.3
9.8
4.9
0 5 10 15 20
DIGITAL WORKERS BY DESIGN?AN EXAMPLE FROM THE ON-DEMAND ECONOMY 9
Figure 6. Contests by country (sample = 267 contests)
Source: Authors’ elaboration based on CoContest crawled data.
More than half of these projects (55%) fall into the ‘standard’ category. Thirty-five percent choose basic and 10% choose premium packages. What customers request in a quarter of the cases are ideas for the renovation of medium-sized apartments. In 11% of the cases projects are for small apartments, and for large apartments in 6% of the cases. Villas make up 12% of the contests in total. There are also smaller and more specific requests, such as living rooms (20%)2 and bedrooms (4%).3
This crowdsourcing platform was set up in 2012. Using the data by contest we verify if any change can be observed over the years. The number of contests on the website is increasing, going from 12 in 2012 to 115 in 2014. At the same time, the average reward per contest has also gone up, from €277 to €519.
Figure 7. Contests over time (sample = 267 contests)
2 Living areas and living rooms are combined in the data. 3 Bedrooms and sleeping areas are combined in the data.
Italy 67% USA
11% UK 3%
Brazil 2%
Rest of the World 17%
[image:11.595.72.530.531.678.2]Note: 2015 data are only available until 2 September 2015. This explains why the number of contests is lower compared to 2014 in the top left panel of the figure.
Source: Authors’ elaboration based on CoContest web-crawled data.
3.
CoContest: a discussion
For designers, especially young ones, CoContest can be very attractive as it allows them to enter the market, acquire experience and build up a portfolio. Many young architects in Italy complain that it takes years before they manage to gain a decent hold in the labour market (CSAPPC-CRESME, 2013).
On the other hand, the competitive prices raise the question of whether CoContest can really be considered a viable strategy to earn a full-time income. In other words: is €47 per project too much, or not enough? What about in Italy, or in Serbia?
It is difficult to provide an objective answer without having precise information on the hours designers worked on each project. A survey conducted internally by CoContest indicates that it takes approximately 6 hours for a concept, 10 hours for a project and 12 hours for an advanced type of service, with an average of 9.3 hours per contest. This translates into a gross hourly pay of €5, averaged across all countries, contests and designers.
Is this fair remuneration for the work done via the platform? To provide an objective answer, we compare the sums earned per submission with the monthly average net salary of Italians and Serbians, as recorded on the Numbeo database.4
According to Numbeo statistics,5 Italians earn on average €1,477 per month (net). A designer
that chooses CoContest as his/her only source of clients would have to submit 41 projects per month which, divided by 4, means 10.2 projects per week, or two per day. Assuming that the hours needed to produce a project as estimated by CoContest are correct, this means that the platform cannot, on average, provide a full-time salary for Italian workers.
4 Numbeo is a crowdsourced global database. Everyone can contribute to it by adding information on prices of food, housing, commodities, salaries as well as perceived crime rates and quality of healthcare. We selected it over more institutional databases because it is the only one, to our knowledge, that has comparable data on both Italy and Serbia.
5 October 2015 update, Italy: (www.numbeo.com/cost-of-living/country_result.jsp?country=Italy) − data based on 1,574 different contributors over the past 18 months. Serbia: (
www.numbeo.com/cost-of-living/country_result.jsp?country=Serbia&displayCurrency=EUR). The data are based on 386
DIGITAL WORKERS BY DESIGN?AN EXAMPLE FROM THE ON-DEMAND ECONOMY 11
The picture is different for Serbian designers. With an average net monthly salary of €334 (40,161 Serbian Dinar), the CoContest ‘prizes’ are more profitable for Serbians. With an average rate of €69.4 per submission, 4.8 submissions per month (or 1.2 per week) are needed to earn an average wage.
As a result of international competition, Italian designers would have to be much more productive than their Serbian counterparts to survive in this type of market, which translates into being faster or investing in more advanced software. Assuming that they offered the same quality, measured by the same average sum per submission – €47 – an Italian architect would have to be four-times more productive to compete with a Serbian counterpart.6
If this is not feasible, highly qualified Italian designers are not likely to supply their time on CoContest, leaving only those with less experience, for instance, to compete against the better qualified Serbian designers. Such a hypothesis is confirmed by the data: Serbian designers have higher success rates and earn on average twice as much as Italians per contest. A realistic strategy for Italian designers would therefore be: either to use the crowdsourcing platform as a secondary source of income, or as a tool to acquire experience during or after their studies.
What type of market does this produce? The supply of work can, in principle, be as international as the demand. However, keeping remunerations constant, disparities in purchasing power can strongly affect both. Consequently, according to Agrawal et al. (2013) the northern-employer/southern-contractor pattern prevails in the digital labour market. Our view of the trade pattern in the digital labour market is more nuanced than this northern-employer/southern-contractor division because it fails to explain why nearly half of AmTurkers, for instance, live in the United States (Ipeirotis, 2010) and why a large portion of the supply in the CoContest market is filled by designers from a high-income country (Italy).7
Based on the data shown above, our hypothesis is that the reasons why workers from richer countries supply their services in this market, despite the relatively low compensations, can be multiple. For designers in high-income countries it still makes sense to participate in the digital labour market if:
- they have little experience but encounter high entry barriers in the local labour market; - if they have very high productivity;
- if they offer very low quality and thus cannot compete in the local market;
- if they value the possibility to organise their time and work flexibly, avoiding personal exchanges with the client.
Regional differences in wages might also play a role. Averages wages in Milan are 1.7 times higher than in Bari, in southern Italy.8
At the same time, there are few architects from emerging markets because only a small share of their labour force has a university degree, indicating that fewer are able to provide high quality output. Due to the shortage of high-skilled workers, it is possible that they find
6 We divide the Italian and Serbian net monthly wage by 47. This gives 31 in Italy vs. 7 contests in Serbia. The ratio between the two values is 4.4.
7 As in Agrawal et al., we also rely on the World Bank classification. For 2016 data can be found here:
(http://data.worldbank.org/about/country-and-lending-groups).
employment in the local labour market, which could be convenient due to lower competition.
4.
Conclusions
Ever since the Luddites tried to destroy machines in the textile industry in the early 19th
century the relationship between workers and technology has been a tricky one. In this paper we study the specific case of CoContest, a platform that allows anyone with a renovation project to draw on crowdsourcing for a new design. This makes a typically non-tradable service potentially tradable across different countries, in terms of both supply and demand, for a much larger portion of the overall market. International competitions for architectural design were previously limited to costly upscale projects involving a renowned architect. Via CoContest anyone can now involve a designer from anywhere in the world in a renovation project. Even though the activities on CoContest represent a very small percentage of the overall design business, the case is interesting because it extends the on-demand sector to a high-skilled profession, whereas for a long time it mostly concerned low-qualified tasks, often offshored via the better known Amazon Mechanical Turk.
CoContest is typical of the demand economy in which one might expect a pattern of northern-employer/southern-contractor. Analysis of CoContest data reveals a more nuanced pattern, however, which is consistent with a representation of designers that supply their work even if they reside in a high-income country. For them work on CoContest makes sense, for instance, if they have little experience and face high labour market entry barriers. Or if they value the possibility to organise their time, work flexibly and avoid personal interactions with the client or having to rent an office. Nevertheless, given the expected return per contest it is impossible to consider CoContest as a full-time job in Italy, but it would be feasible in Serbia – the second-largest supplier of designers – if the contests reach a certain volume in the future. This is not only due to the lower average per capita income in Serbia, but also to the fact that for the same expected return per contest one can expect a more experienced Serbian architect.
We refrain from extrapolating broader policy considerations because there is very little scientific knowledge in this field,9 largely due to a lack of data. Further research is needed to
clarify how the on-demand economy works and what its impact is on the labour market. Even though still small in terms of number of workers involved, Uber-type systems might soon apply to other services that, like design and local transport, have so far remained shielded from competition.10
9 We also refrain from entering the debate about regulation of the system and how designers certify their degrees because this goes beyond the scope of our research, which aims to understand the impact of technology on the labour market demand and supply and wage dynamics of the digital labour market.
DIGITAL WORKERS BY DESIGN?AN EXAMPLE FROM THE ON-DEMAND ECONOMY 13
References
Agrawal, A., J. Horton, N. Lacetera and E. Lyons (2013), “Digitization and the Contract Labor Market: A Research Agenda”, NBER Working Paper No. 19525, National Bureau of Economic Research, Cambridge, MA, October.
Autor, D., F. Levy and R.J. Murnane (2003), “The skill content of recent technological change: An empirical exploration”, Quarterly Journal of Economics, Vol. 118, No. 4, pp. 1279-1333.
Chandler, D. and A. Kapelner (2013), “Breaking monotony with meaning: Motivation in crowdsourcing markets”, Journal of Economic Behavior & Organization, Vol. 90, June, pp. 123-133.
CSAPPC-CRESME (2013), Rapporto 2013 sulla professione Rapporto 2013 di Architetto, Roma, April.
Frey, C.B. and M. Osborne (2013), “The Future of Employment: How susceptible are jobs to computerisation?”, Oxforn Martin School, September.
Goos, M., A. Manning and A. Salomons (2009), “The Polarisation of the European Labor Market”, American Economic Review Papers and Proceedings, Vol. 99, No. 2, pp. 58-63, May.
Horton, J. (2010), “The condition of the Turking class: Are online employers fair and honest?”, Economics Letters 111 (2011) 10–12.
Huws, U. (2014), “Labor in the global digital economy: The Cybertariat Comes of Age”, Monthly Review Press, New York, 5 December.
Ipeirotis, P.G. (2010), “Demographics of mechanical turk”, NYU Working Paper No. CEDER-10-01.
Johnson, D. and D. Cooper (2014), “Ambiguity in Performance Pay: An Online Experiment”, Working Paper No. 2014-83, Department of Economics, University of Calgary.
Maselli, I. (2012), “The Evolving Supply and Demand of Skills in the Labour Market”, Intereconomics, Vol. 47, No. 1.
Numbeo, www.numbeo.com
PWC (2015), “The sharing economy”, A report from the Consumer Intelligence Series.
Straub, T., H. Gimpel, F. Teschner and C. Weinhardt (2015), “How (not) to Incent Crowd Workers”, Business & Information Systems Engineering, Vol. 57, No. 3, pp. 167-179.
World Bank, “Country and Lending Groups” classification