Evaluation of the Phonics
Screening Check: Technical
Appendices
Research report
May 2013
2
Contents
Table of figures
2
Literacy Coordinator - Data tables
13
Teacher Questionnaire - Data tables
41
Table of figures
Literacy Coordinator - Data tables
Table 1 Role of teachers responding to the literacy coordinator questionnaire
13
Table 2 Role of teachers responding to the literacy coordinator questionnaire
who indicated they held an ‘other role’ [filter question from Table 1]
13
Table 3 The proportion of schools reporting phonics is taught to all pupils in
Reception
14
Table 4 The number of days per week schools spent teaching phonics in
Reception [filter question based on proportion responding ‘yes’ in Table 3
above]
14
Table 5 The number of hours per week schools spent teaching phonics in
Reception [filter question based on proportion responding ‘yes’ in Table 3
above]
14
Table 6 The number of schools reporting phonics is taught to only some
pupils in Reception [filter question based on the proportion responding ‘no’ in
Table 3 above]
14
Table 7 The number of hours per week schools spent teaching phonics in
Reception if it is taught to some, but not all, pupils [filter question based on the
proportion responding ‘no’ in Table 3 above]
15
Table 8 The number of schools reporting phonics is taught to all pupils in Year
1
15
3
Table 10 The number of hours per week schools spent teaching phonics in
Year 1 [filter question based on proportion responding ‘yes’ in Table 8 above]
15
Table 11 The number of schools reporting phonics is taught to only some
pupils in Year 1 [filter question based on proportion responding ‘no’ in Table 8
above]
16
Table 12 The number of hours per week schools spent teaching phonics in
Year 1 if it is taught to some, but not all, pupils [filter question based on
proportion responding ‘yes’ in Table 11 above]
16
Table 13 The number of schools reporting phonics is taught to all pupils in
Year 2
16
Table 14 The number of days per week schools spent teaching phonics in
Year 2 [filter question based on proportion responding ‘yes’ in Table 13
above]
16
Table 15 The number of hours per week schools spent teaching phonics in
Year 2 [filter question based on proportion responding ‘yes’ in Table 13
above]
17
Table 16 The number of schools reporting phonics is taught to only some, but
not all, pupils in Year 2 [filter question based on proportion responding ‘no’ in
Table 13 above]
17
Table 17 The number of hours per week schools spent teaching phonics in
Year 2 if it is taught to some, but not all, pupils [filter question based on
proportion responding ‘yes’ in Table 16 above]
17
Table 18 The number of schools reporting phonics is taught to all pupils in
Year 3
17
Table 19 The number of days per week schools spent teaching phonics in
Year 3 [filter question based on proportion responding ‘yes’ in T
able 18
above]
18
Table 20 The number of hours per week schools spent teaching phonics in
Year 3 [filter question based on proportion responding ‘yes’ in Table 18
above]
18
Table 21 The number of schools reporting phonics is taught to some, but not
all, pupils in Year 3 [filter question based on proportion responding ‘no’ in
4
Table 22 The number of hours per week schools spent teaching phonics in
Year 3 if it is taught to some, but not all, pupils [filter question based on Table
21 above]
18
Table 23 The number of schools reporting phonics is taught to all pupils in
Year 4
19
Table 24 The number of days per week schools spent teaching phonics in
Year 4 [filter question based on Table 23 above]
19
Table 25 The number of hours per week schools spent teaching phonics in
Year 4 [filter question based on Table 23 above]
19
Table 26 The number of schools reporting phonics is taught to some, but not
all, pupils in Year 4 [filter question from Table 23 above]
19
Table 27 The number of hours per week schools spent teaching phonics in
Year 4 if it is taught to some, but not all, pupils [filter question based on Table
26 above]
20
Table 28 The number of schools reporting phonics is taught to all pupils in
Year 5 and 6
20
Table 29 The number of days per week schools spent teaching phonics in
Year 5 and 6 [filter question based on Table 28 above]
20
Table 30 The number of hours per week schools spent teaching phonics in
Year 5 and 6 [filter question based on Table 28 above]
20
Table 31 The number of schools reporting phonics is taught to some, but not
all, pupils in Year 5 and 6 [filter question from Table 28 above]
21
Table 32 The number of hours per week schools spent teaching phonics in
Year 5 and 6 if it is taught to some, but not all, pupils [filter question based on
Table 31]
21
Table 33 The number of schools reporting phonics is taught in discrete
phonics sessions in Reception
21
Table 34 The number of hours per week schools spent teaching phonics
discretely in Reception [filter question based on Table 33 above]
21
Table 35 The number of schools reporting phonics is taught integrated into
5
Table 36 The number of hours per week schools spent teaching phonics
integrated into other work in Reception [filter question based on Table 35
above]
22
Table 37 The number of schools reporting phonics is taught in discrete
phonics sessions in Year 1
22
Table 38 The number of hours per week schools spent teaching phonics
discretely in Year 1 [filter question based on Table 37 above]
22
Table 39 The number of schools reporting phonics is taught integrated into
other work in Year 1
23
Table 40 The number of hours per week schools spent teaching phonics
integrated into other work in Year 1 [filter question based on Table 39 above]
23
Table 41 The number of schools reporting phonics is taught in discrete
phonics sessions in Year 2
23
Table 42 The number of hours per week schools spent teaching phonics
discretely in Year 2 [filter question based on Table 41 above]
23
Table 43 The number of schools reporting phonics is taught integrated into
other work in Year 2
24
Table 44 The number of hours per week schools spent teaching phonics
integrated into other work in Year 2 [filter question based on Table 43 above]
24
Table 45 The number of schools reporting phonics is taught in discrete
phonics sessions in Year 3
24
Table 46 The number of hours per week schools spent teaching phonics
discretely in Year 3 [filter question based on Table 45 above]
24
Table 47 The number of schools reporting phonics is taught integrated into
other work in Year 3
25
Table 48 The number of hours per week schools spent teaching phonics
integrated into other work in Year 3 [filter question based on Table 47 above]
25
Table 49 The number of schools reporting phonics is taught in discrete
6
Table 50 The number of hours per week schools spent teaching phonics
discretely in Year 4 [filter question based on Table 49 above]
25
Table 51 The number of schools reporting phonics is taught integrated into
other work in Year 4
26
Table 52 The number of hours per week schools spent teaching phonics
integrated into other work in Year 4 [filter question based on Table 51 above]
26
Table 53 The number of schools reporting phonics is taught in discrete
phonics sessions in Year 5 and 6
26
Table 54 The number of hours per week schools spent teaching phonics
discretely in Year 5 and 6 [filter question based on Table 53 above]
26
Table 55 The number of schools reporting phonics is taught integrated into
other work in Year 5 and 6
27
Table 56 The number of hours per week schools spent teaching phonics
integrated into other work in Year 5 and 6 [filter question based on Table 55
above]
27
Table 57 Agreement with given statements characterising the school’s
approach to phonics within early literacy teaching
27
Table 58 Schools’ use of published phonics resources (in addition to ‘core’
programmes)
28
Table 59 Number of published phonics resources (in addition to ‘core’
programmes) schools used
28
Table 60 Number of schools who have made changes to phonics teaching in
anticipation of the check
28
Table 61 Types of changes made by schools in anticipation of the check [filter
question from Table 60 above]
29
Table 62 Types of changes made by schools in anticipation of the check
where ‘other changes’ were indicated [filter question from Table 61 above]
29
Table 63 Year groups in which changes were made in anticipation of the
check [filter question from Table 61 above]
30
Table 64 The point in the year in which changes were made [filter question
7
Table 65 The number of teachers in the school who have received externally
provided training focused on the teaching of phonics in the school year
2011/12
30
Table 66 Other than external training, other ways literacy coordinators
reported staff learnt about phonics teaching in the school year 2011/-12
31
Table 67 Other than external training, other ways literacy coordinators
reported staff learnt about phonics teaching in the school year 2011/12, when
‘other’ was indicated [filter question from Table 66 above]
31
Table 68 How well literacy coordinators felt staff in their schools were
prepared to provide effective phonics teaching
32
Table 69 The proportion of teachers who were in schools which gave access
to externally provided training focused on the phonics screening check
32
Table 70 How did Year 1 teachers in the school prepare for the phonics
screening check
32
Table 71 How did Year 1 teachers in the school prepare for the phonics
screening check, responses of those who ticked ‘other’ [filter question from
Table 70 above]
33
Table 72 The actions that will be taken to use the results of the check within
the school
34
Table 73 The actions that will be taken to use the results of the check within
the school by those who indicated ‘other’ actions [filter question from Table 72
above]
35
Table 74 Descriptive statistics for the financial cost (£s) of administering the
check reported within schools
35
Table 75 Descriptive statistics for the time cost (hours) of administering the
check reported within schools
36
Table 76 Information provided to parents/carers prior to the administration of
the check
36
Table 77 How information was communicated to parents/carers after the
8
Table 78 How information was communicated to parents/carers after the
administration of the check by those who responded ‘other’ [filter question
from Table 77 above]
37
Table 79 The additional information given to parents/carers of the children
who were shown to require support
37
Table 80 Literacy Coordinator agreement with the statement ‘I am convinced
of the value of systematic synthetic phonics teaching’
38
Table 81 Literacy Coordinator agreement with the statement ‘Phonics should
always be taught in the context of meaningful reading’
38
Table 82 Literacy Coordinator agreement with the statement ‘Phonics has too
high a priority in current education policy’
38
Table 83 Literacy Coordinator agreement with the statement ‘A variety of
different methods should be used to teach children to decode words’
39
Table 84 Literacy Coordinator agreement with the statement ‘Systematic
phonics teaching is necessary only for some children’
39
Table 85 Literacy Coordinator agreement with the statement ‘The phonics
screening check provides valuable information for teachers’
39
Table 86 Literacy Coordinator agreement with the statement ‘The phonics
screening check provides valuable information for parents’
40
Teacher Questionnaire - Data tables
Table 1 Percentage of pupils who reached the required standard as reported
by participating Year 1 teachers
41
Table 2 Descriptive statistics for percentage of pupils who reached the
required standard
41
Table 3 Year 1 teachers’ reactions to the stan
dard of the check
41
Table 4 The number of pupils considered for disapplication from the
check by individual Year 1 teachers
42
Table 5 The number of pupils actually disapplied from the check by individual
Year 1 teachers [filter based on Table 4 above]
43
Table 6 The people involved in the decision to disapply children from the
9
Table 7 The people involved in the decision to disapply children from the
check, based on those who indicated ‘other’ [filter question
based on Table 6
above]
44
Table 8 The mechanisms for parental involvement in disapplication [filter
question based on Table 4 above]
45
Table 9 Reasons given for disapplying children from the screening check
[filter question based on Table 4 above]
45
Table 10 Reasons given for disapplying children from the screening check,
when ‘other’ was indicated [filter question based on Table 9 above]
46
Table 11 The criterion applied to make a judgement of a child having no
grapheme-phoneme correspondence [filter question based on Table 4 above]
46
Table 12 The criterion applied to make a judgement of a child having no
grapheme-phoneme correspondence when the respondent indicated ‘other’
[filter question based on Table 11 above]
47
Table 13 The ease of judging if and when to stop the check early due to a
child struggling
47
Table 14 The descriptive statistics for the number of children with whom Year
1 teachers stopped the check early
48
Table 15 Factors which influenced teachers’ judgements about if and when to
end the check
48
Table 16 Factors which influenced teachers’ judgements about if and when to
end the check when respondent indicated ‘other’ [filter question based on
Table 15 above]
49
Table 17 The proportion of teachers who reported having experience of
administering the check with the relevant group of pupils
49
Table 18 Teachers’ judgements of the suitability of the check for pupils with
sight impairments
50
Table 19 Teachers’ judgements of the suitability of the check for pupils with
hearing impairments
50
Table 20 Teachers’ judgements of the suitability of the check for pupils with
10
Table 21 Teachers’ judgements of the suitability of the check for pupils with
other learning difficulties
51
Table
22 Teachers’ judgements of the suitability of the check for pupils with
English as an additional language
51
Table 23 Teachers’ explanation of why the check is not suitable for those with
sight impairments [filter question based on Table 17 above]
52
Table 24 Teachers’ explanation of why the check is not suitable for those with
hearing impairments [filter question based on Table 18 above]
52
Table 25 Teachers’ explanation of why the check is not suitable for those with
speech, language or communication needs [filter question based on Table 19
above]
53
Table 26 Teachers’ explanation of why
the check is not suitable for those with
other learning difficulties [filter question based on Table 20 above]
54
Table 27 Teachers’ explanation of why the check is not suitable for those
pupils learning English as an additional language [filter question based on
Table 21 above]
55
Table 28 Teachers’ judgements of the suitability of the check for pupils with
basic letter sound recognition only
55
Table 29 Teachers’ judgements of the suitability of the check for pupils able
to read basic CVC words
56
Table 30 Teachers’ judgements of the suitability of the check for pupils able
to read decodable texts
56
Table 31 Teachers’ judgements of the suitability of the check for pupils able
to read a range of simple texts using a variety of cueing systems
56
Table 32 Teachers’ judgements of the suitability of the check for independent
and readers
57
Table 33 Interventions for children who had difficulty completing section 1 of
the check
57
Table 34 Interventions for children who could complete section 1 but had
difficulties with section 2 of the check
57
Table 35 Interventions for children who scored close to, but under, the
11
Table 36 Other interventions listed by teachers for children who had difficulty
completing section 1 of the check
58
Table 37 Other interventions listed by teachers for children who could
complete section 1 of the check but had difficulties in section 2
59
Table 38 Other interventions listed by teachers for children who scored close
to, but under, the threshold score
59
Table 39 Descriptive statistics; of those who did not reach the required
standard, the number of pupils likely to continue with systematic phonics
teaching only
60
Table 40 Descriptive statistics; of those who did not reach the required
standard, the number of pupils likely to receive intensive learning for small
groups of children (without individual support)
60
Table 41 Descriptive statistics; of those who did not reach the required
standard, the number of pupils likely to receive individual teacher or teaching
assistant support (without group support)
60
Table 42 Descriptive statistics; of those who did not reach the required
standard, the number of pupils likely to receive individual teacher or teaching
assistant support (without group support)
61
Table 43 Descriptive statistics; of those who did not reach the required
standard, the number of pupils likely to receive ‘other’ kinds of support
61
Table 44 The other types of support given to children who did not reach the
standard
61
Table 45 The numbers of teachers expecting to make use of published
phonics resources specifically designed for the purpose of phonics ‘catch-up’
62
Table 46 Descriptive statistics; of those who did reach the required standard,
the number of pupils likely to receive additional support in the future, over and
above any routine phonics teaching
62
Table 47 Evidence teachers used to decide if or what type of support should
be provided to a child
62
Table 48 Evidence teachers used to decide if or what type of support should
be provided to a child, responses by those who indicated ‘other’ [filter
12
Table 49 How teachers plan to use the results of the check in their general
teaching
63
Table 50 How teachers plan to use the results of the check in their general
teaching, responses by those who indicated ‘other’ [filter question from Table
13
[image:13.595.93.431.403.642.2]Literacy Coordinator - Data tables
Table 1 Role of teachers responding to the literacy coordinator questionnaire
Role %
Literacy coordinator 70 Key stage/ year group coordinator 29
Headteacher 17
Other senior leader 21
Other role 8
Missing 3
N=844
Source: NFER survey of literacy coordinators, 2012
More than one answer could be given so percentages may sum to more than 100
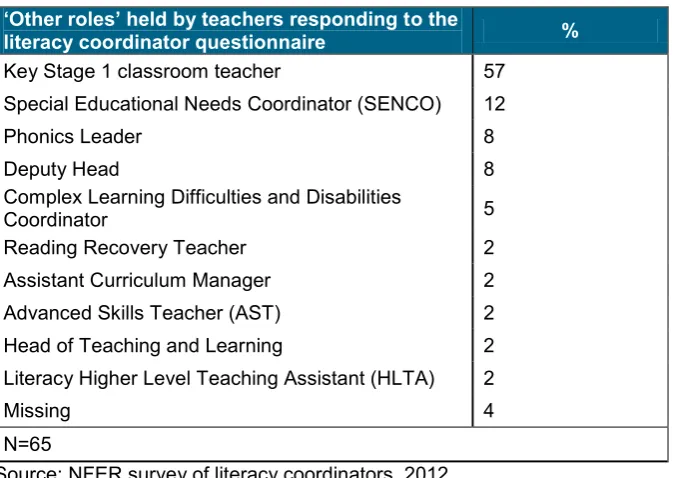
Table 2 Role of teachers responding to the literacy coordinator questionnaire who indicated they held an ‘other role’ [filter question from Table 1]
‘Other roles’ held by teachers responding to the
literacy coordinator questionnaire %
Key Stage 1 classroom teacher 57 Special Educational Needs Coordinator (SENCO) 12
Phonics Leader 8
Deputy Head 8
Complex Learning Difficulties and Disabilities
Coordinator 5
Reading Recovery Teacher 2
Assistant Curriculum Manager 2 Advanced Skills Teacher (AST) 2 Head of Teaching and Learning 2 Literacy Higher Level Teaching Assistant (HLTA) 2
Missing 4
N=65
Source: NFER survey of literacy coordinators, 2012
14
Table 3 The proportion of schools reporting phonics is taught to all pupils in Reception
Response %
Yes 96
No 1
Missing 4
N=844
Source: NFER survey of literacy coordinators, 2012
Due to percentages being rounded to the nearest integer, they may not sum to 100
Table 4 The number of days per week schools spent teaching phonics in Reception [filter question based on proportion responding ‘yes’ in Table 3 above]
Statistic N
Mean 4.9
Median 5
Std. Deviation 0.4
No response 30
N=840
Source: NFER survey of literacy coordinators, 2012
Table 5 The number of hours per week schools spent teaching phonics in Reception [filter question based on proportion responding ‘yes’ in Table 3 above]
Statistic N
Mean 2.2
Median 2
Std. Deviation 1.1
No response 93
N=840
Source: NFER survey of literacy coordinators, 2012
Table 6 The number of schools reporting phonics is taught to only some pupils in Reception [filter question based on the proportion responding ‘no’ in Table 3 above]
Response %
Yes 75
No <1
Missing 25
N=4
Source: NFER survey of literacy coordinators, 2012
15
Table 7 The number of hours per week schools spent teaching phonics in Reception if it is taught to some, but not all, pupils [filter question based on the proportion
responding ‘no’ in Table 3 above]
Statistic
N
Mean 1.5
Median 1.5
Std. Deviation 0.5
No response 1
N=4
[image:15.595.90.317.132.234.2]Source: NFER survey of literacy coordinators, 2012
Table 8 The number of schools reporting phonics is taught to all pupils in Year 1
Schools reported
%
Yes 95
No 1
Missing 4
N=844
Source: NFER survey of literacy coordinators, 2012
Due to percentages being rounded to the nearest integer, they may not sum to 100
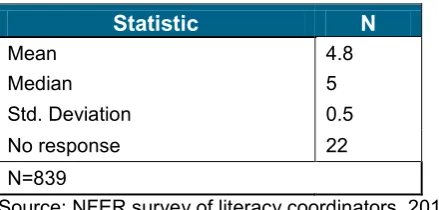
Table 9 The number of days per week schools spent teaching phonics in Year 1 [filter question based on proportion responding ‘yes’ in Table 8 above]
Statistic
N
Mean 4.8
Median 5
Std. Deviation 0.5
No response 22
N=839
Source: NFER survey of literacy coordinators, 2012
Table 10 The number of hours per week schools spent teaching phonics in Year 1 [filter question based on proportion responding ‘yes’ in Table 8 above]
Statistic
N
Mean 2.2
Median 2
Std. Deviation 1.1
No response 82
N=839
[image:15.595.91.311.442.547.2]16
Table 11 The number of schools reporting phonics is taught to only some pupils in Year 1 [filter question based on proportion responding ‘no’ in Table 8 above]
Schools reported
%
Yes 80
No <1
Missing 20
N=5
Source: NFER survey of literacy coordinators, 2012
Due to percentages being rounded to the nearest integer, they may not sum to 100
Table 12 The number of hours per week schools spent teaching phonics in Year 1 if it is taught to some, but not all, pupils [filter question based on proportion responding ‘yes’ in Table 11 above]
Statistic
N
Mean 1.6
Median 1.6
Std. Deviation 0.4
No response 1
N=5
Source: NFER survey of literacy coordinators, 2012
Table 13 The number of schools reporting phonics is taught to all pupils in Year 2
Schools reported
%
Yes 93
No 2
Missing 6
N=844
Source: NFER survey of literacy coordinators, 2012
Due to percentages being rounded to the nearest integer, they may not sum to 100
Table 14 The number of days per week schools spent teaching phonics in Year 2 [filter question based on proportion responding ‘yes’ in Table 13 above]
Statistic
N
Mean 4.7
Median 5
Std. Deviation 0.7
No response 36
N=830
17
Table 15 The number of hours per week schools spent teaching phonics in Year 2 [filter question based on proportion responding ‘yes’ in Table 13 above]
Statistic
N
Mean 2.1
Median 2
Std. Deviation 1.0
No response 93
N=830
Source: NFER survey of literacy coordinators, 2012
Table 16 The number of schools reporting phonics is taught to only some, but not all, pupils in Year 2 [filter question based on proportion responding ‘no’ in Table 13 above]
Schools reported
%
Yes 72
No <1
Missing 29
N=14
Source: NFER survey of literacy coordinators, 2012
Due to percentages being rounded to the nearest integer, they may not sum to 100
Table 17 The number of hours per week schools spent teaching phonics in Year 2 if it is taught to some, but not all, pupils [filter question based on proportion responding ‘yes’ in Table 16 above]
Statistic
N
Mean 2.3
Median 2.1
Std. Deviation 1.1
No response 4
N=14
Source: NFER survey of literacy coordinators, 2012
Table 18 The number of schools reporting phonics is taught to all pupils in Year 3
Schools reported
%
Yes 36
No 34
Missing 30
N=844
Source: NFER survey of literacy coordinators, 2012
18
Table 19 The number of days per week schools spent teaching phonics in Year 3 [filter question based on proportion responding ‘yes’ in Table 18 above]
Statistic
N
Mean 3.9
Median 4
Std. Deviation 1.3
No response 256
N=561
Source: NFER survey of literacy coordinators, 2012
Table 20 The number of hours per week schools spent teaching phonics in Year 3 [filter question based on proportion responding ‘yes’ in Table 18 above]
Statistic
N
Mean 1.6
Median 1.3
Std. Deviation 1.0
No response 276
N=561
Source: NFER survey of literacy coordinators, 2012
Table 21 The number of schools reporting phonics is taught to some, but not all, pupils in Year 3 [filter question based on proportion responding ‘no’ in Table 18 above]
Schools reported
%
Yes 86
No 4
Missing 10
N=283
Source: NFER survey of literacy coordinators, 2012
Due to percentages being rounded to the nearest integer, they may not sum to 100
Table 22 The number of hours per week schools spent teaching phonics in Year 3 if it is taught to some, but not all, pupils [filter question based on Table 21 above]
Statistic
N
Mean 1.7
Median 1.3
Std. Deviation 1.1
No response 58
N=272
19
Table 23 The number of schools reporting phonics is taught to all pupils in Year 4
Schools reported
%
Yes 24
No 42
Missing 35
N=844
Source: NFER survey of literacy coordinators, 2012
Due to percentages being rounded to the nearest integer, they may not sum to 100
Table 24 The number of days per week schools spent teaching phonics in Year 4 [filter question based on Table 23 above]
Statistic
N
Mean 3.8
Median 4
Std. Deviation 1.4
No response 290
N=494
Source: NFER survey of literacy coordinators, 2012
Table 25 The number of hours per week schools spent teaching phonics in Year 4 [filter question based on Table 23 above]
Statistic
N
Mean 1.5
Median 1.3
Std. Deviation 1.0
No response 305
N=494
Source: NFER survey of literacy coordinators, 2012
Table 26 The number of schools reporting phonics is taught to some, but not all, pupils in Year 4 [filter question from Table 23 above]
Schools reported
%
Yes 79
No 8
Missing 13
N=350
Source: NFER survey of literacy coordinators, 2012
20
Table 27 The number of hours per week schools spent teaching phonics in Year 4 if it is taught to some, but not all, pupils [filter question based on Table 26 above]
Statistic
N
Mean 1.7
Median 1.3
Std. Deviation 0.4
No response 75
N=321
Source: NFER survey of literacy coordinators, 2012
Table 28 The number of schools reporting phonics is taught to all pupils in Year 5 and 6
Schools reported
%
Yes 15
No 44
Missing 41
N=844
Source: NFER survey of literacy coordinators, 2012
Due to percentages being rounded to the nearest integer, they may not sum to 100
Table 29 The number of days per week schools spent teaching phonics in Year 5 and 6 [filter question based on Table 28 above]
Statistic
N
Mean 3.6
Median 4
Std. Deviation 1.5
No response 345
N=473
Source: NFER survey of literacy coordinators, 2012
Table 30 The number of hours per week schools spent teaching phonics in Year 5 and 6 [filter question based on Table 28 above]
Statistic
N
Mean 1.4
Median 1.0
Std. Deviation 1.0
No response 350
N=473
21
Table 31 The number of schools reporting phonics is taught to some, but not all, pupils in Year 5 and 6 [filter question from Table 28 above]
Statistic
%
Yes 65
No 18
Missing 18
N=371
Source: NFER survey of literacy coordinators, 2012
Due to percentages being rounded to the nearest integer, they may not sum to 100
Table 32 The number of hours per week schools spent teaching phonics in Year 5 and 6 if it is taught to some, but not all, pupils [filter question based on Table 31]
Statistic
N
Mean 1.6
Median 1.3
Std. Deviation 1.1
No response 97
N=306
Source: NFER survey of literacy coordinators, 2012
Table 33 The number of schools reporting phonics is taught in discrete phonics sessions in Reception
Schools reported
%
Yes 90
No 1
Missing 9
N=844
Source: NFER survey of literacy coordinators, 2012
Due to percentages being rounded to the nearest integer, they may not sum to 100
Table 34 The number of hours per week schools spent teaching phonics discretely in Reception [filter question based on Table 33 above]
Statistic
N
Mean 2.5
Median 1.5
Std. Deviation 2.7
No response 482
N=840
22
Table 35 The number of schools reporting phonics is taught integrated into other work in Reception
Schools reported
%
Yes 59
No 3
Missing 39
N=844
Source: NFER survey of literacy coordinators, 2012
Due to percentages being rounded to the nearest integer, they may not sum to 100
Table 36 The number of hours per week schools spent teaching phonics integrated into other work in Reception [filter question based on Table 35 above]
Statistic
N
Mean 2.5
Median 1.5
Std. Deviation 2.7
No response 461
N=823
Source: NFER survey of literacy coordinators, 2012
Table 37 The number of schools reporting phonics is taught in discrete phonics sessions in Year 1
Schools reported
%
Yes 90
No <1
Missing 9
N=844
Source: NFER survey of literacy coordinators, 2012
Due to percentages being rounded to the nearest integer, they may not sum to 100
Table 38 The number of hours per week schools spent teaching phonics discretely in Year 1 [filter question based on Table 37 above]
Statistic
N
Mean 2.6
Median 1.8
Std. Deviation 2.7
No response 475
N=841
23
Table 39 The number of schools reporting phonics is taught integrated into other work in Year 1
Schools reported
%
Yes 59
No 3
Missing 39
N=844
Source: NFER survey of literacy coordinators, 2012
Due to percentages being rounded to the nearest integer, they may not sum to 100
Table 40 The number of hours per week schools spent teaching phonics integrated into other work in Year 1 [filter question based on Table 39 above]
Statistic
N
Mean 2.6
Median 1.8
Std. Deviation 2.7
No response 452
N=821
Source: NFER survey of literacy coordinators, 2012
Table 41 The number of schools reporting phonics is taught in discrete phonics sessions in Year 2
Schools reported
%
Yes 87
No 1
Missing 11
N=844
Source: NFER survey of literacy coordinators, 2012
Due to percentages being rounded to the nearest integer, they may not sum to 100
Table 42 The number of hours per week schools spent teaching phonics discretely in Year 2 [filter question based on Table 41 above]
Statistic
N
Mean 2.5
Median 1.5
Std. Deviation 2.6
No response 485
N=833
24
Table 43 The number of schools reporting phonics is taught integrated into other work in Year 2
Schools reported
%
Yes 56
No 3
Missing 41
N=844
Source: NFER survey of literacy coordinators, 2012
Due to percentages being rounded to the nearest integer, they may not sum to 100
Table 44 The number of hours per week schools spent teaching phonics integrated into other work in Year 2 [filter question based on Table 43 above]
Statistic
N
Mean 2.5
Median 1.5
Std. Deviation 2.6
No response 467
N=823
Source: NFER survey of literacy coordinators, 2012
Table 45 The number of schools reporting phonics is taught in discrete phonics sessions in Year 3
Schools reported
%
Yes 45
No 15
Missing 40
N=844
Source: NFER survey of literacy coordinators, 2012
Due to percentages being rounded to the nearest integer, they may not sum to 100
Table 46 The number of hours per week schools spent teaching phonics discretely in Year 3 [filter question based on Table 45 above]
Statistic
N
Mean 2.4
Median 1.5
Std. Deviation 2.6
No response 535
N=721
25
Table 47 The number of schools reporting phonics is taught integrated into other work in Year 3
Schools reported
%
Yes 40
No 6
Missing 54
N=844
Source: NFER survey of literacy coordinators, 2012
Due to percentages being rounded to the nearest integer, they may not sum to 100
Table 48 The number of hours per week schools spent teaching phonics integrated into other work in Year 3 [filter question based on Table 47 above]
Statistic
N
Mean 2.3
Median 1.3
Std. Deviation 2.5
No response 552
N=795
Source: NFER survey of literacy coordinators, 2012
Table 49 The number of schools reporting phonics is taught in discrete phonics sessions in Year 4
Schools reported
%
Yes 33
No 21
Missing 46
N=844
Source: NFER survey of literacy coordinators, 2012
Due to percentages being rounded to the nearest integer, they may not sum to 100
Table 50 The number of hours per week schools spent teaching phonics discretely in Year 4 [filter question based on Table 49 above]
Statistic
N
Mean 2.3
Median 1.5
Std. Deviation 2.6
No response 512
N=666
26
Table 51 The number of schools reporting phonics is taught integrated into other work in Year 4
Schools reported
%
Yes 36
No 8
Missing 56
N=844
Source: NFER survey of literacy coordinators, 2012
Due to percentages being rounded to the nearest integer, they may not sum to 100
Table 52 The number of hours per week schools spent teaching phonics integrated into other work in Year 4 [filter question based on Table 51 above]
Statistic
N
Mean 2.2
Median 1.0
Std. Deviation 2.4
No response 551
N=774
Source: NFER survey of literacy coordinators, 2012
Table 53 The number of schools reporting phonics is taught in discrete phonics sessions in Year 5 and 6
Schools reported
%
Yes 23
No 25
Missing 52
N=844
Source: NFER survey of literacy coordinators, 2012
Due to percentages being rounded to the nearest integer, they may not sum to 100
Table 54 The number of hours per week schools spent teaching phonics discretely in Year 5 and 6 [filter question based on Table 53 above]
Statistic
N
Mean 2.5
Median 1.5
Std. Deviation 2.9
No response 528
N=637
27
Table 55 The number of schools reporting phonics is taught integrated into other work in Year 5 and 6
Schools reported
%
Yes 31
No 10
Missing 58
N=844
Source: NFER survey of literacy coordinators, 2012
Due to percentages being rounded to the nearest integer, they may not sum to 100
Table 56 The number of hours per week schools spent teaching phonics integrated into other work in Year 5 and 6 [filter question based on Table 55 above]
Statistic
N
Mean 2.2
Median 1.0
Std. Deviation 2.5
No response 575
N=756
Source: NFER survey of literacy coordinators, 2012
Table 57 Agreement with given statements characterising the school’s approach to phonics within early literacy teaching
Statement %
Systematic synthetic phonics is taught ‘first
and fast’ 53
Phonics is taught discretely alongside other
cueing strategies 26
Phonics is always integrated as one of a range
of cueing strategies 5
No response 17
N=844
Source: NFER survey of literacy coordinators, 2012
28
Table 58 Schools’ use of published phonics resources (in addition to ‘core’ programmes)
Resource % ticking resource Supplementary phonics
programmes or resources 70 Decodable readers 71 Catch-up resources 52
None ticked 9
N=844
Source: NFER survey of literacy coordinators, 2012
More than one answer could be given so percentages may sum to more than 100
Table 59 Number of published phonics resources (in addition to ‘core’ programmes) schools used
Number of
resources %
1 24
2 32
3 35
None ticked 9 N=844
Source: NFER survey of literacy coordinators, 2012
Due to percentages being rounded to the nearest integer, they may not sum to 100
Table 60 Number of schools who have made changes to phonics teaching in anticipation of the check
Response %
Changes made 34 No changes made 65 No response 1 N=844
Source: NFER survey of literacy coordinators, 2012
29
Table 61 Types of changes made by schools in anticipation of the check [filter question from Table 60 above]
Type of change respondents % of Adopted a new mainstream phonics programme 26
Started to use phonics programme more systematically 39 Increased the time devoted to phonics teaching 46 Increased the frequency of phonics teaching 34 Increased the number or length of discrete phonics
sessions 26
Changed to teaching phonics ‘first and fast’ 16 Increased assessment of progress in phonics 48
Other (please specify) 26
None ticked 7
N=292
Source: NFER survey of literacy coordinators, 2012
More than one answer could be given so percentages may sum to more than 100
Table 62 Types of changes made by schools in anticipation of the check where ‘other changes’ were indicated [filter question from Table 61 above]
Type of change % of respondents
Use of "Phonics Play" Resources 4 Introduced nonsense words into phonics reading 47 Introduced grouping or streaming 16
CLLD Project 1
Timetable Re-organisation 3
Staff Training/CPD 3
Purchased new resources 5
Phonetically decodeable books 1
Early Screening Programme 1
Practice Tests 3
Increased pace of learning 5
Extra interventions 3
Focus on phoneme spotting 3
Focus on articulation 1
Changes had already taken place 1
Extra Staff 1
Support from ECAR teacher 1
Whole school priority 1
No response 4
N=75
Source: NFER survey of literacy coordinators, 2012
30
Table 63 Year groups in which changes were made in anticipation of the check [filter question from Table 61 above]
Year group respondents % of
Reception 66
Year 1 94
Year 2 63
Key Stage 2 year groups 24
None ticked 2
N=292
Source: NFER survey of literacy coordinators, 2012
More than one answer could be given so percentages may sum to more than 100
Table 64 The point in the year in which changes were made [filter question from Table 60 above]
Year group respondents % of
Autumn term 42 Spring term 38 Summer term 9 No response 11 N=292
Source: NFER survey of literacy coordinators, 2012
Due to percentages being rounded to the nearest integer, they may not sum to 100
Table 65 The number of teachers in the school who have received externally provided training focused on the teaching of phonics in the school year 2011/12
Training received %
Yes 47
No 51
No response 1 N=844
Source: NFER survey of literacy coordinators, 2012
31
Table 66 Other than external training, other ways literacy coordinators reported staff learnt about phonics teaching in the school year 2011/-12
Method of learning respondents % of
Individual reading / private study 39 In-school workshop or training 49
Staff meeting 56
Key stage or year group planning
meeting 50
Other (please specify) 5
None ticked 13
N=844
Source: NFER survey of literacy coordinators, 2012
More than one answer could be given so percentages may sum to more than 100
Table 67 Other than external training, other ways literacy coordinators reported staff learnt about phonics teaching in the school year 2011/12, when ‘other’ was indicated [filter question from Table 66 above]
Method of learning Respondents % of
DfE website 7
Professional Day 2
Peer Working 14
Training Courses 26
Observation 14
Visiting other local schools 7
Lesson Study 2
Local Authority Updates 12 Early Reading Project for Year 1 2 Literacy Network Groups 2
Webinar 2
Reference to ARA phonics 2
Coaching 2
Training Video 2
‘None’ 14
No response 2
N=43
Source: NFER survey of literacy coordinators, 2012
32
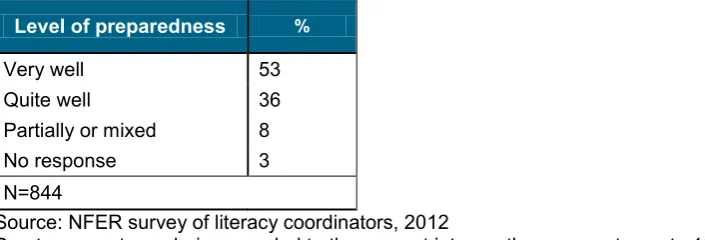
Table 68 How well literacy coordinators felt staff in their schools were prepared to provide effective phonics teaching
Level of preparedness %
Very well 53
Quite well 36
Partially or mixed 8
No response 3
N=844
Source: NFER survey of literacy coordinators, 2012
Due to percentages being rounded to the nearest integer, they may not sum to 100
Table 69 The proportion of teachers who were in schools which gave access to externally provided training focused on the phonics screening check
Training attended %
Yes, provided by the local
authority 50
Yes, provided by another
provider 5
No 44
No response 2
N=844
Source: NFER survey of literacy coordinators, 2012
Due to percentages being rounded to the nearest integer, they may not sum to 100
Table 70 How did Year 1 teachers in the school prepare for the phonics screening check
Method of preparation Respondents % of
Individual familiarisation with the Check Administrators’
Guide 97
Watching the online video: Scoring the Year 1 phonics
screening check training 82
Discussion with Literacy Coordinator 61 Year group or key stage meeting 56
Other (please specify) 13
None ticked 1
N=844
Source: NFER survey of literacy coordinators, 2012
[image:32.595.90.433.517.720.2]33
Table 71 How did Year 1 teachers in the school prepare for the phonics screening check, responses of those who ticked ‘other’ [filter question from Table 70 above]
Method of preparation Respondents % of
Parents Meeting 5
Staff Discussions 40
Feedback from training 6
Pilot 2
Cluster meetings 11
Video 1
Practice Check 9
Collaboration with other schools 4
Moderation Meetings 5
Mentor Meetings 1
Briefing at LEA 7
Work with PTL 1
Workshops 4
Online Webinar 1
Letters to parents 1
RWI Trainer 1
Course to deliver check 1
SLT meeting 1
Contacted helpline 1
Did not take part 12
‘None’ 1
Other relevant/vague comment 4
No response 7
N=106
Source: NFER survey of literacy coordinators, 2012
34
Table 72 The actions that will be taken to use the results of the check within the
schoolAction to be taken
Respondents % ofReview of results by individual Year 1 teacher 81 Review/revision of teaching plans by individual Year 1
teacher 48
Discussion amongst Year 1 teachers 54 Discussion between Year 1 teacher(s) and Literacy
Coordinator, headteacher or other senior leader 88 Identification of children experiencing difficulties with phonics 80 Specific teaching plans for children experiencing difficulties
with phonics 61
Discussion between Year 1 and Year 2 teachers 79 Review/revision of teaching plans by Year 2 teacher(s) 48 Discussion between Year 1 and Reception teachers 62
Other 8
None ticked 2
N=844
Source: NFER survey of literacy coordinators, 2012
35
Table 73 The actions that will be taken to use the results of the check within the school by those who indicated ‘other’ actions [filter question from Table 72 above]
Action to be taken Respondents % of Aware without the screening 28
Feedback to SENCO 5
Identification done on a day-to-day basis 5
Full staff discussion 9
Continue phonics intervention 11
Continue own check 5
Grouping for Read Write Inc 5 Review of phonics teaching 8 Identify common mistakes to put in next year's
plan 3
Re-organise timetable 3
Buy new resources 2
Evaluation of results to identify training needs 9
Advice for parents 2
Mixed age classes 3
Streaming 5
New Staff 3
Network meetings (Pyramid) 2
Run QUEST Programme 2
One-to-one support 5
Focus on nonsense words 2
Re-test 2
Introduce phonics in Key Stage 2 2
‘None’ 2
Other relevant/vague comment 5 N=66
Source: NFER survey of literacy coordinators, 2012
More than one answer could be given so percentages may sum to more than 100
Table 74 Descriptive statistics for the financial cost (£s) of administering the check reported within schools
Statistic
N
Mean 744
Median 400
Std. Deviation 1384
Minimum 0
Maximum 20400
N=513
36
Table 75 Descriptive statistics for the time cost (hours) of administering the check reported within schools
Statistic
N
Mean 8.4
Median 6
Std. Deviation 9.3
Minimum 0
Maximum 90
N=593
Source: NFER survey of literacy coordinators, 2012
Table 76 Information provided to parents/carers prior to the administration of the check
Information Respondents % of
Information on how parents/carers can help with their child’s
phonics learning 57
Information about how the check is administered 47 Information about what is expected of their child 38 Information on how the data will be used 21
None ticked 25
N=844
Source: NFER survey of literacy coordinators, 2012
More than one answer could be given so percentages may sum to more than 100
Table 77 How information was communicated to parents/carers after the administration of the check
Method of Communication Respondents % of
As part of the child’s individual end of year written
report 66
In a separate letter to parents/carers 37 In informal discussion with parent(s)/carer(s) 25 At parents’/carers’ evening / meeting 24
Other 3
None ticked 2
N=844
Source: NFER survey of literacy coordinators, 2012
37
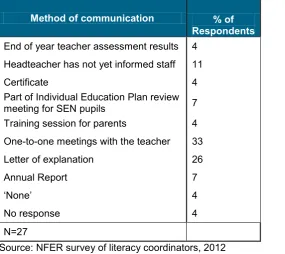
Table 78 How information was communicated to parents/carers after the administration of the check by those who responded ‘other’ [filter question from Table 77 above]
Method of communication % of Respondents End of year teacher assessment results 4
Headteacher has not yet informed staff 11
Certificate 4
Part of Individual Education Plan review meeting for SEN pupils 7 Training session for parents 4 One-to-one meetings with the teacher 33 Letter of explanation 26
Annual Report 7
‘None’ 4
No response 4
N=27
Source: NFER survey of literacy coordinators, 2012
[image:37.595.91.377.113.367.2]More than one answer could be given so percentages may sum to more than 100
Table 79 The additional information given to parents/carers of the children who were shown to require support
Additional Information Respondents % of
Information about the type of in-school support planned 61 Information about how they can support their child 73
None ticked 19
N=844
Source: NFER survey of literacy coordinators, 2012
38
Table 80 Literacy Coordinator agreement with the statement ‘I am convinced of the value of systematic synthetic phonics teaching’
Level of agreement %
Agree 64
Agree somewhat 25 Uncertain or mixed views 6 Disagree somewhat 1
Disagree 1
No response 2
N=844
Source: NFER survey of literacy coordinators, 2012
Due to percentages being rounded to the nearest integer, they may not sum to 100
Table 81 Literacy Coordinator agreement with the statement ‘Phonics should always be taught in the context of meaningful reading’
Level of agreement %
Agree 63
Agree somewhat 23 Uncertain or mixed views 7 Disagree somewhat 4
Disagree 2
No response 2
N=844
Source: NFER survey of literacy coordinators, 2012
Due to percentages being rounded to the nearest integer, they may not sum to 100
Table 82 Literacy Coordinator agreement with the statement ‘Phonics has too high a priority in current education policy’
Level of agreement %
Agree 12
Agree somewhat 24 Uncertain or mixed views 17 Disagree somewhat 23
Disagree 22
No response 3
N=844
Source: NFER survey of literacy coordinators, 2012
39
Table 83 Literacy Coordinator agreement with the statement ‘A variety of different methods should be used to teach children to decode words’
Level of agreement %
Agree 67
Agree somewhat 22 Uncertain or mixed views 5 Disagree somewhat 2
Disagree 3
No response 1
N=844
Source: NFER survey of literacy coordinators, 2012
Due to percentages being rounded to the nearest integer, they may not sum to 100
Table 84 Literacy Coordinator agreement with the statement ‘Systematic phonics teaching is necessary only for some children’
Level of agreement %
Agree 7
Agree somewhat 19
Uncertain or mixed views 15 Disagree somewhat 26
Disagree 29
No response 3
N=844
Source: NFER survey of literacy coordinators, 2012
Due to percentages being rounded to the nearest integer, they may not sum to 100
Table 85 Literacy Coordinator agreement with the statement ‘The phonics screening check provides valuable information for teachers’
Level of agreement %
Agree 8
Agree somewhat 18 Uncertain or mixed views 21 Disagree somewhat 20
Disagree 32
No response 1
N=844
Source: NFER survey of literacy coordinators, 2012
40
Table 86 Literacy Coordinator agreement with the statement ‘The phonics screening check provides valuable information for parents’
Level of agreement %
Agree 4
Agree somewhat 12 Uncertain or mixed views 24 Disagree somewhat 22
Disagree 36
No response 1
N=844
Source: NFER survey of literacy coordinators, 2012
41
Teacher Questionnaire - Data tables
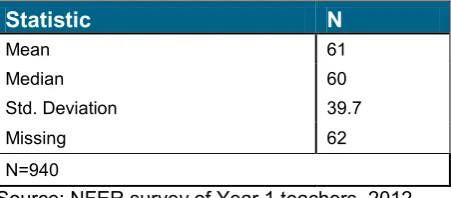
Table 1 Percentage of pupils who reached the required standard as reported by participating Year 1 teachers
Statistic N
Mean 61
Median 60
Std. Deviation 39.7
Missing 62
N=940
[image:41.595.91.304.164.269.2]Source: NFER survey of Year 1 teachers, 2012
Table 2 Descriptive statistics for percentage of pupils who reached the required standard
Statistic
N
Mean 61
Median 60
Std. Deviation 39.7
Missing 62
N=940
Source: NFER survey of Year 1 teachers, 2012
Table 3 Year 1 teachers’ reactions to the standard of the check
Judgement %
Slightly too easy 1
It is about right 44
Slightly too difficult 40
Much too difficult 11
Total 96
System 4
N=940
Source: NFER survey of Year 1 teachers, 2012
[image:41.595.92.318.330.429.2]42
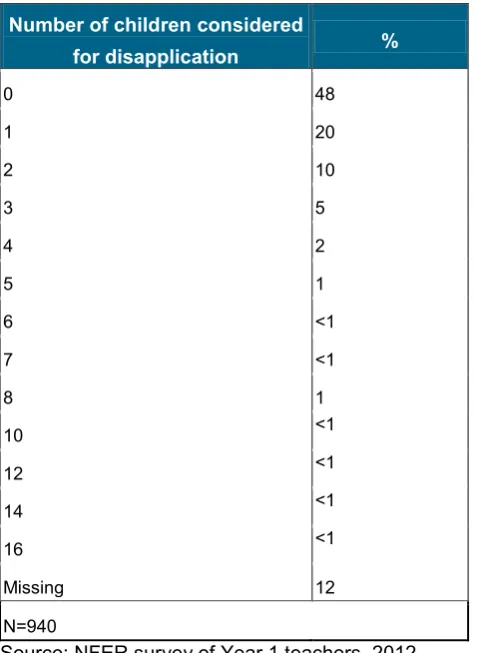
Table 4 The number of pupils considered for disapplication from the check by individual Year 1 teachers
Number of children considered
for disapplication %
0 48
1 20
2 10
3 5
4 2
5 1
6 <1
7 <1
8 1
10 <1
12 <1
14 <1
16 <1
Missing 12
N=940
Source: NFER survey of Year 1 teachers, 2012
43
Table 5 The number of pupils actually disapplied from the check by individual Year 1 teachers [filter based on Table 4 above]
Number of children disapplied %
0 40
1 33
2 14
3 6
4 1
5 2
6 1
8 1
10 1
14 <1
16 <1
Missing 1
N=379
Source: NFER survey of Year 1 teachers, 2012
Due to percentages being rounded to the nearest integer, they may not sum to 100
Table 6 The people involved in the decision to disapply children from the check [filter based on Table 4 above]
Person involved Respondents % of
You (the Year 1 teacher) 91
The headteacher 72
The literacy coordinator 33
The child's parents/carers 20
Other (please specify) 24
None ticked 3
N=379
Source: NFER survey of Year 1 teachers, 2012
[image:43.595.92.320.480.651.2]44
Table 7 The people involved in the decision to disapply children from the check, based on those who indicated ‘other’ [filter question based on Table 6 above]
People involved Respondents % of
Learning Support Assistant (LSA) 1
You and Colleague 2
Key Stage 1 Coordinator 8
Special Educational Needs Coordinator (SENCO) 31
Local Authority SEN 1
Deputy Headteacher 16
Training Coordinator 1
Local Authority Assessment Department 2
Assessment Team 2
Speech and Language Therapist 2
PD Advisor 1
Unaware that this was an option 1
DfE 1
Phonics Leader 3
Foundation Stage Teacher 2
INA 1
Head of Department 1
Child's Support Assistant 8
Assistant Head Lit Coordinator 1
Moderator 1
Social Worker 1
Inclusion Manager 1
Hearing Unit Teacher in Charge 2
Deputy Head of Key Stage 1 1
Assistant Head of Year 1 1
School Governors 1
Reading Recovery Teacher 1
Other relevant/vague comment 1
Irrelevant/Uncodeable 2
No response 11
N=92
Source: NFER survey of Year 1 teachers, 2012
45
Table 8 The mechanisms for parental involvement in disapplication [filter question based on Table 4 above]
Mechanism for involvement Respondents % of
Talking with you 23
Talking with the headteacher 6
Talking with the literacy coordinator 3
Other (please specify) 4
Not applicable 45
None ticked 30
N=379
Source: NFER survey of Year 1 teachers, 2012
More than one answer could be given so percentages may sum to more than 100
Table 9 Reasons given for disapplying children from the screening check [filter question based on Table 4 above]
Reason given Respondents % of
They showed a lack of understanding of grapheme-phoneme
correspondences 43
The child only uses British Sign Language (BSL) or other sign
supported communication to spell out individual letters 4
The child has selective mutism 5
Other (please specify) 27
None ticked 43
N=379
Source: NFER survey of Year 1 teachers, 2012
[image:45.595.84.441.361.532.2]46
Table 10 Reasons given for disapplying children from the screening check, when ‘other’ was indicated [filter question based on Table 9 above]
Reason given % of Respondents
Child not yet Level 1 9
Speech and Language Needs 13
Developmental Delay 6
Autistic 10
No understanding of sound 4
On School Action Plans 1
Downs Syndrome 4
Child does not speak English 24
Speech Difficulty 2
Year 2 in a Year 1 class 1
Psychological Condition 1
Child under consideration for statutory assessment 2
Child is unable to speak 8
SEN Registered learning difficulty 31
Left School 1
CODE REMOVED 1
Struggles with concentration 1
Personal Reasons 3
Child has not been taught phonics 4
Parental Choice 1
Missing 2
N=103
Source: NFER survey of Year 1 teachers, 2012
More than one answer could be given so percentages may sum to more than 100
Table 11 The criterion applied to make a judgement of a child having no grapheme-phoneme correspondence [filter question based on Table 4 above]
Criterion given %
The child had not yet developed letter sound
recognition 22
The child had basic letter sound recognition 8
The child had basic letter sound recognition but was
unable to fully blend 15
Other (please specify) 3
No response 52
N=379
Source: NFER survey of Year 1 teachers, 2012
[image:46.595.89.437.573.734.2]47
Table 12 The criterion applied to make a judgement of a child having no grapheme-phoneme correspondence when the respondent indicated ‘other’ [filter question based on Table 11 above]
Source: NFER survey of Year 1 teachers, 2012
[image:47.595.91.264.431.588.2]More than one answer could be given so percentages may sum to more than 100
Table 13 The ease of judging if and when to stop the check early due to a child struggling
%
Very hard 2
Quite hard 3
Mixed 8
Quite easy 30
Very easy 23
NA 33
No response 1
N=940
Source: NFER survey of Year 1 teachers, 2012
Due to percentages being rounded to the nearest integer, they may not sum to 100 Criterion given % of Respondents
Child very easily upset 8
Selective Mute 8
Child doesn't speak English 8
Special Needs 17
Speech Difficulties 8
Hearing Difficulties 8
Reads in Recognition only 8
Non-Verbal 17
Additional SEN support in place 17
No response 8
48
Table 14 The descriptive statistics for the number of children with whom Year 1 teachers stopped the check early
Statistic
N
Mean 1.6
Median 1.0
Std. Deviation 2.4
Missing 131
N=940
Source: NFER survey of Year 1 teachers, 2012
Table 15 Factors which influenced teachers’ judgements about if and when to end the check
Factors influencing judgement % of Respondents
If the child was beginning to struggle 59
If the child got several words in a row incorrect 46
If the child was becoming tired or distracted 40
If the child had taken a long time to answer a question 12
If the child was taking too long to complete the check 8
If it became obvious the child was not going to reach the
expected threshold 47
Other (please specify) 12
None ticked 19
N=940
Source: NFER survey of Year 1 teachers, 2012
49
Table 16 Factors which influenced teachers’ judgements about if and when to end the check when respondent indicated ‘other’ [filter question based on Table 15 above]
Factors influencing judgement % of respondents
If child became distressed 36
If child showed negativity 10
If child was unable to blend 7
If child showed anxiety in test conditions 9
EAL child 6
Child showed closed body language 1
If child loses concentration 3
If the child is unfamiliar with a phase 10
Child struggling to access the test due to SEN 3
Child asks to stop 4
Child already in Reading Recovery 1
Child reads on sight 1
Decided in advance whether or not child takes the
test 4
Child still struggles after a break 1
‘None’ 1
Other relevant/vague comment 10
No response 11
N=70
Source: NFER survey of Year 1 teachers, 2012
More than one answer could be given so percentages may sum to more than 100
Table 17 The proportion of teachers who reported having experience of administering the check with the relevant group of pupils
Group of pupils % of respondents
Pupils with sight impairments 18
Pupils with hearing impairments 21
Pupils with speech, language
and communication needs 66
Pupils with other learning
difficulties 66
Pupils with EAL 49
N=940
Source: NFER survey of Year 1 teachers, 2012
50
Table 18 Teachers’ judgements of the suitability of the check for pupils with sight impairments
Teachers’ judgement %
Very unsuitable 19
Quite unsuitable 16
Average suitability 20
Quite suitable 35
Very suitable 9
N=172
Source: NFER survey of Year 1 teachers, 2012
[image:50.595.90.305.325.460.2]Due to percentages being rounded to the nearest integer, they may not sum to 100
Table 19 Teachers’ judgements of the suitability of the check for pupils with hearing impairments
Teachers’ judgement %
Very unsuitable 21
Quite unsuitable 17
Average suitability 20
Quite suitable 31
Very suitable 11
N=196
Source: NFER survey of Year 1 teachers, 2012
Due to percentages being rounded to the nearest integer, they may not sum to 100
Table 20 Teachers’ judgements of the suitability of the check for pupils with speech, language and communication needs
Teachers’ judgement %
Very unsuitable 19
Quite unsuitable 31
Average suitability 26
Quite suitable 22
Very suitable 2
N=616
Source: NFER survey of Year 1 teachers, 2012
51
Table 21 Teachers’ judgements of the suitability of the check for pupils with other learning difficulties
Teachers’ judgement %
Very unsuitable 21
Quite unsuitable 29
Average suitability 27
Quite suitable 21
Very suitable 3
N=619
Source: NFER survey of Year 1 teachers, 2012
Due to percentages being rounded to the nearest integer, they may not sum to 100
Table 22 Teachers’ judgements of the suitability of the check for pupils with English as an additional language
Teachers’ judgement %
Very unsuitable 13
Quite unsuitable 22
Average suitability 30
Quite suitabl
![Table 11 The number of schools reporting phonics is taught to only some pupils in Year 1 [filter question based on proportion responding ‘no’ in Table 8 above]](https://thumb-us.123doks.com/thumbv2/123dok_us/165226.42370/16.595.91.308.601.699/table-number-schools-reporting-phonics-question-proportion-responding.webp)
![Table 71 How did Year 1 teachers in the school prepare for the phonics screening check, responses of those who ticked ‘other’ [filter question from Table 70 above]](https://thumb-us.123doks.com/thumbv2/123dok_us/165226.42370/33.595.92.353.115.480/table-teachers-school-prepare-phonics-screening-responses-question.webp)