Evaluation of the Pupil Learning
Credits Pilot Scheme
Analysis of Pupils’ Progress and Pupil Survey
Responses 2003
Annette Braun, Anne West, Philip Noden and Audrey Hind
Centre for Educational Research
Department of Social Policy
London School of Economics and Political Science
Evaluation of the Pupil Learning
Credits Pilot Scheme
Analysis of Pupils’ Progress and Pupil Survey
Responses 2003
Annette Braun, Anne West, Philip Noden and Audrey Hind
Centre for Educational Research
Department of Social Policy
London School of Economics and Political Science
The views expressed in this report are the authors’ and do not necessarily reflect those of the Department for Education and Skills.
Table of Contents
EXECUTIVE SUMMARY ... 3
1. INTRODUCTION ... 6
2. METHODS ... 8
3. RESULTS FOR PUPILS IN YEAR 9... 9
3.1 VALUE-ADDED ANALYSIS FROM KS2 TO KS3 ... 9
3.2 YEAR 9 PUPIL SURVEY RESULTS... 10
4. RESULTS FOR PUPILS IN YEAR 11... 22
4.1 VALUE-ADDED ANALYSIS OF GCSE EXAMINATION RESULTS... 22
4.2 YEAR 11 PUPILS SURVEY RESULTS... 24
5. CONCLUSIONS AND POLICY IMPLICATIONS... 34
REFERENCES ... 36
ACKNOWLEDGEMENTS ... 37
ANNEX A STATISTICAL MODELLING: BACKGROUND VARIABLES ... 38
ANNEX B TECHNICAL ANNEX (YEAR 9) ... 39
ANNEX C TECHNICAL ANNEX (YEAR 11)... 42
EXECUTIVE SUMMARY
The Pupil Learning Credits (PLC) pilot scheme ran for two academic years from September 2001. The scheme made extra funding available to secondary schools with high levels of known Free School Meals eligibility (FSM). Its main objective was to provide additional educational opportunities to pupils from financially deprived backgrounds in order to enrich and add depth to their learning. Objectives also included promoting inclusion by breaking down barriers preventing disadvantaged pupils from taking part in activities their peers take for granted. It also aimed to provide them with the means (such as through raising self-confidence and self-esteem and improved attitudes to learning) to improve their levels of attainment.
In Autumn 2001, the Department for Education and Skills (DfES) commissioned a consortium comprising the London School of Economics (LSE) and the National Foundation of Educational Research (NFER) to carry out an evaluation of the PLC pilot scheme; this was completed in Spring 2005. The evaluation involved a number of different strands.1 This report presents findings from analyses of the national value-added dataset and questionnaires completed in 2003 by pupils in Year 9 and Year 11.
Value-added analysis of attainment
• Pupils in PLC schools achieved higher levels of attainment in Year 11 than pupils in non-PLC schools but lower levels of attainment in Year 9. Multilevel modelling using the national value-added dataset was used to compare the academic progress of pupils in PLC schools with the progress of pupils in non-PLC schools.
• Progress to Key Stage 3 and GCSE was examined. It was found that pupils in PLC schools made about one month’s less progress from Key Stage 2 to Key Stage 3 than pupils in other schools.
• The value-added analysis of GCSE examinations found some positive associations between being in a PLC school and some of the outcome measures examined.
• Focusing on progress made from the end of Key Stage 3 to GCSE and controlling for other factors, attending a school receiving PLCs was associated with a 21 per cent improvement in the odds of achieving five or more GCSE passes at grades A* to C in 2003.
1
Pupil survey results
The findings from the surveys compared responses from pupils in Years 9 and 11 in a sample of schools that were part of the PLC pilot scheme with responses from pupils in a sample of comparison schools. Both comparison and PLC schools had at least 35 per cent of pupils on roll (in January 2000) who were known to be eligible for Free School Meals. It is important to note that the analyses identify statistically significant associations but do not establish causation.
Out-of-school-activities
• Pupils were involved in a wide range of out-of-school activities. Sports and ICT activities were particularly widespread. In Year 9, pupils in PLC schools reported more visits to museums, art galleries and the theatre, whilst pupils in comparison schools reported more involvement in out-of-school activities – including ICT, reading/writing, arts and visits to a university. By way of contrast, in Year 11, pupils in PLC schools reported greater involvement than pupils in comparison schools in out-of school activities – computing/ICT, homework clubs, and visits to museums, art galleries and the theatre.
School experience and behaviour
• Aims of the PLC pilot scheme included improving attitudes to learning and promoting inclusion; pupils were thus asked about their views on school and school work and their behaviour in school. Few statistically significant differences were identified between pupils in PLC schools and comparison schools, although Year 9 pupils in PLC schools tended to show a more positive attitude to school work than those in comparison schools whilst the reverse was true for pupils in Year 11. Pupils in both Year 9 and Year 11 in PLC schools reported less bullying than pupils in comparison schools.
Pupils’ views of themselves as learners and as individuals
• Aims of the PLC pilot scheme also included improving pupils’ self-esteem and self-confidence as learners. Where statistically significant differences were identified between pupils in PLC schools and comparison schools they indicated more positive responses for pupils in PLC schools.
Aspirations for the future
• When asked about their parents’ views on education, over three-quarters of pupils surveyed agreed that with the statement that their parents wanted them to stay in education ‘as long as possible’. Year 11 pupils in PLC schools tended to agree with this statement more than pupils in comparison schools.
Conclusions
The data presented in this report suggest that pupils attending schools receiving PLC funding made less academic progress between Key Stages 2 and 3 than their counterparts in other schools. On the other hand, Year 11 pupils in PLC schools were significantly more likely to achieve five or more GCSE passes at grades A* to C than pupils in other schools. In short, pupils in PLC schools performed better than those in non-PLC schools in GCSEs but not at Key Stage 3 even though it was at Key Stage 3 pupils that the policy was targeted.
In addition, it was pupils in Year 11 who were more likely to report participation in extra-curricular activities than those in comparison schools, whilst the reverse was true for the Year 9 pupils; Year 11 pupils in PLC schools also tended to be less positive in terms of their attitudes to school than those in comparison schools, with the reverse being true for the Year 9 pupils.
It would be unwise to draw strong conclusions from the combination of the attainment analysis (which compares attainment in PLC schools with that in all other schools) and the survey comparisons which make comparisons between pupils in small samples of PLC and non-PLC schools.
1. INTRODUCTION
The Pupil Learning Credits (PLC) pilot scheme ran for two academic years from September 2001. The scheme made extra funding available to secondary schools with high levels of known Free School Meals eligibility (FSM). Its objective was to provide additional educational opportunities to pupils from financially deprived backgrounds in order to enrich and add depth to their learning. Another objective was to promote inclusion by breaking down barriers preventing disadvantaged pupils from taking part in activities their peers take for granted. The policy also aimed to provide them with the means (for example, by increasing their self-confidence and self-esteem and improved attitudes to learning) to improve their levels of attainment.
Altogether 260 schools in disadvantaged areas of England were targeted for funding and schools were given maximum flexibility in how to allocate the additional resources, both within and outside the school day. This was based on the premise that, in many ways, schools are the most appropriate body to decide on the use of the funding since they have most knowledge and understanding of their pupils and of the particular local context that may inhibit (or encourage) young people’s learning.
Before the start of the PLC pilot scheme, participating schools received a letter from the Department for Education and Employment (DfEE)2 suggesting that the following activities could be funded through the scheme:
• additional support in the classroom (e.g., teaching assistants);
• educational visits to museums, galleries, and the theatre;
• adventure activities and residential experiences;
• extra tuition in art, music and other performing arts;
• access to computers and educational software, inside and outside school;
• arranging guests/speakers to come and talk to pupils (e.g., on personal health, drugs or special interests/hobbies);
• resources for pupils to use in the home (e.g., books to read for pleasure);
• subscriptions to hobby/interest organisations;
• out-of-school hours enrichment activities provided by the school (e.g., chess/photography clubs); and
• enrolment and equipment for activities not provided by the school (e.g., Guides, karate club).
Schools were also reminded that ‘this is by no means an exhaustive list’ and that they ‘should feel free to try out [their] own ideas’ (DfEE, 2001).
2
In order to qualify for inclusion in the PLC pilot scheme, secondary schools had to be located in one of the 24 Phase 1 Excellence in Cities (EiC) areas3 or in one of six Excellence Cluster areas4 and, in January 2000, had to have at least 35 per cent of pupils on roll who were known to be eligible for Free School Meals. Funding allocations to schools varied according to school size and overall eligibility for Free School Meals levels; allocations averaged £55,769 for the academic year 2001/02 (range £5,167 to £143,697) and £75,000 for 2002/03 (range £6,948 to £193,247). Secondary schools with more than half of their pupils known to be eligible for Free School Meals were entitled to a higher per pupil weighting.
The Department for Education and Skills (DfES) commissioned a consortium comprising the London School of Economics and the National Foundation of Educational Research to carry out an evaluation of the Pupil Learning Credits pilot scheme. The evaluation involved a number of different strands, including telephone interviews with headteachers; questionnaires to pupils in schools that received PLC funding and to pupils in comparison schools (outside EiC Phase 1) that were not receiving these funds; and case studies of a sample of schools in the PLC pilot scheme.5 The evaluation began in Autumn 2001 and was completed in Spring 2005.
This report presents findings from an analysis of pupils’ progress at the end of Year 9 and the end of Year 11 using the national value-added dataset and questionnaires completed in 2003 by pupils in Year 9 and Year 11. It compares the answers of pupils from schools that were part of the PLC pilot scheme with those of pupils in the comparison schools. A wide range of issues was addressed, including pupils’ home background, out-of-school activities, behaviour and self-confidence. Pupils’ attitudes towards school, their aspirations and their plans for the future were also examined. The following section gives a brief outline of the methods. Key findings are reported in Sections 3 and 4, which focus on pupils in Year 9 and Year 11 respectively. Section 5 concludes the report and raises some policy implications.
3
EiC Phase 1 LEAs: Birmingham, Bradford, Camden, Greenwich, Hackney, Hammersmith and Fulham, Haringey, Islington, Kensington and Chelsea, Knowsley, Lambeth, Leeds, Lewisham, Liverpool, Manchester, Newham, Rotherham, Salford, Sheffield, Southwark, Tower Hamlets, Waltham Forest, Wandsworth, Westminster (excludes Corporation of London as it has no state maintained secondary school).
4
Excellence Cluster LEAs included in the PLC pilot scheme: Croydon, Kent, Kirklees, Lancashire, Portsmouth, Walsall.
5
2. METHODS
Two main methods are adopted for the analysis reported in this report. First of all, pupils’ academic progress is examined by means of multi-level modelling using the national value-added datasets for 2003. The analyses reported here make particular reference to pupils in schools receiving PLC funds. Second, data relating to the 2003 surveys of pupils in Year 9 and Year 11 are examined. That is, findings from questionnaires completed by some of the Year 9 pupils who took their Key Stage 3 tests in 2003 and by Year 11 pupils who took their GCSE examinations in 2003 are then presented. The survey data may be seen as characterising the cohorts of pupils included in the attainment analysis. However, the comparison group for the survey data is not all other pupils but rather pupils in the closest comparator schools. Although the characteristics of the PLC survey schools were similar to those of other PLC schools,6 it is important to note that the pupils completing the Year 9 survey were not drawn from the same schools as those completing the Year 11 survey. Similarly the comparison schools were different for the two cohorts.
The PLC pilot scheme was particularly targeted at pupils in Key Stage 3 (aged 11 to 14, Years 7 to 9). From telephone interviews with headteachers and case studies of schools we know that many schools decided to also target the funding on other year groups (see Braun and West, 2004). For this reason analyses related to Year 11 are also included in this report. The samples of pupils from comparison schools were drawn from schools in EiC Phase 2 and Phase 3 areas7 that, in January 2000, had 35 per cent or more pupils on roll who were known to be eligible for Free School Meals. It is important to note that the analyses identify statistically significant associations but do not establish causation; thus differences between PLC and comparison schools should not be assumed to arise from the PLC pilot scheme.
The questionnaires to pupils covered a wide range of areas and topics.8 For the purpose of this report, pupils’ answers to questions of particular relevance to the PLC pilot scheme have been analysed. That is, items relating to participation in additional educational activities that may enrich and add depth to their learning are presented. As was stated earlier, the pilot scheme was intended to promote inclusion and to provide pupils with the means to improve their levels of attainment through, for example, raising self-confidence and self-esteem and improving attitudes to learning. Responses of pupils in PLC schools to items relating to these objectives are therefore compared with those of pupils in comparison schools. This form of comparison was not only intended to assess whether pupils in schools receiving PLC funding reported participating in more enrichment activities but also to provide insight into possible
6
Summary tables comparing some of the characteristics of the PLC survey schools with the characteristics of other PLC schools are included in Annex D.
7
EiC Phase 2 LEAs: Barking and Dagenham, Brent, Bristol, Ealing, Gateshead, Halton, Hartlepool, Kingston upon Hull, Leicester City, Middlesbrough, Newcastle, North Tyneside, Nottingham, Redcar and Cleveland, Rochdale, St Helens, part of Sefton, Solihull, South Tyneside, Stockton-on-Tees, Stoke-on-Trent, Sunderland and Wirral. EiC Phase 3 LEAs: remaining part of Sefton, Sandwell, Hounslow, Wolverhampton, Oldham, Barnsley, Doncaster, Luton, Blackburn with Darwen, Enfield and Blackpool.
8
mechanisms through which any improvement in attainment (identified through the multi-level modelling) might be being delivered.
3.
RESULTS FOR PUPILS IN YEAR 9
3.1 Value-added analysis from KS2 to KS3
In this section key findings from an analysis of the national value-added dataset are presented; these data were analysed using multilevel modelling. The analysis is based on the Key Stage 2 (KS2) to Key Stage 3 (KS3) national value-added results for pupils who took Key Stage 3 national tests in 2001, 2002 and 2003.
Multilevel modelling is a form of regression analysis that takes account of the fact that data are clustered. By allowing for a hierarchical structure of the data, a multilevel modelling approach enables us to control for background factors at different levels (in our case, at individual pupil, school and LEA level).
As part of the evaluation of Excellence in Cities, national data linking the 2001, 2002 and 2003 KS3 results to prior attainment at the end of KS2, and information from the Pupil Level Annual School Census (PLASC) were modelled9 in order to assess the possible impact of EiC on pupils’ progress during KS3. Given that the PLC pilot scheme targeted additional resources on particular schools that were also part of the Excellence in Cities Policy, statistical analyses were undertaken in order to establish any associations between the PLC pilot scheme and various outcomes, having controlled for other variables. The analysis involved two datasets:
• 2003 KS3 outcomes only; and
• 2001, 2002 and 2003 KS3 outcomes.
For both datasets, full prior attainment and PLASC data were available. The inclusion of PLASC data allowed the model to control for a range of pupil background factors (such as ethnicity, known eligibility for Free School Meals and special educational needs status). In addition, the second dataset allowed for the investigation of changes between 2001, 2002 and 2003. Analysis was carried out using multilevel modelling with the following outcome measures as dependent variables, measured in TGAT10 months of progress:
• KS3 average point score;
• KS3 Mathematics point score;
• KS3 English point score; and
• KS3 Science point score.
9
This modelling was carried out by Ian Schagen at NFER; we are grateful to him for allowing us to present extracts in this report (see also Kendall et al., 2005).
10
In effect, the modelling seeks to identify whether the progress made by pupils attending schools participating in the Pupil Learning Credits pilot scheme was different from the progress made by pupils in other schools. The very rich datasets available for the evaluation suggest that we can take account of a very large proportion of the pre-existing differences between pupils, schools and areas.11
Results for the first analyses that considered 2003 outcomes showed no significant differences in relation to schools that were and were not part of the PLC pilot scheme. Analyses using the combined 2001, 2002 and 2003 dataset, however, showed a statistically significant and negative relationship between participation in the pilot scheme and pupil progress in Mathematics in 2002. In addition, it showed a statistically significant negative relationship between being at a PLC school and KS3 average results and also Science results for 2003.
Overall, pupils who took their KS3 national tests in 2002 and 2003 made less progress during KS3 than pupils who completed the Key Stage in 2001. This applied to the three individual subject scores (Mathematics, English and Science) as well as to the average point score. This decline in value-added terms is explained by a rise in KS2 results for the later cohort without a corresponding rise in KS3 scores. Against this backdrop of a relative lack of improvement from 2001 to 2002 and to 2003, pupils in schools that were part of the PLC pilot scheme in addition made progress that was 0.7 of a month less than expected in Mathematics in 2002 and in 2003 0.5 of a month less progress than would be expected in pupils KS3 average score and 1.1 months less progress in Science.
In short, with average point score at KS3 as the dependent variable, where statistically significant associations12 were identified, the decline in pupil progress from 2001 to 2003 was more marked in PLC schools than in non-PLC schools.
3.2 Year 9 pupil survey results
This section presents survey findings from 3538 Year 9 pupils: 1793 pupils from 14 PLC schools and 1745 pupils from 15 comparison schools.13 In the first instance, we explore the characteristics of the sample, in terms of known eligibility for Free School Meals, ethnicity, home circumstances and socio-economic backgrounds. The following sections then focus on responses of pupils in PLC and comparison schools to a range of questions relating to their out-of-school activities; their assessments of their school experiences and behaviour; their perceptions of themselves as learners and as individuals; and their aspirations for the future.
11
In statistical terms, the models account for about 80 per cent of the variation between LEAs, almost 90 per cent of that between schools and 50 per cent of that between pupils.
12
At the 0.05 level or beyond.
13
Characteristics of the pupils
At school level, the proportion of pupils known to be eligible for Free School Meals in January 200014 ranged from 37 per cent to 88 per cent for the PLC schools in the sample and from 35 per cent to 52 per cent for comparison schools, with means of 49 per cent and 41 per cent respectively.
An exploration of key pupil level indicators provides more in-depth information on the comparability of the two groups of schools. Using pupil level data (available via PLASC) there were some differences between Year 9 pupils in the PLC and comparison schools, with more pupils in PLC than in comparison schools being known to be eligible for Free School Meals in January 2003 (43 per cent versus 34 per cent).15 In both PLC and comparison schools, 50 per cent of Year 9 pupils were female and 50 per cent were male.
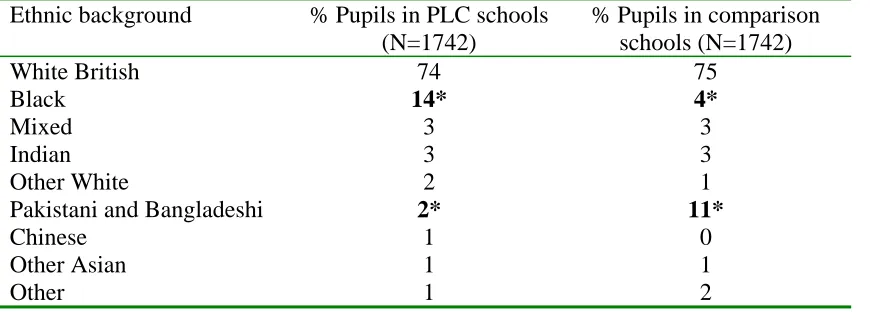
[image:12.595.85.522.388.544.2]The ethnic backgrounds of Year 9 pupils in the PLC and comparison schools are presented in Table 1.
Table 1. Ethnic background (Year 9)
Ethnic background % Pupils in PLC schools (N=1742)
% Pupils in comparison schools (N=1742)
White British 74 75
Black 14* 4*
Mixed 3 3
Indian 3 3
Other White 2 1
Pakistani and Bangladeshi 2* 11*
Chinese 1 0
Other Asian 1 1
Other 1 2
Ns are less than 1793 and 1745 for pupils in PLC schools and pupils in comparison schools as information was not available for all respondents. Figures in bold and asterisked signify that the difference between pupils in PLC and comparison schools is statistically significant at the 0.05 level or beyond using Fisher’s exact test. Percentages do not always equal 100 because of rounding.
Source: PLASC 2003.
As can be seen from Table 1, the majority of pupils surveyed were from a White British ethnic background. There were significantly more Black pupils in PLC schools than in comparison schools and more pupils with Pakistani or Bangladeshi backgrounds in comparison schools.
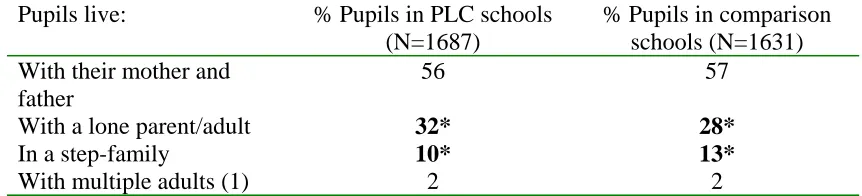
In order to provide some insights into pupils’ circumstances, pupils were asked a range of questions about their home background. Table 2 provides details of who Year 9 pupils reported living with in the PLC and comparison groups.
14
School-level FSM data for January 2000 were used by the DfES to establish eligibility for the PLC pilot scheme.
15
Table 2. Family structure (Year 9)
Pupils live: % Pupils in PLC schools (N=1687)
% Pupils in comparison schools (N=1631) With their mother and
father
56 57
With a lone parent/adult 32* 28*
In a step-family 10* 13*
With multiple adults (1) 2 2
(1) e.g., mother and another adult.
Ns are less than 1793 and 1745 for pupils in PLC schools and pupils in comparison schools as not all respondents answered the question. Figures in bold and asterisked signify that the difference between pupils in PLC and comparison schools is statistically significant at the 0.05 level or beyond using Fisher’s exact test.
As Table 2 shows, the family structures of both groups of pupils were broadly similar, with just over half of the pupils living with their mother and father. However, more pupils in PLC than comparison schools reported living in one-parent households, whilst fewer lived in step-families.
In terms of language spoken, around nine out of ten pupils in PLC and comparison schools reported that they ‘always’ spoke English at home although significantly more pupils in schools receiving PLCs ‘always’ spoke English compared with those at comparison schools (91 per cent versus 87 per cent).16
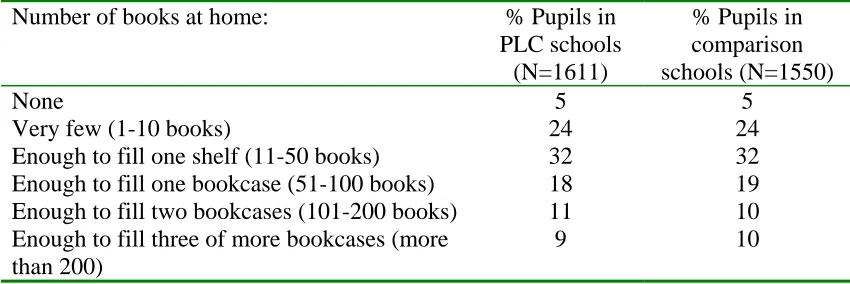
A key factor in relation to educational outcomes is socio-economic status (Desforges and Abouchaar, 2003; West and Pennell, 2003). One of the proxy-measures frequently used in educational research to gauge a household’s socio-economic standing is to ask pupils how many books there are in their home (not counting newspapers, magazines or school books) (e.g., Keys et al., 1999; Kerr et al., 2002). Table 3 provides details of the number of books reported by pupils in PLC and comparison schools. As Table 3 shows, just under a third of pupils (29 per cent) lived in homes with ten books or fewer.
16
Table 3. Percentage of pupils with different numbers of books at home (Year 9)
Number of books at home: % Pupils in PLC schools
(N=1611)
% Pupils in comparison schools (N=1550)
None 5 5
Very few (1-10 books) 24 24
Enough to fill one shelf (11-50 books) 32 32 Enough to fill one bookcase (51-100 books) 18 19 Enough to fill two bookcases (101-200 books) 11 10 Enough to fill three of more bookcases (more
than 200)
9 10
Ns are less than 1793 and 1745 for pupils in PLC schools and pupils in comparison schools as not all respondents answered the question. Percentages do not always equal 100 because of rounding.
Given that there were differences between pupils in PLC and comparison schools in terms of their known eligibility for Free School Meals, the analyses in the following sections, which focus on differences between pupils in PLC and comparison schools, take account of this by using multiple regression. The key predictor variable was whether pupils were in PLC or non-PLC schools, and with known Free School Meals eligibility being included as a ‘control’ variable. As there is also evidence to suggest there are gender differences in relation to attitudes to school (see Morris, 2001; Ridley et al., 2004), sex was also included as a ‘control’ variable.
It is important to stress that differences between PLC and comparison schools cannot be linked causally to the PLC pilot scheme; however, the regression analyses do enable us to establish that the differences observed are associated with pupils being in PLC or comparison schools controlling for pupils’ sex or low income (indicated by eligibility for Free School Meals). Details of the multiple regression findings in relation to Year 9 are presented in Annex B.
Out-of-school activities of Year 9 pupils
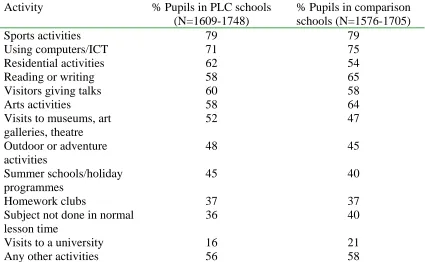
Table 4. Percentage of pupils participating in out-of-school activities at least once (Year 9)
Activity % Pupils in PLC schools (N=1609-1748)
% Pupils in comparison schools (N=1576-1705)
Sports activities 79 79
Using computers/ICT 71 75
Residential activities 62 54
Reading or writing 58 65
Visitors giving talks 60 58
Arts activities 58 64
Visits to museums, art galleries, theatre
52 47
Outdoor or adventure activities
48 45
Summer schools/holiday programmes
45 40
Homework clubs 37 37
Subject not done in normal lesson time
36 40
Visits to a university 16 21
Any other activities 56 58
Ns are less than 1793 and 1745 for pupils in PLC schools and pupils in comparison schools as not all respondents answered all questions.
As can be seen from Table 4, large proportions of pupils had been involved in a wide range of out-of-school activities. Sports activities and using computers/ICT were the two activities most widely reported. Over seven out of ten pupils reported having taken part in each of these, with over half having participated in residential activities and reading or writing.
In order to establish if any of the differences noted in Table 4 between pupils in PLC and comparison schools were statistically significant, a series of multiple regressions17 were carried out.18 It was found that:
• pupils in PLC schools reported more visits to museums, art galleries and the theatre than those in comparison schools; and
• pupils in comparison schools reported more involvement in ICT activities, reading/writing activities, arts activities, subjects not done in normal lesson time, and visits to a university than those in PLC schools.
There were also a number of independent associations with known Free School Meals eligibility and with gender. Pupils known to be eligible for Free School Meals reported more involvement in reading/writing activities and homework clubs than those not eligible; girls reported more involvement in arts activities than boys, whilst boys participated more in ICT activities and subjects not done in normal lesson time than girls. Given the compensatory objectives of the policy it is perhaps encouraging
17
Reported in Annex B as models B1 to B6.
18
that, controlling for being a pupil at a PLC school and for sex, pupils eligible for Free School Meals were not significantly less likely to report participating in out-of-school activities.
Thus, while it was intended that the PLC funding would provide opportunities for more out of school activities it is clear that Year 9 survey respondents from PLC schools were not, in general, more likely to report participating in out-of-school activities than were pupils in comparison schools although they did report more visits to museums, art galleries and the theatre.
[image:16.595.87.510.295.559.2]Those pupils who had taken part in out-of-school activities were asked whether they ‘liked’, were ‘unsure’ or ‘didn’t like’ these activities. Table 5 presents the findings for those pupils who reported liking the activities.
Table 5. Percentage of pupils who enjoyed out-of-school activities (Year 9)
Liked this activity % Pupils in PLC schools (N=246-1336)
% Pupils in comparison schools (N=321-1268)
Sports activities 82 80
Outdoor or adventure activities
78 76
Using computers/ICT 77 75
Residential activities 76 71
Arts activities 64 65
Visits to museums, art galleries, theatre
56 56
Summer schools/holiday programmes
55 50
Visits to a university 46 53 Subject not done in normal
lesson time
41 44
Reading or writing 39 45
Visitors giving talks 33 35
Homework clubs 33 34
Any other activities 58 59
Ns are less than 1793 and 1745 for pupils in PLC schools and pupils in comparison schools as only those who participated in activities were asked if they liked these. In addition, not all respondents answered all questions.
Out-of-school activities were well liked by pupils, as illustrated in Table 5. Sports, outdoor or adventure activities, ICT, and residential activities were popular with at least three-quarters of the pupils who had been involved in them. Somewhat more ‘academic’ pursuits, such as visits to museums, summer schools and visits to a university were reported as enjoyable by around half of the pupils.
positive views about residential activities than those eligible, and girls holding more positive views than boys.
School experience and behaviour of Year 9 pupils
One of the central ideas of the PLC pilot scheme is the notion that learning and education are not confined to the classroom. The kind of learning that the scheme tried to facilitate was however expected to improve into young people’s experience and behaviour at school. This section presents pupils’ views about school and lessons and self-reported levels of truancy and lateness.
Research on educational motivation has suggested that the question whether pupils consider school to be valuable may have a greater influence on educational motivation, than the question whether school is liked or not (Elliott et al., 1999). Indeed, attitudes to school and attitudes to learning have been identified as quite separate from each other (Morris et al., 2004).
With this in mind, pupils were asked whether they agreed, were unsure or disagreed with a series of statements, including ‘School work is worth doing’ and ‘Most of the time I like being at school’. Around seven out of ten pupils agreed that school work was worth doing (71 per cent in PLC schools and 65 per cent in comparison schools).19 Pupils in PLC schools tended to agree with this statement more than those in comparison schools. At the same time, just over half of the pupils surveyed reported that they liked being at school ‘most of the time’ (55 per cent and 52 per cent of pupils in PLC and comparison schools respectively).20
[image:17.595.87.513.522.676.2]
Pupils’ views about their lessons were also explored; they were asked whether, for each statement presented, it applied to ‘all lessons’, ‘most lessons, ‘some lessons’, ‘hardly any lessons’ or ‘no lessons’. Table 6 gives the percentage of pupils indicating whether they felt that each statement applied in ‘all’ or ‘most’ lessons.
Table 6. Pupils’ feelings about their lessons (Year 9)
In all or most lessons… % Pupils in PLC schools (N=1708-1723)
% Pupils in comparison schools (N=1656-1670) I work as hard as I can in
school
81 80
I often count the minutes till a lesson ends
46 45
The work I do in lessons is interesting
41 39
I am bored in lessons 31 31 The work I do in lessons is
a waste of time
11 14
Ns are less than 1793 and 1745 for pupils in PLC schools and pupils in comparison schools as not all respondents answered all questions.
19
Reported in Annex B as model B8, Ns are 1735 and 1689 for pupils in PLC and comparison schools.
20
As can be seen from Table 6, eight out of ten pupils reported that they worked as hard as they could in all or most of their lessons. However, nearly half also indicated that they often ‘count the minutes’ to the end of a lesson, for all or most lessons and just under a third of pupils reported being bored in all or most of their lessons.
Pupils were presented with a series of statements relating to their assessments of their behaviour and school experience. Just over half of the Year 9 pupils in both PLC and comparison schools described themselves as ‘often’ well behaved at school (53 per cent and 54 per cent respectively).21
Around four out of ten pupils reported that they ‘often’ did their homework on time (39 per cent in PLC schools and 46 per cent in comparison schools).22 There was a statistically significant association between attendance at a PLC school, and whether pupils ‘often’, ‘sometimes’ or ‘never’ did their homework on time, with pupils in PLC schools less frequently completing their homework on time;23 there were also two independent associations, with pupils known to be eligible for Free School Meals less often completing their homework on time than those not eligible, and boys less often completing their homework on time than girls.
One of the policy objectives of the PLC pilot scheme was to promote inclusion and to break down barriers which prevent them from taking part in activities. The experience or perception of being bullied or badly treated by other pupils may be regarded as one indicator of pupil inclusion. Around one in five pupils admitted to having ‘often’ or ‘sometimes’ been bullied at school (23 per cent in PLC schools and 28 per cent in comparison schools).24 There was a statistically significant association between attendance at a PLC school and bullying, with less bullying being experienced by pupils in PLC schools (on a three-point scale ranging from ‘often’ to ‘never’).25
Pupils were asked whether they had ever truanted or been late for lessons. They were presented with a series of options (‘never’, ‘for the odd day or lesson’, ‘for particular days or lessons’, ‘for several days at a time’ and ‘for weeks at a time’). Around eight out of ten pupils reported that they had not played truant from school in the current year (81 per cent in PLC schools and 78 per cent in comparison schools).26 There was a statistically significant association between attending a PLC school and truancy with pupils in PLC schools reporting less truancy than those in comparison schools.27 There was also an independent association with Free School Meals eligibility, with pupils known to be eligible for Free School Meals having higher self-reported truancy rates than those not eligible.
Just over half of the pupils surveyed indicated that their friends had not truanted in the current year (56 per cent of pupils in PLC and 52 per cent of pupils in comparison
21
Ns are 1764 and 1708 for pupils in PLC and comparison schools.
22
Ns are 1735 and 1679 for pupils in PLC and comparison schools.
23
See Annex B, model B9.
24
Ns are 1704 and 1664 for pupils in PLC and comparison schools.
25
See Annex B, model B10.
26
Ns are 1570 and 1481 for pupils in PLC and comparison schools.
27
schools).28 Less truancy amongst friends was reported by pupils in PLC than comparison schools. There were also two independent statistically significant associations: boys reported more truancy amongst their friends than did girls; and pupils known to be eligible for Free School Meals reported more truancy amongst their friends than those not eligible.29
Pupils were asked if they were ever late for lessons; they were given the options of responding ‘never’, ‘for some lessons’, ‘some days’ and ‘most days’. In both PLC and comparison schools, around one third of pupils reported that they were never late for lessons (33 per cent and 36 per cent).30 Around a quarter of the pupils surveyed indicated that their friends were never late for lessons (21 per cent of pupils in PLC and 25 per cent of pupils in comparison schools).31
In summary, compared with pupils in comparison schools and controlling for sex and known eligibility for Free School Meals, pupils in PLC schools reported less bullying and less truancy. They also tended to express more positive attitudes towards school than did pupils in comparison schools. It is important to stress, however, that the analyses identify statistically significant associations, they do not establish causal links.
Pupils’ views of themselves in Year 9
In the case studies of 15 schools that were part of the pilot scheme, interviewees reported a range of positive impacts on pupils associated with the PLC pilot scheme (Braun and West, 2004). Staff interviewed stated that, amongst other things, they had observed improved self-esteem and confidence in pupils who had participated in activities facilitated by the scheme.
The questionnaires to pupils enabled us to investigate pupils’ self-concept. Pupils were asked whether they agreed, were unsure or disagreed with a series of statements about themselves as learners, Table 7 below presents percentages of pupils who agreed with each statement.
28
Ns are 1377 and 1302 for pupils in PLC and comparison schools.
29
See Annex B, model B12.
30
Ns are 1635 and 1559 for pupils in PLC and comparison schools.
31
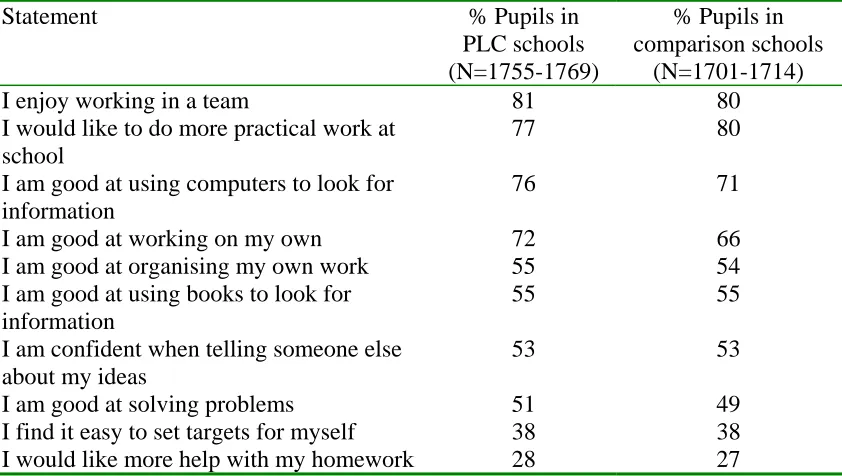
Table 7. Percentage of pupils who agreed with statements about their learning (Year 9)
Statement % Pupils in
PLC schools (N=1755-1769)
% Pupils in comparison schools
(N=1701-1714) I enjoy working in a team 81 80 I would like to do more practical work at
school
77 80
I am good at using computers to look for information
76 71
I am good at working on my own 72 66 I am good at organising my own work 55 54 I am good at using books to look for
information
55 55
I am confident when telling someone else about my ideas
53 53
I am good at solving problems 51 49 I find it easy to set targets for myself 38 38 I would like more help with my homework 28 27
Ns are less than 1793 and 1745 for pupils in PLC schools and pupils in comparison schools as not all respondents answered all questions.
As can be seen from Table 7, the majority of pupils were, in general, positive and confident about their skills as learners. Eight out of ten indicated that they enjoyed working in a team and around seven out of ten reported that they would like to do more practical work at school; they were good at using computers to look for information; and at working on their own.
We then examined whether there was an association between being in a PLC school and each of these aspects of learner confidence using multiple regressions. A number of differences were found, with pupils in PLC schools tending to agree more than pupils in comparison schools with the statements ‘I am good at using computers to look for information’ and ‘I am good at working on my own’.32 It was also found that for these aspects of learner confidence, there were two independent statistically significant associations: pupils not eligible for Free School Meals tended to agree with these two statements more than those eligible; boys also tended to agree with both statements more than girls.
Pupils were also asked ‘How do you do in school compared with your close friends?’ and ‘How do you do in school compared with others in your form/tutor group?’. We found that 33 per cent of pupils in PLC and 36 per cent of pupils in comparison schools reported ‘doing better’ in school than their close friends, whilst 26 per cent and 27 per cent respectively felt they were ‘doing better’ than others in their form/tutor group.33
32
See Annex B, models B13 and B14.
33
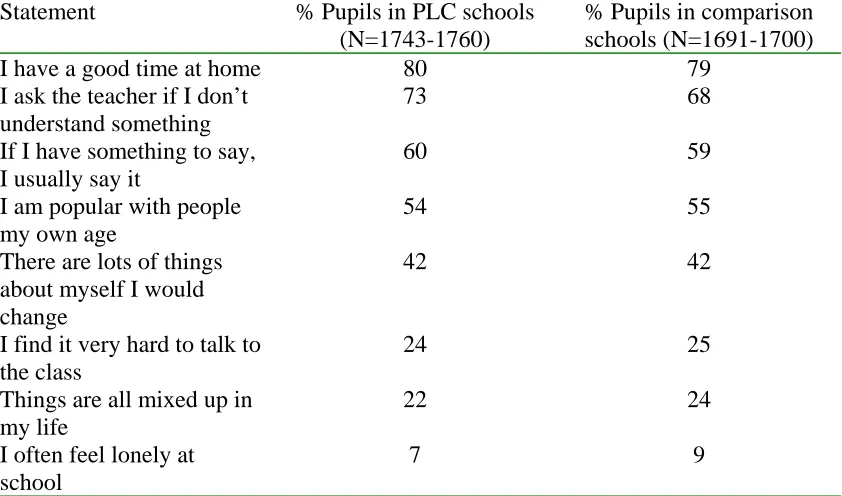
Pupils were asked whether they agreed, were unsure or disagreed with a series of statements relating to pupils’ general self-esteem and confidence and that are commonly used in educational psychology (Reid, 1982; Francis, 1998; Davies and Brember, 1999). Table 8 presents findings for pupils who agreed with each statement.
Table 8. Percentage of pupils who agreed with statements about themselves (Year 9)
Statement % Pupils in PLC schools (N=1743-1760)
% Pupils in comparison schools (N=1691-1700) I have a good time at home 80 79
I ask the teacher if I don’t understand something
73 68
If I have something to say, I usually say it
60 59
I am popular with people my own age
54 55
There are lots of things about myself I would change
42 42
I find it very hard to talk to the class
24 25
Things are all mixed up in my life
22 24
I often feel lonely at school
7 9
Ns are less than 1793 and 1745 for pupils in PLC schools and pupils in comparison schools as not all respondents answered all questions.
As can be seen from Table 8, around eight out of ten of the pupils reported that they had a good time at home and around seven out of ten indicated that they asked the teacher if they did not understand something. In both groups of schools, around six out of ten pupils agreed with the statement ‘If I have something to say, I usually say it’ and over half agreed that they were popular with people their own age. Yet, a substantial minority also showed some insecurities. Four out of ten pupils surveyed identified with the statement ‘There are lots of things about myself I would change’, whilst around a quarter found it hard to talk to the class and agreed with the statement ‘Things are all mixed up in my life’.
In order to examine whether or not there were any statistically significant associations between these views and attending a PLC school, a series of multiple regressions were carried out. It was found that pupils in comparison schools tended to agree with the statement ‘I often feel lonely at school’ more than pupils in PLC schools;34 there was also an independent statistically significant association with pupils who were known to be eligible for Free School Meals showing a greater tendency to agree with this statement than those not eligible.
34
Thus, interviewees in PLC schools (see Braun and West, 2004) and pupils themselves reported a view that the pilot scheme was beneficial to pupils’ self-esteem. Indeed, while we are unable to infer that this reflects a causal relationship, in relation to confidence in using ICT, working alone and feeling lonely at school, pupils in PLC schools gave more positive responses to questionnaire items than did pupils in comparison schools.
Pupils’ aspirations for the future in Year 9
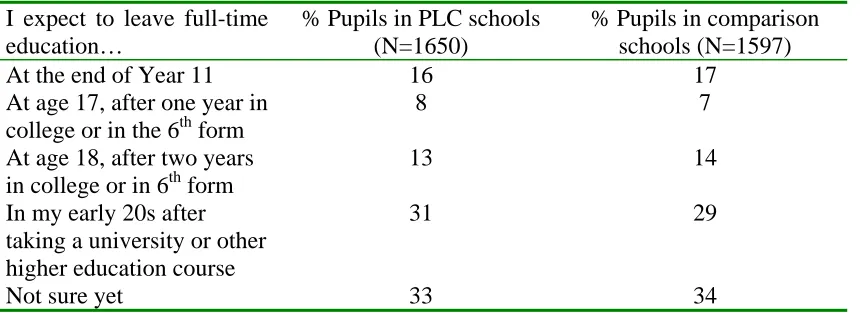
[image:22.595.87.517.266.423.2]Pupils were asked when they thought that they might leave full-time education; their responses are presented in Table 9.
Table 9. Year 9 pupils’ future education plans
I expect to leave full-time education…
% Pupils in PLC schools (N=1650)
% Pupils in comparison schools (N=1597) At the end of Year 11 16 17
At age 17, after one year in college or in the 6th form
8 7
At age 18, after two years in college or in 6th form
13 14
In my early 20s after taking a university or other higher education course
31 29
Not sure yet 33 34
Ns are less than 1793 and 1745 for pupils in PLC schools and pupils in comparison schools as not all respondents answered the question. Percentages do not always equal 100 because of rounding.
In terms of plans for their future education, there were no statistically significant differences between pupils in PLC and comparison schools. In both groups, small minorities of pupils expected to be leaving full-time education at the end of Year 11, whilst – at the other end of the spectrum – just under a third anticipated going on to higher education. Around a third of pupils were not sure yet when they would be leaving full-time education.
When asked about their parents’ views on education, around three-quarters of pupils surveyed reported that their parents wanted them to stay in education ‘as long as possible’ (78 per cent of pupils in PLC schools and 75 per cent in comparison schools).35 There was a trend, bordering on statistical significance,36 for pupils in PLC schools to agree with this statement more than those in comparison schools.
35
Ns are 1720 and 1669 for pupils in PLC and comparison schools.
36
4.
RESULTS FOR PUPILS IN YEAR 11
4.1 Value-added analysis of GCSE examination results
This section presents findings from an analysis of the GCSE national value-added dataset for pupils who took GCSE examinations in 2002 and 2003. As part of the evaluation of Excellence in Cities, national data linking the 2002 and 2003 GCSE results to prior attainment at the end of Key Stage 2 (KS2) and Key Stage 3 (KS3), and information from PLASC were modelled in order to assess the possible impact of EiC and the PLC pilot scheme on pupils’ progress during KS3 and 4. Two datasets were examined relating to progress from KS2 to GCSE:
• 2003 GCSE outcomes only; and
• 2002 and 2003 outcomes.
Analysis was carried out using multilevel modelling with the following outcome measures as dependent variables, measured in GCSE equivalent point scores:
• ‘best 8’ GCSE total score;
• total GCSE score;
• average GCSE score;
• Mathematics GCSE score;
• English GCSE score;
• average GCSE Science score; and
• achieving five or more GCSE passes at grades A* to C.
Progress from KS2 to GCSE
Results for the 2003 outcomes showed statistically significant and positive relationships between participation in the PLC pilot scheme and pupil progress on six of the seven outcomes of interest. The coefficients for five of the outcome measures, expressed in terms of additional GCSE points gained, are shown in Table 10.
Table 10: Additional GCSE points associated with attending a school participating in the PLC pilot scheme
Best 8 GCSE total score
Total GCSE score
Average GCSE score
Maths GCSE score
English GCSE score
Average Science score
1.0 1.3 0.1 0.2 NS 0.04
NS is not statistically significant
When considering the combined 2002 and 2003 dataset, two statistically significant results were found for participation in the PLC pilot scheme:
• for Mathematics GCSE results in 2003 (an additional 0.1 of a GCSE point); and
• for the likelihood of achieving five or more GCSE passes at grades A* to C (an improvement of 12 per cent in the odds of achieving this in 2003).
Thus when examining progress from Key Stage 2 to GCSE we see a relatively positive picture for pupils attending schools receiving PLC funds. However, it must be remembered that pupils taking their GCSE examinations in 2002 and 2003 completed KS3 before their schools began to participate in the PLC pilot scheme. It is therefore important to examine whether they made greater progress than would be expected during KS4 – that is, during the years of the PLC pilot scheme.
Progress from KS3 to GCSE
For the 2003 GCSE results dataset, unlike the 2003 results for value-added from KS2 to GCSE, far fewer statistically significant relationships were detected between participation in the PLC pilot scheme and value added from KS3 to GCSE. Thus the coefficients for ‘best 8’ GCSEs points score, total GCSE points score, average GCSE point score, Mathematics GCSE and average Science GCSE point score all failed to reach the level for statistical significance. However, a significant positive coefficient was identified for achieving five or more GCSE passes at grades A* to C. That is, controlling for other factors, the odds of pupils achieving five such passes were 21 per cent greater for pupils attending schools receiving PLC funding.
When considering the combined 2002 and 2003 dataset statistically significant coefficients were once again only found for participation in the PLC pilot scheme for the likelihood of achieving five or more GCSE passes at grades A* to C (an improvement of 17 per cent in the odds of achieving this in 2003).
Thus, when examining progress from KS3 to GCSE we only see a statistically significant relationship between participation in the PLC pilot scheme and the odds of achieving five or more GCSEs. Set alongside the more positive findings relating to progress from KS2 to GCSE it is reasonable to conclude that at least some of the enhanced progress made by pupils in schools receiving PLC funds from KS2 to GCSE took place before the PLC pilot scheme was introduced. Nevertheless, it is worth restating that the KS3 to GCSE analysis indicates that the odds of pupils achieving five or more GCSE passes at grades A* to C were significantly improved for those attending schools participating in the PLC pilot scheme.
4.2 Year 11 pupils survey results
This section presents findings from 3522 Year 11 pupils: 2348 pupils from 23 PLC schools and 1174 pupils from nine comparison schools.37 In the first instance, we explore the characteristics of the Year 11 samples in terms of their known eligibility for Free School Meals, ethnicity, home circumstances and socio-economic backgrounds.
The following sections then focus on responses of pupils in PLC and comparison schools to a range of questions relating to their out-of-school activities; their assessments of their school experiences and behaviour; their perceptions of themselves as learners and as individuals; and their aspirations for the future.
Characteristics of pupils
At school level, the proportion of pupils known to be eligible for Free School Meals in January 2000 ranged from 35 per cent to 71 per cent in the sample of PLC schools and 37 per cent to 54 per cent in the comparison schools, with means of 50 per cent and 43 per cent respectively.
An exploration of key pupil level indicators provides more in-depth information on the comparability of the two groups of schools. Using pupil level data (available via PLASC) relating to our Year 11 sample, we found that more pupils in PLC schools than in comparison schools were known to be eligible for Free School Meals in January 2003 (43 per cent versus 36 per cent).38 The gender split was 45 per cent male and 55 per cent female in PLC schools and 41 per cent male and 59 per cent female in comparison schools.39
The ethnic backgrounds of pupils in Year 11 in the PLC and comparison schools are presented in Table 11.
37
The PLC schools were located in London (nine schools), the North West (seven schools), the West Midlands (five schools) and Yorkshire and the Humber (two schools). The comparison schools were in London (two schools), the North West (two schools), the North East (two schools), the South East (two schools) and the West Midlands (one school).
38
Ns are 2348 and 1174 for pupils in PLC and comparison schools.
39
Table 11. Ethnic background (Year 11)
Ethnic background % Pupils in PLC schools (N=2347)
% Pupils in comparison schools (N=1164)
White British 47 48
Pakistani and Bangladeshi 24 26
Black 14* 9*
Other White 5* 3*
Mixed 4* 2*
Indian 3* 7*
Other Asian 2 3
Chinese 1 0
Other 3 2
Ns are less than 2348 and 1174 for pupils in PLC schools and pupils in comparison schools as information was not available for all respondents. Figures in bold and asterisked signify that the difference between pupils in PLC and comparison schools is statistically significant at the 0.05 level or beyond using Fisher’s exact test. Percentages do not always equal 100 because of rounding.
Source: PLASC 2003
As can be seen from Table 11, just under half of the pupils surveyed were from a White British ethnic background, whilst around a quarter came from Pakistani or Bangladeshi backgrounds. There were significantly more Black pupils and those from ‘Other White’ and Mixed backgrounds in PLC schools and more pupils from an Indian background in comparison schools.
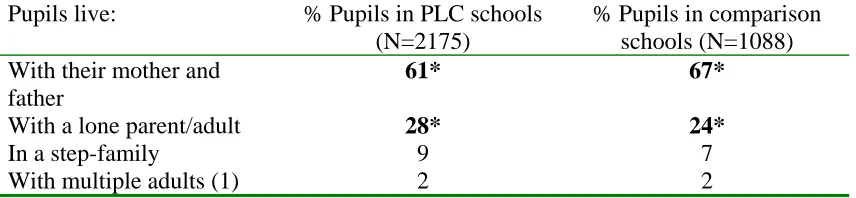
The surveys included questions about pupils’ home circumstances. Table 12 provides details of who pupils reported living with in the PLC and comparison groups.
Table 12. Family structure (Year 11)
Pupils live: % Pupils in PLC schools (N=2175)
% Pupils in comparison schools (N=1088) With their mother and
father
61* 67*
With a lone parent/adult 28* 24*
In a step-family 9 7
With multiple adults (1) 2 2
(1) e.g., mother and another adult.
Ns are less than 2348 and 1174 for pupils in PLC schools and pupils in comparison schools as not all respondents answered the question. Figures in bold and asterisked signify that the difference between pupils in PLC and comparison schools is statistically significant at the 0.05 level or beyond using Fisher’s exact test.
[image:26.595.86.514.487.586.2]When asked whether they ‘never’, ‘sometimes’ or ‘always or almost always’ spoke English at home, eight out of ten pupils reported that they ‘always’ spoke English (84 per cent in PLC and 82 per cent in comparison schools).40
Pupils were asked about the number of books in their home (excluding newspapers, magazines or school books). As Table 13 shows, around a quarter of pupils surveyed lived in homes with up to ten books (25 per cent and 28 per cent of pupils in PLC and comparison schools respectively).
[image:27.595.84.509.239.381.2]
Table 13. Percentage of pupils with different numbers of books at home (Year 11)
Number of books at home: % Pupils in PLC schools
(N=2149)
% Pupils in comparison schools (N=1078)
None 4 5
Very few (1-10 books) 21 23
Enough to fill one shelf (11-50 books) 31 32 Enough to fill one bookcase (51-100 books) 19 18 Enough to fill two bookcases (101-200 books) 12 11 Enough to fill three of more bookcases (more
than 200)
13 12
Ns are less than 2348 and 1174 for pupils in PLC schools and pupils in comparison schools as not all respondents answered the question. Percentages do not always equal 100 because of rounding.
As with the analysis of Year 9 survey findings, the following sections focus on differences between pupils in PLC and comparison schools. Multiple regression was used to take account of the fact that there were differences between pupils in the two groups of schools in terms of their known eligibility for Free School Meals, with the key predictor variable being whether pupils are in PLC or non-PLC schools and with known Free School Meals eligibility being included as a ‘control’ variable. As other research suggests there are gender differences in relation to attitudes to school (e.g., Morris, 2001; Ridley et al., 2004), sex was also included as a ‘control’ variable.
Differences between PLC and comparison schools cannot be linked causally to the PLC pilot scheme; however, the regression analyses enable us to establish that the differences observed are associated with being in a PLC or comparison school having taken into account pupils’ sex or low income (indicated by known eligibility for Free School Meals).
Where statistically significant associations were identified between attending a PLC school and a variable of interest (controlling for sex and known eligibility for Free School Meals), details of the Year 11 multiple regression findings are presented in
Annex C.
40
Out-of-school activities for Year 11 pupils
[image:28.595.90.510.219.443.2]Turning now to school-related questions, pupils were asked whether they had undertaken a range of pre-defined out-of-school activities ‘often’, ‘sometimes’, ‘once’ or ‘never’. Table 14 presents percentages of pupils reporting that they had taken part in activities at least once.
Table 14. Percentage of pupils participating in out-of-school activities at least once (Year 11)
Activity % Pupils in PLC schools (N=2051-2290)
% Pupils in comparison schools (N=1035-1148)
Using computers/ICT 82 78
Sports activities 72 72
Visitors giving talks 66 66
Reading or writing 62 63
Homework clubs 59 54
Arts activities 55 53
Visits to museums, art galleries, theatre
53 47
Summer schools/holiday programmes
39 43
Visits to a university 37 35 Subject not done in normal
lesson time
34 36
Any other activities 51 56
Ns are less than 2348 and 1174 for pupils in PLC schools and pupils in comparison schools as not all respondents answered all questions.
As can be seen from Table 14, using computers/ICT and sports activities were the two most frequently mentioned activities, with at least seven out of ten pupils reporting that they had participated in these. Around two-thirds also indicated that visitors had given talks and had been involved in reading and writing activities.
In order to examine whether any of the differences between pupils in PLC and comparison schools noted in Table 14 were statistically significant, a series of multiple regressions were carried out. The following significant associations were found:41
• pupils in PLC schools reported greater participation in ICT activities, homework clubs, and visits to museums, art galleries and the theatre, than those in comparison schools; and
• pupils in comparison schools reported a greater frequency of talks by visitors than pupils in PLC schools.42
41
Reported in Annex C, models C1 to C5.
42
There were also a number of independent associations with pupils known to be eligible for Free School Meals and girls reporting greater involvement (than those not eligible for Free School Meals and boys) in ICT activities and homework clubs. Girls also reported more frequent visits to museums, art galleries and the theatre. Once again, the absence of a negative association between eligibility for Free School Meals and participation in out-of-school activities is encouraging.
[image:29.595.88.511.266.491.2]Pupils who had taken part in these activities were then asked whether they had ‘liked’, were unsure or ‘didn’t like’ the activities. Table 15 presents the findings for those pupils who had ‘liked’ the activities.
Table 15. Percentage of pupils who enjoyed out-of-school activities (Year 11)
Liked this activity % Pupils in PLC schools (N=691-1763)
% Pupils in comparison schools (N=375-826)
Sports activities 80 77
Using computers/ICT 79 75
Arts activities 69 72
Visits to a university 67 70 Visits to museums, art
galleries, theatre
63 64
Summer schools/holiday programmes
59 59
Reading or writing 52 49
Homework clubs 49 50
Visitors giving talks 48 47 Subject not done in normal
lesson time
47 49
Any other activities 55 50
Ns are less than 2348 and 1174 for pupils in PLC schools and pupils in comparison schools as only those who participated in activities were asked if they liked these. In addition, not all respondents answered all questions.
As can be seen from Table 15, sports activities and using computers/ICT were particularly popular, at least three-quarters of pupils indicated that they liked these. Around two-thirds of pupils who had participated in arts activities, visits to a university, and visits to museums, art galleries or the theatre also reported that they had enjoyed these activities.
School experience and behaviour of Year 11 pupils
Pupils were asked whether they agreed, were unsure or disagreed with the statements ‘School work is worth doing’ and ‘Most of the time I like being at school’. Around three-quarters of pupils surveyed agreed that school work was worth doing (75 per cent in PLC schools and 73 per cent in comparison schools).43
However, agreeing that school is generally useful does not automatically imply that pupils enjoy school. Nevertheless, 57 per cent of pupils in PLC schools and 61 per cent in comparison schools reported that they liked being at school most of the time.44 There was a statistically significant association between attending a PLC school and liking being at school,45 with pupils in PLC schools showing less positive attitudes than pupils in comparison schools.46 There was also an independent association between gender and attitudes, with girls expressing more positive attitudes towards being at school than boys.
[image:30.595.87.518.362.518.2]Table 16 presents a more detailed picture of pupils’ views about their lessons. Pupils were asked whether each statement applied to ‘all lessons’, ‘most lessons, ‘some lessons’, ‘hardly any lessons’ or ‘no lessons’; the table gives the percentage of pupils reporting that statements applied in all or most lessons.
Table 16. Pupils feeling about their lessons (Year 11)
In all or most lessons… % Pupils in PLC schools (N=2218-2250)
% Pupils in comparison schools (N=1121-1127) I work as hard as I can in
school
77 79
The work I do in lessons is interesting
40 43
I often count the minutes till a lesson ends
36 38
I am bored in lessons 25 24 The work I do in lessons is
a waste of time
9 8
Ns are less than 2348 and 1174 for pupils in PLC schools and pupils in comparison schools as not all respondents answered all questions.
Over three-quarters of pupils felt that they worked as hard as they could in all or most of their lessons and four out of ten pupils thought that the work they did in lessons was interesting. At the same time, over a third of pupils admitted that they often counted the minutes to the end of a lesson and around a quarter reported feeling bored in all or most of their lessons. There was a statistically significant association between attendance at a PLC school and finding lessons interesting, with pupils in comparison schools expressing more positive views.47
43
Ns are 2255 and 1137 for pupils in PLC and comparison schools.
44
Ns are 2254 and 1137 for pupils in PLC and comparison schools.
45
These differences could have been the result of the characteristics of the schools or the pupils in the two groups that it was not possible to control for.
46
See Annex C, model C6.
47
Turning now to self-assessment of behaviour and experiences at school, pupils were asked whether they were ‘often’, ‘sometimes’ or ‘never’ well behaved at school; did their homework on time; or were bullied. Around seven out of ten pupils surveyed described themselves as ‘often’ well behaved in school (68 per cent in PLC and 72 per cent in comparison schools).48 Pupils in PLC schools described themselves as well behaved less frequently than those in comparison schools.49 There were also two independent associations with pupils known to be eligible for Free School Meals and boys reporting that they were well behaved less often than those not eligible and girls respectively.
Around four out of ten pupils reported that they ‘often’ did their homework on time (38 per cent and 43 per cent in PLC and comparison schools respectively).50 There was a statistically significant association between attendance at a PLC school and whether pupils ‘often’, ‘sometimes’ or ‘never’ did their homework on time, with pupils in PLC schools less frequently completing their homework on time.51 Further, an independent association with gender was found with boys less often completing their homework on time than girls.
A minority of pupils had experienced bullying by other pupils in the school (14 per cent in PLC and 16 per cent in comparison schools).52 Pupils in PLC schools reported less bullying than pupils in comparison schools; there was also an independent association with gender, with girls reporting less bullying than boys.53
In terms of truancy from school, around seven out of ten pupils reported that they had not played truant from school in the current year (72 per cent and 74 per cent in PLC and comparison schools respectively).54 Around half of the pupils surveyed indicated that their friends had not truanted in the current year (51 per cent in PLC and 49 per cent in comparison schools).55
Just over four out of ten pupils indicated that they had never been late for lessons (43 per cent and 44 per cent in PLC and comparison schools respectively),56 whilst just under a third reported that their friends were never late (30 per cent in PLC schools and 31 per cent in comparison schools).57
In summary, compared with pupils in comparison schools and controlling for sex and known eligibility for Free School Meals, pupils in PLC schools reported less bullying. On the other hand, pupils in PLC schools tended to express less positive attitudes towards school than did pupils in comparison schools. It is important to stress, however, that the analyses identify statistically significant associations, they do not establish causal links.
48
Ns are 2295 and 1155 for pupils in PLC and comparison schools.
49
See Annex C, model C8.
50
Ns are 2242 and 1131 for pupils in PLC and comparison schools.
51
See Annex C, model C9.
52
Ns are 2226 and 1123 for pupils in PLC and comparison schools.
53
See Annex C, model C10.
54
Ns are 2006 and 987 for pupils in PLC and comparison schools.
55
Ns are 1636 and 797 for pupils in PLC and comparison schools.
56
Ns are 2025 and 1742 for pupils in PLC and comparison schools.
57
Pupils’ views of themselves in Year 11
[image:32.595.88.509.206.523.2]Pupils were asked whether they agreed, were unsure or disagreed with a range of statements concerning their academic self-image. Table 17 presents percentages of respondents agreeing with statements of themselves as learners.
Table 17. Percentage of pupils who agreed with statements about their learning (Year 11)
Statement % Pupils in PLC schools (N=2266-2286)
% Pupils in comparison schools (N=1146-1155) I am good at using
computers to look for information
79 77
I am good at working on my own
78 77
I enjoy working in a team 77 80 I would like to do more
practical work at school
73 68
I am good at using books to look for information
68 68
I am confident when telling someone else about my ideas
63 60
I am good at solving problems
57 56
I am good at organising my own work
57 54
I would like more help with my homework
42 38
I find it easy to set targets for myself
40 38
Ns are less than 2348 and 1174 for pupils in PLC schools and pupils in comparison schools as not all respondents answered all questions.
Table 17 depicts a reasonably confident set of pupils in terms of learning skills; around eight out of ten pupils felt they were good at using computers to look for information, at working on their own and reported that they enjoyed working in a team.
We examined whether there were statistically significant associations between being in a PLC school and learner confidence. Two differences were found.58 Pupils in PLC schools expressed a greater preference for doing more practical work at school, whilst pupils in comparison schools expressed more positive views about working in a team. In terms of independent associations, boys expressed more positive attitudes than girls in relation to wanting more practical work.
58