1
University of Southern Queensland
Facility of Engineering and Surveying
The energy storage potential of a hybrid renewable
generation grid connected to a pumped hydro-generation
plant for effective connection into the energy market, off
peak switchable developing load demand market and act
as ancillary regional voltage support and bulk water
supply.
A dissertation submitted by
Mr. Aden Tomasel
Bachelor of Power Systems Engineering
In fulfillment of the requirements of
Bachelor of Engineering
2
Abstract
The primary objective of this study is to determine if a pumped hydro energy storage facility located near Toowoomba‟s Cressbrook dam is currently an economically viable option for South East Queensland. The
intended purpose of this system is to ultimately act as fast acting ancillary grid service to help alleviate South East Queensland‟s ever increasing fast demand fluctuations as seen by the grid operators. These fluctuations
are primarily due to the current and continually increasing installed domestic and utility scale intermittent Photovoltaic (PV) generation. This situation is becoming increasingly costly and problematic as grid security is becoming harder to maintain as a result. In trying to maintain an acceptable supply standard, this forces the energy markets power spot price to reach exceedingly high levels more frequently in addition to imposing increase stress on the grids infrastructure when compensating.
It was determined that the selected site north of Toowoomba is more than sufficient to cater for a hydro facility. There is adequate space, water resources, and elevation between catchments along with the area having no environmentally or culturally sensitive areas. There was no restriction upon the site from initial investigations being a prime location for a PHES project.
To carry out the economic viability testing the HOMER simulation package was used. From initial testing the proposed system was deemed to be currently too expensive with the return from sales simply being insufficient within the current energy market.
As a result future viability tests were conducted with a proposed large scale feed in tariff with the main difference in tariff structure being that it did not impose a demand cost. This greatly increased the economic viability of the project and made the possibility of such infrastructure much more likely, with the system now returning a profit on many of the variants. Furthermore an additional renewable generation element as
investigated to aid pumping, comprising of possibly both a PV and wind farm proved to be a very beneficial option. Depending on yearly load and model variation the size of each renewable component changed but proved to be valuable to the system, with also improving the systems environmental footprint which was a major factor.
It was concluded that the proposed PHES system would be a very effective compensating tool to SEQ‟s demand fluctuations and is viable in the proposed location. However it is currently too expensive under
3
Disclaimer –
University of Southern Queensland Faculty of Health, Engineering and Sciences
ENG4111/ENG4112 Research Project
Limitations of Use
The Council of the University of Southern Queensland, its Faculty of Health, Engineering & Sciences, and the staff of the University of Southern Queensland, do not accept any responsibility for the truth, accuracy or completeness of material contained within or associated with this dissertation.
Persons using all or any part of this material do so at their own risk, and not at the risk of the Council of the University of Southern Queensland, its Faculty of Health, Engineering & Sciences or the staff of the University of Southern Queensland.
This dissertation reports an educational exercise and has no purpose or validity beyond this exercise. The sole purpose of the course pair entitled “Research Project” is to contribute to the overall education within the
4 University of Southern Queensland
Faculty of Health, Engineering and Sciences ENG4111/ENG4112 Research Project
Certification of Dissertation
I certify that the ideas, designs and experimental work, results, analyses and conclusions set out in this dissertation are entirely my own effort, except where otherwise indicated and acknowledged.
I further certify that the work is original and has not been previously submitted for assessment in any other course or institution, except where specifically stated.
Aden Dion Tomasel
Student Number: 0061006251
Aden Dion Tomasel:
5
Acknowledgements
6
Table of contents
ABSTRACT ...2
ACKNOWLEDGEMENTS ...5
LIST OF FIGURES ...8
NOMENCLATURE AND ACRONYMS (ABBREVIATIONS) ...9
CHAPTER 1 – INTRODUCTION ... 10
1.1: STUDY OUTLINE ... 10
1.2: INTRODUCTION ... 11
1.3: THE PROBLEM ... 12
1.4: RESEARCH OBJECTIVES ... 13
1.5: CONCLUSIONS ... 14
CHAPTER 2 - LITERATURE REVIEW ... 15
2.1: INTRODUCTION ... 15
2.2: PUMPED HYDRO ENERGY STORAGE ... 15
2.2.1: RESERVOIRS OF INTEREST ... 15
... 16
2.2.2: BULK WATER SUPPLY DEMAND ... 17
2.3: PROJECT COST ... 17
2.4: AFTERNOON SHOULDER DEMAND AND INTERMITTENT GENERATION SYSTEMS EFFECTS ... 18
2.4.1: SOUTH AUSTRALIAN DEMAND VARIATIONS ... 19
2.5: OPTIMAL PHESGENERATING PERIODS ... 22
2.5.1: FUTURE IMPLICATIONS ... 25
2.6: CURRENT RELEVANT TRENDS WITHIN THESIS ... 26
2.6.1: PHOTOVOLTAIC TRENDS ... 26
2.6.2: ELECTRICITY PRICE TRENDS ... 27
2.6.3: NETWORK COST INCREASE AND GRID PARITY ... 29
2.7: PHES FOR RENEWABLE INTEGRATION AND POWER TIME SHIFTING ... 31
2.8: ANCILLARY SUPPORT AND MARKET ... 32
2.8.1: SYNCHRONOUS CONDENSER MODE FOR GRID VOLTAGE SUPPORT ... 34
2.9: GENERATOR AND TURBINE SYSTEMS ... 35
2.9.1: TURBINES ... 35
2.9.2: REVERSIBLE PUMP TURBINE SYSTEMS ... 36
2.10: CATCHMENTS ... 38
2.10.1: CATCHMENT HEAD AND FLOW ... 38
2.10.2: POWER OUTPUT ... 39
2.10.3: EFFICIENCY ... 40
2.11: LARGE-SCALE RENEWABLE ENERGY TARGET (LRET) ... 41
2.12: AUSTRALIAN ENERGY MARKET OPERATOR (AEMO) ... 42
2.12.1: NATIONAL ELECTRICITY MARKET (NEM) ... 43
2.12.2: AEMOFORECASTING INTRODUCTION ... 44
2.12.3: AMEOFORECASTING ... 47
2.12.4: GENERATION AND DEMAND ... 50
CHAPTER 3 - METHODOLOGY AND RESEARCH ... 54
3.1: INTRODUCTION ... 54
3.2: METHODOLOGY ... 54
3.2.1: COSTS... 54
7
3.2.2: SOLAR SYSTEM ... 56
3.2.3: POSSIBLE WIND FARM ... 58
3.2.4: HOMERMODEL ... 58
3.2.5: MODEL LOADS ... 61
3.2.6: BASE PV MODEL ... 62
3.2.7: FUTURE VIABILITY MODEL ... 67
3.2.8: EXCEL MODEL ... 70
3.3: ASSUMPTIONS AND VARIABILITY ... 71
3.3.1: ASSUMPTIONS ... 71
3.3.2: VARIABILITY ... 72
CHAPTER 4 – SAFETY ISSUES AND ASSESSMENT ... 73
4.1: RISK ASSESSMENT INTRODUCTION ... 73
4.2: BULK WATER SAFETY ... 73
4.3: RISK ASSESSMENT ... 73
CHAPTER 5 – ETHICAL ISSUES AND CONSEQUENTIAL EFFECTS ... 76
5.1: ETHICAL ISSUES ... 76
5.1.2: ENVIRONMENTAL FACTORS ... 76
5.1.3: INDIGENOUS PROTECTED LAND ... 77
5.2: CONSEQUENTIAL EFFECTS ... 77
5.2.1: PRIMARY EFFECT ... 77
5.2.2: SUBSIDIARY GRID EFFECTS ... 78
5.2.3: SOCIETY EFFECTS ... 78
5.2.4: BULK WATER POSSIBILITY ... 78
CHAPTER 6 - RESULTS AND DISCUSSION ... 80
6.1: INTRODUCTION ... 80
6.2: BASE SYSTEM RESULTS ... 80
6.2.1: BASE SYSTEM -NO PV ENERGY COSTS ONLY ... 80
6.2.2: BASE SYSTEM –ALL ELEMENTS CONSIDERED ... 81
6.3: FUTURE VIABILITY RESULTS... 84
6.3.1: ENERGY VARIANT ... 85
6.4: CONCLUSIONS ... 89
CHAPTER 7 – RESOURCE PLANNING AND TIMELINES ... 90
7.1: RESOURCE ANALYSIS ... 90
7.1.1: COMPUTER SOFTWARE ... 90
7.1.2: DATA ACQUISITION ... 90
7.2: TIME LINE ... 91
CHAPTER 8 - CONCLUSIONS ... 92
8.1: CONCLUSIONS ... 92
8.2: RECOMMENDATIONS ... 93
8.3: FURTHER RESEARCH ... 93
CHAPTER 9 – APPENDICES ... 95
8
List of figures
Figure 1: Queensland – Average non rooftop solar demand vs. time of day - pg. 15
Figure 2: Location of Proposed PHES site – pg. 18
Figure 3: Pipeline system from Cressbrook dam to MT Kynoch water treatment plant – pg. 19
Figure 4: SA average demand for Summer December – January. Mike Sandiford Melbourne Energy Institute – pg. 21
Figure 5: Peak Demand In SA for summer months – pg. 23
Figure 6: Demand reduction for Sydney, Central Coast and hunter Regions – pg. 24
Figure 7: Worst Days Prediction of Should Load Rises for QLD – pg. 25
Figure 8: Worst Days Prediction of Minimum Generation Capacity Required – pg. 25
Figure 9: Queensland’s Weekly volume Weighted Average Spot Price – pg. 26
Figure 10: Future Demand In SA for summer months – pg. 27
Figure 11: Current solar capacity increase and cost decrease trends within Australia – pg. 28
Figure 12: Australian PV industry growth forecasts – pg. 29
Figure 13: Long term change in Average annual electricity price – pg. 30
Figure 14: Australian Electricity price forecasts – pg. 30
Figure 15: Tariff 11 bill cost breakdown in 2014-15 – pg. 31
Figure 16: Domestic solar grid parity in Australia – pg. 32
Figure 17: Wind Generation Energy Time-Shift – pg. 33
Figure 18: NEM Customer Ancillary Services Cost – pg. 36
Figure 19: Cross section of pump turbine/generator unit – pg. 38
Figure 20: Ternary Set – pg. 39
Figure 21: PHES concept – pg. 40
Figure 22: Euler’s Turbine Equation – pg. 41
Figure 23: Electricity Generation Efficiencies (%) – pg. 42
Figure 24: Large-scale Generation certificate market – pg. 43
Figure 25: National Electricity Market regions and infrastructure – pg. 46
Figure 26: Hourly, Weekly and Yearly Electricity Load Profiles – pg. 48
Figure 27: AMEO National Electricity Forecasting – pg. 49
Figure 28: Example forecast showing components of demand – pg. 28
Figure 29: Forecast Process Overview – pg. 52
Figure 30: Demand Definitions – pg. 54
Figure 31: PV Operation and Maintenance Cost – pg. 58
Figure 32: VRB-ESS Specifications – pg. 58
Figure 33: Yearly solar radiation for Cressbrook Dam area – pg. 63
Figure 34: 24hr pumping load profile in summer months with PV system to reduce demand – pg. 65
Figure 35: 24hr pumping load profile for winter months with PV system to reduce demand – pg. 66
Figure 36: HOMER Rate Schedule – pg. 67
Figure 37: ‘Hydro’ VRB-ESS state of charge – pg. 68
Figure 38: Project area risk analysis – pg. 76
Figure 39: Environment Sensitivity Map – pg. 77
Figure 40: Map depiction of Indigenous protected land within Australia – pg. 78
Figure 41: Preliminary system cost – Energy expenses only – pg. 80
Figure 42: Base system results - all elements considered – pg. 82
Figure 43: System NPV at differing sellback rates – pg. 83
Figure 44: 240 day vs. 96 day utilization – pg. 84
Figure Energy 45: Energy Sensitivity results for 270 days active – pg. 85
Figure 46: Energy Sensitivity results for 12 days active – pg. 87
9
Nomenclature and Acronyms (Abbreviations)
Term Acronym Term Acronym
Photovoltaic PV and Data Acquisition Supervisory Control SCADA South East Queensland SEQ Extreme High Voltage EHV
Pumped Hydro Energy
Storage PHES Direct Current DC Power Factor PF Australian Energy Market Operator AEMO
National Energy Market NEM Automatic Voltage Regulating AVR High Voltage HV Low Voltage LV Minimum Reserve Level MRL Assessment Projection Energy Adequacy EAAP
Frequency Control
Ancillary Services FCAS
Network Control
Ancillary Services NCAS
System Restart Ancillary
Services SRAS
Large-scale Renewable
Energy Target LRET
Electrical Energy Storage EES
Department of Environment and
Resource Management DERM
Vanadium redox battery VRB Levelised Cost of Electricity LCOE Large-scale Generation
10
Chapter 1 – Introduction
1.1:
Study Outline
The main premise of this study is based upon a current problem affecting South East Queensland (SEQ) with regards to the current installed domestic and utility scale Photovoltaic (PV) generation. Queensland‟s installed PV is subject to Australia‟s‟ ever-dynamic weather systems, resulting in unpredictable and fast fluctuations in overall grid demand. This intermittent and unpredictable PV generation is already having serious implications upon the grid, of which making the prediction of the afternoon shoulder demand an increasingly difficult task. This effectively results in the demand predications particularly around the afternoon shoulder period, are becoming increasingly more erroneous on more occasions.
Consequently this leads to the spot price of power for the region to reach very high levels as energy has to be imported from external ancillary services such as the snowy mountain hydro scheme. These ancillary services are needed to compensate for the shortfall of power whilst the necessary black coal power margin is ramped up to take the rising afternoon consumer load leading into the evening peak in South-east Queensland.
Having to forecast for demand with so many fluctuating and intermittent factors that the energy network is comprised of, let alone with now the large installed PV capacity is difficult. PV is having such an effect when trying to forecast accurately, that AEMO1 now publishes a quarterly Energy Adequacy Assessment Projection (EAAP) document in light of this.
This subsequently forces the Queensland electricity grid to take corrective measures to maintain grid stability. Maintaining this grid stability at low voltage (LV) levels is relativity easy through the use of Automatic voltage regulating equipment (AVR) and Load Drop Compensating Equipment (LDC), which when on load tap change the necessary transformers in compensation of the load variations. However at high voltage (HV) stability becomes more complex, mainly due to the HV system being interconnected system unlike the LV systems being a radial configuration. Mismatches in active and reactive power generated and demanded can give arise to frequency fluctuations and voltage fluctuations respectively2 being an area of concern.
Therefore compensation measures need to be taken to prevent these occurrences from happening in the flux period for approximately an hour or more where the bulk generators are increasing their output in response. Such methods include utilising the National Electricity Market (NEM)3 to import power from other regional market jurisdictions as stated before; however this is an expensive endeavor. Other contingency measures include load shedding or the utilization of spinning reserve resources, where the minimum reserve level (MRL) in Australia for each region is calculated by 10% probability of exceedence of the scheduled regional maximum
1 (AEMO, 2011c)
11
demand conditions4. This reserve capacity however is not used in this manner so it is not a viable option. Therefore with all conventional means considered the solution lies simply in the addition of suitable generation capacity to stop such problems within the electricity grid and to maintain SEQ‟s power security.
AMEO within their Power System Adequacy Report that „no more than 0.002% of demand in any region should be interrupted due to a lack of supply‟(AEMO, 2011c). This consequently results in Queensland
requiring more than 900 megawatts of highly versatile reserve capacity, a market of which a pumped hydro storage system would comfortably fit into.
Therefore the fundamental outline of this study is to investigate SEQ‟s PV fluctuation problem, and in turn investigate if there are other cost effective and more sustainable solutions available. A possible solution to this problem potentially lies within the concept of a Pumped Hydro Energy Storage (PHES) scheme, with a
sustainable PV or wind energy element potentially incorporated to provide additional renewable energy that then is able to be stored. This energy can then be time shifted to support the often unpredictable afternoon shoulder load rise in addition to the fluctuating PV system, as well as be potentially available to help hem the evening peak demand.
Therefore the key objectives in this project are to investigate and evaluate if such a PHES scheme would benefit SEQ and its power grid by further increasing energy security in face of the changing energy climate. This project is also to assess if such a project could become a necessary piece of Queensland based
infrastructure that would also be sustainable and profitable.
1.2: Introduction
This problem is challenging due to the rapidly changing energy output of SEQ‟s PV system coupled with the slow in comparison coal fired power station units reaction times, of which are measured generally in 30 minute intervals. Therefore to maintain grid stability, power importation reliance is on other expensive Eastern
Australian bulk energy suppliers via Queensland‟s East-link connection to compensate.
Furthermore electricity within the network cannot simply be switched and moved easily within the system. The start, prediction and tracking of the afternoon shoulder rise to evening peak load change needs to be balanced. Failing to do so requires reliance on other interstate supply surpluses, or can in fact mean energy from other hydro systems in New South Wales has to be imported. Such systems being the Kosciusko Snowy Mountains Scheme or even possibly Tasmania have to be then ramped up in provision for Queensland‟s short time load changes. This ultimately means additional expense to Queensland customers. Thus energy storage is a
necessary infrastructure development if solar or other sustainable energy sources penetration is to continue to grow to provide power for such purposes, with potential as well for future export from Queensland.
12
On the other hand if the demand cannot be satisfied by imported energy from the NEM, then load shedding needs to be carried out of which then can cause possible logistical problems. This is done to try and balance available generation supplies from both within Queensland and other external interstate sources on the energy network, along with load switching upon the grid to move power to the necessary locations. This can be carried out with the addition with Queensland‟s spinning reserve capacity to maintain grid security; however this capacity is generally only used to compensate for generation and transmission outages5 and not for power fluctuations.
This is the justification for the study, to find if a PHES system, with or without a PV and wind sustainable energy component maybe an economical future infra-structure development for SEQ. It would greatly aid the stability of SEQ‟s electricity network in a variety of ways whilst also aiming at being a more cost effective
resolution, reducing the cost of power for not only the producers but also for the consumers.
Furthermore in future it may also allow Queensland‟s high availability of PV energy generation sites to become a net exporter of energy, as there would a way to store the power. This also could be a means of developing a future energy EHV DC link into the South-East Asia energy market via Singapore as the demand here is ever rising.
1.3: The Problem
The problem stems directly off the significant and largely unpredictable PV generation capacity SEQ integrates into the transmission grid. This form of renewable generation is subject to many external environmental factors constantly altering output, of which having major implications for the quality and cost of power in SEQ. Both commercial and domestic PV arrays play apart here as their combined outputs throughout the day reduces the total demand from the bulk electricity suppliers, but this is not the problem. The main problem lies within the afternoon shoulder load rise period where subsequently the total PV output reduces at the same time demand starts to increase. This occurs due to the solar exposure drops as the sun goes down approximately at the same time. Therefore the power companies have to increase their output to compensate for not only the shoulder demand rise, but additionally for the PV generation output reduction also. Compensation for these changes is difficult to achieve as both changes are unpredictable and dynamic in nature changing on a daily basis6. This anomaly is evident in Figure 1 showing the comparison between Queensland‟s energy demand with and without solar.
13
When AEMO effectively tries to predict the often unpredictable afternoon shoulder load rise, having to take the large PV component into consideration also makes controlling the system ever more difficult. With such
possible large variations in both power production and consumption within the network, keeping the network within tight tolerances does not come cheap to energy producers or consumers.
The integration of this unknown intermittent generation has been one of the main struggles for some renewable technologies7. The main technologies subject to this are wind and solar renewable schemes. These schemes form the bulk of world renewables generation of which the total global PV generation was approximately 67GW by the end of 20118, while total global wind generation reached approximately 318.5GW by the end of 20139. Furthermore according to Global Trends in Renewable Energy Investment 201410 states that 44 percent of all world generation capacity installed in 2013 was renewable power. This statistic depicts the large
renewable power movement across the world, and it brings with it a necessity from more effective storage options to negate the most prevalent problems associated with it.
1.4: Research Objectives
To ascertain if installing a pumped hydro energy storage system would be effective in helping to mitigate the effects of the growing photovoltaic generation in South East Queensland. The main area on concern is the afternoon shoulder period of which grid security is most at risk due to the large installed utility and domestic
7 (Luoma, 2009) 8 (IEA, 2014)
9 (Shanghai/Bonn, 8 April 2014) 10 (Finance, 2014)
[image:13.595.162.477.65.267.2]Point Of Interest.
14
solar generation, the unknown possibility of weather effects and the period in the demand cycle when the variations are most likely to occur.
To verify if the intended site is able to be developed, being that there is no cultural or environmentally sensitive areas within the location of the PHES or renewable systems.
To confirm that the PHES system would not only aid in maintaining grid security but also be an economically viable and sustainable piece of infrastructure for Queensland.
To ascertain if the addition of renewable technology into the system to aid in pumping would be a beneficial endeavor, and to measure what renewable fraction of total load would optimal.
1.5: Conclusions
In conclusion the intended location of the proposed system proved to be more then appropriate, having no pre-existing issues associated with it. The PHES system however from initial testing yielded results even under optimal conditions, that make it simply unviable economically. Such a system requires a large amount of initial capital to construct, along with the operating equipment being expensive also. This is largely in regards to the pumping and generating equipment of the plant being more expensive as it is not a conventional system. Additionally the renewable elements of the project proved to be very beneficial with many of the optimal models containing a renewable fraction greater than 50%. This result was very pleasing as a large renewable fraction was envisioned for this project to reduce its environmental footprint.
15
Chapter 2 - Literature Review
2.1: Introduction
As renewable energy is becoming more prevalent within society with various technologies being advanced and researched, some of the old associated problems still plague the industry. These problems arise primarily from the intermittency of which most of the main renewable systems rely upon. Having to depend upon mostly unpredictable chaotic events such as the weather is not adequate for when supplying to such a complex power grid.
2.2: Pumped Hydro Energy Storage
Hydro electricity is one of the most prevalent forms of renewable energy generation in the world today, producing approximately 3 288TWh being around 16% of world energy production in 200811. Pumped Hydro as a part of this accounted for 127GW of the total worldwide capacity in 2009 and is continuing to grow as PHES is currently the most established and economical large scale from of energy storage technology. This technology effectively allows for bulk energy suppliers to use their excess energy output in times of fluctuating load to store the power so that it can be time shifted for future peak periods. Essentially PHES is a battery with the electricity being stored not conventionally as a potential difference, but as a head of water.
Furthermore contemporary bulk energy generators cannot effectively or rapidly change their outputs with respect how fast the demand can fluctuate, and therefore a need for such large scale ancillary support is required of which PHES can provide effectively also12. The previously stored energy which otherwise would have been „wasted‟ now could be stored and used to support the bulk produces in times of need. This would help maintain grid security within the system, or even just be used in a time of peak demand and sold for a much higher price for profit.
The one way a PHES system differs from a conventional hydropower plant is that in a PHES system there is a pumping element to cycle the water back up to its original location before being used, so that it may be used again. This allows the same water to be used for generating many times, a trait being of great benefit to a continent such as Australia that suffers heavily from drought so often.
2.2.1: Reservoirs of Interest
2.2.1.1: Perseverance Dam
Perseverance Dam
Maximum Height 56 m Approx.
Crest Length 207.7 m
Dam Crest level EL 452.6 m
16 Figure 2: Location of Proposed PHES site. (Google Earth, 2014)
Cressbrook dam
Storage capacity at crest 46 000 ML
Maximum capacity level EL 446 m
Surface area when full 216 ha
Storage capacity when full 31 000 ML
Minimum operating level EL 422 m
Capacity at minimum
operating level 3 400 ML
Catchment spread 110 km^2
Historical Safe Reservoir
yield (1994 GHD report) 4 800 ML/annum (13.2 ML/d)
2.2.1.2: Cressbrook Dam
Perseverance Dam
Crest Length 20.3 m
Dam Crest level EL 290 m
Storage capacity at crest 134 000 ML
Maximum capacity level EL 280 m
Surface area when full 517 ha
Storage capacity when full 81 800 ML
Minimum operating level EL 250 m
Capacity at minimum
operating level 3 100 ML
Catchment spread
(Including Perseverance) 326 km^2
Historical Safe Reservoir
yield (1994 GHD report) 9 200 ML/annum (25.2 ML/d)
17
2.2.2: Bulk Water Supply Demand
Supply demand was estimated by TCC‟s (2002) internal assessment of the area, of which found that for long
term planning 340 liters per day per person for a population of approximately 108,850 with a growth rate of 1.4% was adequate. Therefore the current total demand for the region of which these respective dams supply is 37ML/d.
The daily water demand that is required from each of these reservoirs for commercial and domestic use is of high importance when considering this project. This is largely due to the fact that the suggested hydro project will be continually shifting large amounts of water between reservoirs whilst operating, and in doing so creates the possibility of creating a bulk water shortfall for the region. This possibility is even more likely to occur in times of drought when water restrictions need to be enforced. Thus consideration needs to be taken here when generating or pumping to ensure that a water shortage is never to occur as a consequence of the PHES‟s
operations.
2.3: Project Cost
[image:17.595.66.509.43.356.2]For the purpose of this costing section the proposed PHES system will be assumed to be operating for 24 hours per day, having 12 hour pumping and generating cycles. Additionally a PHES station rated at 500 MW will be the main focus of investigation with all project costs based upon this arrangement. For modeling purposes other capacities may also be considered, but to obtain a good baseline of project costs a station of 500 MW was
18
chosen as it is the worst case scenario. It should be noted that the 500 MW option is excessive however as the required capacity of the dam needed to supply such a station is approaching the possible upper limits if a 12 hr pumping/generating cycle is used.
For a 100 MW station the instantaneous flow rate is approximately 75 m^3/s with a daily volume of 3,200 ML. Additionally for all construction costs being headwater storage catchment earthworks, dam construction and all other necessary work to be carried out, the full construction will approximately cost 270 million.
It can be assumed that operation and maintenance costs for the hydro plant will likely be the sum of 0.05% of the initial investment per annum for the civil works and 1% for the mechanical and electrical equipment, or approximately 1.5-2.5% of the initial investment with an expected working life of 40 years13.
2.4: Afternoon Shoulder Demand and Intermittent Generation Systems Effects
The afternoon shoulder demand for not only Queensland but also Australia is of special concern within this project. This is largely due to the impact that the various PV systems in Australian and Queensland are having upon it, and is quickly becoming an area of concern. Solar generation is ever increasing at quite a rapid rate and thus becoming more prevalent within the electricity grid, with its impact continuing to worsen if not addressed. For example in 2009 Australian PV capacity was around 180 MW, of which now has grown considerably to approximately 3 GW of installed capacity14. This growing renewable generation capacity is great allowing homes to become electricity self-sufficient reducing the impact that conventional generation systems are having upon the earth. However with the many benefits solar power brings to people, it brings problems also for the electricity grid and its operators.
Solar generation was originally not recognised in AMEO‟S forecasting, as its contribution and impact on the system was so minor. This now however is not the case with rooftop PV growing from approximately 23 MW in 2008 to 1,500 MW by the start of 2012. Additionally this figure is forecast to rise further, reaching around 12,000 MW by 2031 under a moderate growth scenario. Under a rapid growth scenario the rooftop PV in Australia could account for 10% of the gross power generated by 2031, as opposed to 2011where it accounted for only approximately 0.6%. This is quite a substantial growth rate, and as a consequence PV currently and will continue to have an increasingly significant impact upon the grid. Due to this AMEO now releases a rooftop PV document detailing its analysis of the existing PV capacity and forecast generation levels alongside the other forecasting reports15.
19
The electricity grid was also originally designed to be a one way system from the generators to the customers. Rooftop PV is now effectively splitting this originally unidirectional supply chain into a two way system that of which it was not designed for. This creates clogging and compromises grid security, but only in times of high solar radiation. When there is low sun saturation across the PV systems (which can change rapidly from a high saturation state) consequently the adverse happens and a power deficit within the system can result. This then forces the conventional means of generation to be ramped up to compensate, with power having to be imported off the NEM whilst the large generators are in flux. This is an ineffective and costly solution, and with the projected increases in solar capacity in Australia the problems will only worsen.
2.4.1: South Australian demand variations
The possible future implications that grid installed PV generation could cause is already becoming most evident in South Australia. The PV systems within South Australia are becoming an issue even whilst their presence is effectively reducing the total state demand. This reduction in demand from such generation is not only reducing the overall demand, but is changing the historical peak and shoulder demand levels and most importantly the transition times between the two. This trait is problematic and evident within the figures 4 and figure 5 below with the pink profile being of primary interest.
[image:19.595.64.525.414.687.2]Figure 4 shows South Australia‟s Average Demand for the summer months, December to January from 2008 to 2013 with the second graph depicting the percentage difference of each year from the base reference year 2008. It should also be noted that the summer months is when the installed PV has the highest grid penetration levels due to this period yielding the highest daily solar exposure levels.
20
Rooftop solar alone was contributing 2.4 percent to the total demand in 2013, with more than a third of the installed PV generating though the shoulder/peak demand period16. This is apparent within the demand profiles above, as the shoulder into peak period in 2008 approximately between 9am to 3pm is significantly more than 2013. Furthermore 2008‟s profile is quite a predictable and definite demand progression; as the years progress
this demand progression becomes more sporadic and unpredictable.
The second period of note is the shoulder and peak periods between approximately 3pm and 7pm. This transition into peak period is much more abrupt in 2013 as opposed to the previous years. The difference see here is due to the time of day, the installed domestic PV and demand. Customer demand though this period is at the highest levels for the day, whist at the same time sun exposure is diminishing. This prevents the PV systems from continuing to generate and users to be electrically self-sufficient, and thus forces customers to switch back onto mains power. For example the afternoon demand in 2013 is 15 percent less than at the same time in 2008. Then as the nighttime peak period approaches the demand in 2013 effectively transitions back to being higher than that was seen in 2008.
This universal drop in PV power coupled with demand being at peak leads to the demand profile in figure 4. These sharp variations in demand in 2013 as opposed to previous years puts the grid under increasing pressure when trying and compensate, compromising grid security.
The severity of this change from 2008 to 2013 is more prominent within the percentage difference graph in figure 4. The drastic difference coupled with the rate of variation change here is concerning not only because of the immediate concerns but also because the cause of this, being the installed PV systems are ever growing not only in South Australia but Australia as a whole.
Furthermore PV has also changed the peak period time and demand at peak times, again signifying the impacts that PV is having upon the grid. With reference to figure 5 showing the peak demand for summer months profile and the percentage difference graphs, it clearly shows how the peak period has been moved more into the night as opposed to late afternoon in previous years. Again this is because the PV systems are taking the load throughout the day, then as night approaches grid energy is then required once again.
A special point of interest should be taken also between approximately 0900 and 1600 hours on the percentage difference graph. The Demand here has gotten progressively less and less as this is the period where PV generation is most effective and has the highest penetration. The 2013 profile in regards to the 2008 profile actually goes below the historical demand, and is also considerably much less than the other previous years also. This is of benefit as less gird power is needed as more green renewable energy is being utilised. However the problem arises here approximately around 1500 to 1800 as the solar intensity decreases and the penetration
21
of the PV is drastically lessened. This leads to a sharp increase in demand, where the 2013 profile exceeds the 2008 and 2010 profiles in a very short time. Conventional bulk grid coal fired generators cannot react to this change promptly enough with other means of generation are needed to compensate for this change17.
This sharp increase in afternoon shoulder demand due to the reduction in solar intensity as the sun goes down can be made more unpredictable with the addition of unknown weather events occurring such as cloud cover. Factoring in weather as a major contributor to the effectiveness of PV, again makes the future demand profiles change once again adding to the unpredictability.
This is the problem SEQ is facing due to the afternoon weather front that can occur on a large scale rapidly, changing the forecasted peak and shoulder demands on a daily basis. This then leads to the possibility of large and fast increases in demand that conventional generators simply cannot compensate for due to the increasing number of PV systems in SEQ like that of Western Australia, with concerningconsequences.
Figure 6 shows the results of a study undertaken by Ausgrid, who measured 26,651 solar domestic customers to ascertain the summer peak demand reduction due to solar. The study found that PV reduced the peak demand by 36MW, reducing the peak by 2.5%18. This graph again reaffirms the fast demand increase for the shoulder periods, and signifies the behind the meter generation problem solar is having upon the grid as the bulk power suppliers simply cannot manage such drastic change.
[image:21.595.63.502.164.389.2]
17 (Parkinson, 2013b) 18 (Simpson, n/a)
Figure 5: Peak Demand In SA for summer months. (Parkinson, 2013b)
22
2.5: Optimal PHES Generating Periods
The premise of the problem is that Energex and Ergon can predict the evening shoulder peak demand, and then peak demand rollover point wrongly. This can result in the need for importation of energy for half hour periods at more exorbitant costs.
Figures 7 and 8 illustrate the issue using selected data points from the overall AEMO data19. Illustrated here is the real cost that can be involved in generation. Normally hydro-generation input into the grid for pumped storage applies for costs either >$100 to >$150/MWhr. So these historical records provide an idea of the contingency events which require power importation or hedging contracts for such demand.
19
[image:22.595.90.478.77.324.2]http://www.aemo.com.au/Electricity/Data/Price-and-Demand/Aggregated-Price-and-Demand-Data-Files/Aggregated-Price-and-Demand-2011-to-2015, accessed 13/05/2014.
23
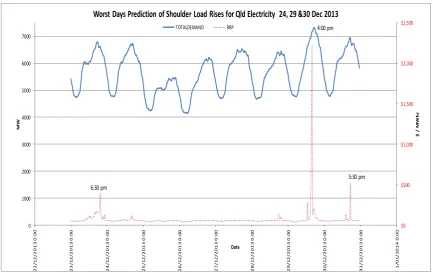
Figures 7 illustrates the evening summer peak prediction process occurring around 7 p.m.; with Figure 8 similarly illustrating the afternoon shoulder rate of rise of energy demand in mid-winter that coincides with the beginning of people to return to their dwellings. Predicting such rate of rise and peak is difficult for power supply / generation authorities and this is the market that pumped hydro-generation can participate in, especially when considering the increasing PV implications and the effect it has here.
$0 $500 $1,000 $1,500 $2,000 $2,500 0 1000 2000 3000 4000 5000 6000 7000 8000 21 /08/2 013 12 :0 0 21 /08/2 013 18 :0 0 22 /08/2 013 0: 00 22 /08/2 013 6: 00 22 /08/2 013 12 :0 0 22 /08/2 013 18 :0 0 23 /08/2 013 0: 00 23 /08/2 013 6: 00 23 /08/2 013 12 :0 0 23 /08/2 013 18 :0 0 24 /08/2 013 0: 00 24 /08/2 013 6: 00 24 /08/2 013 12 :0 0 24 /08/2 013 18 :0 0 25 /08/2 013 0: 00 25 /08/2 013 6: 00 25 /08/2 013 12 :0 0 25 /08/2 013 18 :0 0 26 /08/2 013 0: 00 26 /08/2 013 6: 00 26 /08/2 013 12 :0 0 26 /08/2 013 18 :0 0 27 /08/2 013 0: 00 27 /08/2 013 6: 00 27 /08/2 013 12 :0 0 27 /0 8/ 2 01 3 18 :00 28 /08/2 013 0: 00 28 /08/2 013 6: 00 28 /08/2 013 12 :0 0 28 /08/2 013 18 :0 0 29 /08/2 013 0: 00 29 /08/2 013 6: 00 29 /08/2 013 12 :0 0
22, 23 & 28 August 2013 - Worst Days Prediction of Maximum Generation Capaicty Required
TOTALDEMAND RRP
[image:23.595.58.492.71.351.2]7:00pm 7:00pm 7:00pm
Figure 8: Worst Days Prediction of Minimum Generation Capacity Required. (AEMO, 2013)
$0 $500 $1,000 $1,500 $2,000 $2,500 0 1000 2000 3000 4000 5000 6000 7000 2 2 /1 2 /2 0 1 3 0 :0 0 2 3 /1 2 /2 0 1 3 0 :0 0 2 4 /1 2 /2 0 1 3 0 :0 0 2 5 /1 2 /2 0 1 3 0 :0 0 2 6 /1 2 /2 0 1 3 0 :0 0 2 7 /1 2 /2 0 1 3 0 :0 0 2 8 /1 2 /2 0 1 3 0 :0 0 2 9 /1 2 /2 0 1 3 0 :0 0 3 0 /1 2 /2 0 1 3 0 :0 0 3 1 /1 2 /2 0 1 3 0 :0 0 1 /0 1 / 2 0 1 4 0 :0 0 $ / M W hr MW Date
Worst Days Prediction of Shoulder Load Rises for Qld Electricity 24, 29 &30 Dec 2013
TOTALDEMAND RRP
6:30 pm
4:00 pm
5:30 pm
[image:23.595.53.492.511.790.2]24
There are several sharp spikes evident within both graphs with certain periods the cost of electricity exceeding $2,000 dollars per megawatt hour. These points are essentially where demand was not accurately forecast causing a generation shortfall with power then having to be imported.
Figure 9 illustrates the weekly volume average spot price for Queensland from 08/06/08 to 08/2/1420. Due to graph taking into account only the weekly averaged prices, the actual cost per megawatt hour at the time of occurrence would be much higher and needs to be considered.
This data will be used within the excel model to estimate at what cost the trade of electricity effectively has to reach before it is viable to bring online the PHES system to generate. Consideration on all investments and running costs involved along with the quantity of purchased power needed for pumping needs to be accounted for.
What has previously largely hindered such intermittent ancillary services in Queensland is that there is currently no large-scale switchable load feed-in tariff specifically designed for such stations. Currently large scale consumers requiring a demand over 100MWh per annum are charged not only for the energy consumed, but are additionally charged for each kilowatt per month of chargeable demand. For example a system that requires a load of 30MW for a singular hour over the period of one month will be billed for the entire month.
20 (A. E. Regulator, 2014)
0 50 100 150 200 250 300 350 400 450 08 -06 -08 08 -08 -08 08 -10 -08 08 -12 -08 08 -02 -09 08 -04 -09 08 -06 -09 08 -08 -09 08 -10 -09 08 -12 -09 08 -02 -10 08 -04 -10 08 -06 -10 08 -08 -10 08 -10 -10 08 -12 -10 08 -02 -11 08 -04 -11 08 -0 6-11 08 -08 -11 08 -10 -11 08 -12 -11 08 -02 -12 08 -04 -12 08 -06 -12 08 -08 -12 08 -10 -12 08 -12 -12 08 -02 -13 08 -04 -13 08 -06 -13 08 -08 -13 08 -10 -13 08 -12 -13 08 -02 -14 $ pe r M W h Week Commenceing
Queensland's weekly volume weighted average spot price ($ per MWh)
25
Under tariff 44 – businesses over 100MWh per annum (Demand Small)21, the demand charge cost alone for a 30MW plant would equate to 1.15 million dollars per month regardless of time used plus energy consumed.
This demand change that utility scale tariffs impose in SEQ make intermittent generation/demand plants like that of a PHES station simply too expensive to deem a viable option. Such systems would only require grid electricity on rare occasion as opposed to other clients of similar scale, where having such a fee for infrequent electricity use is simply unrealistic and not sustainable.
If such a system like that of the PHES one proposed here was to use this tariff it would cost approximately upward of $80,000 per day. This is if the system where to operate for 240 days per year, with a ten hour pumping period at 30MW.
2.5.1: Future implications
The PV penetration and intimacy problem is only forecast to worsen as the year‟s progress, of which Figure 10
depicts. For example 2018 is forecast to be possibly as much as up to 70 percent less though the middle of the day of which then after this period and PV trend reaming, there is a sharp and drastic increase in demand once again as discussed before. Demand could possibly go from 30% less to up around 107% more than the demand in 2008% in a three-hour period. This yet again signifies the detriment to grid security PV is imposing upon the systems in Australia, where fast acting ancillary generation capacity needs to be installed to ensure that there is enough such capacity when needed to keep the power grid stable. One such means of generation is PHES22.
21 (Dr Malcolm Roberts, 2014) 22 (Parkinson, 2013b)
26
Based upon these forecasts the prognosis is not good being clearly evident in figure 10 also. Once again such a drastic rise in demand in a very short period of time coal fired power stations just cannot adapt. If this trend is going to continue not only in South Australia but all over Australia, without adequate generation capacity to counterbalance the effects grid security will be compromised affecting all customers upon the mains supply.
2.6: Current Relevant Trends within Thesis
This research project has been constructed heavily reliant upon several current trends within the solar industry and electricity market, which are currently evident within not only Queensland but Australia also. These trends within each industry have largely been driven by the variations within the opposite market, each being
somewhat of a catalyst for the changes within the other cyclically.
2.6.1: Photovoltaic Trends
The Climate Commission released a report upon the solar generation within Australia that of which underlined a major finding, that the growth of the installed PV within Australia has already exceeded the forecasts23. This is largely due to advances within the technology with it becoming cheaper being a quarter of the cost as
opposed to ten years ago, even without the solar rebate scheme in place with solar/grid parity being achieved in more places across Australia. With parity being achieved and more people becoming energy conscious, it is only natural for the solar capacity to rise within Australia as it continually becomes a more attractive option then being grid connected. This is so much so that it is predicted solar generation will account for 29% of Australia‟s total energy needs by 205024
.
The PV growth is Australia has been very rapid. For example in 2009 the solar capacity in Australia was approximately 180MW. Then in 2013 within period of only four years, the installed solar capacity reached
23 (Castaneda, 2013) 24 (Castaneda, 2013)
27
3GW in total with the national solar penetration reaching 14%25. This rapid growth was largely contributed to the feed-in tariffs of which now have been abolished, however this hasn‟t stopped the trend of more people moving towards solar power. The slow propagation of solar is now being driven by the increasing costs of grid power as opposed to the benefit of feed-in tariff. More people are choosing to be energy self-sufficient with the cost of the solar system being paid off within a few years, as opposed to having to fund constant and ever increasing energy bills.
The events mentioned directly above are higlighed by the point of intest (POI) within the above figure 12, with the data from 2012 onwards being the forcast increases. The sharp increase in PV installations where because of the feed-in tarrif incentive, with the sharp decrease again resulting as a consequence of the abolishment of this incentive. However after this the solar uptake rate regained momentum and if forecast to steadily rise onece again at varying rates depending on each growth scenario.
AEMO has modelled several PV growth rate scenarios for Australia to produce the predictions as shown in figure 12 for the years 2012-2022. The results from this study showed that the entire installed PV capacity will reach at minimum 6 GW by 2022 under the slow uptake scenario, with the fast uptake scenario approximating that 18 GW could be achieved within the same time frame. Therefore PV by 2022 could possibly be
contributing 9 to 20 percent of Australias total generation capacity26.
Thus the assumption made within this project, that of being the installed PV generation capacity within Australia is going to continually rise over the coming years is supported and justified by AEMO‟s findings.
2.6.2: Electricity Price Trends
[image:27.595.117.448.184.395.2]
25 (Parkinson, 2013a) 26 (Johnston, 2012)
Figure 12: Australian PV industry growth forecasts (Johnston, 2012)
28
The retail cost of electricity has been steadily on the increase for many years, with high increases in not only energy costs but network costs occurring recently. For example a study into the long term changes in average electricity prices in Australia conducted by Ernst & Young Australia27; found that for Queensland the retail electricity price from 1996-97 to 2012-13 rose by 57%. Furthermore network prices within the same time period increased by 140%, along with other associated miscellaneous costs rising by 11% as depicted in figure 13. This has led to an increase of $932 for today‟s average electricity customer on their electricity bill, with an additional $619 increase upon the network bill.
In addition to this electricity costs are forecast to continually keep rising as detailed within AEMO‟s Economic outlook information paper 201228. AMEO predicts for Queensland and basically the entire NEM that from 2015 forwards electricity prices will continually rise in increments of 1% to 2% per year until at least 2022. This price progression is evident within figure 14.
Therefore the assumption made within this project regarding the gradual increase in the cost of electricity for several years to come is justifiable.
27 (Young, 2014) 28 (AEMO, 2012)
Figure 13: Long term change in Average annual electricity price. (Young, 2014)
29
2.6.3: Network Cost Increase and Grid parity
Cost of electricity is forecast to rise due to many contributing factors with the installed solar systems playing a major part, however this connection is not clearly apparent. The Queensland Competition Authority (QCA) has indicated that the average domestic electricity tariff is set to rise by an additional 13.6 percent by July 2014 after previously being raised by 22.6% in 2013. Consequently the past three years have seen prices rise more than 50%, largely due to the rising costs of primarily transmission and network costs followed by retail and generation29. Network cost attributes for 44 percent of tariff 11‟s (standard residential tariff figure 15) overall cost30, of which solar generation has largely assisted.
The relation to drastic cost increases and solar power again is not clearly apparent and needs some explaining. Over the last five years network companies have spent 45 billion on upgrading the transmission network. This was carried out in anticipation of future significant electricity demand increases, and was justified by the forecasted data. Simply an expanding population and ever growing dependency upon electricity will be the catalyst in driving demand up. With demand forecast to continually rise, the network companies preemptively put into action $45 billion dollars from about 2009 over five years into upgrading the system to compensate for these changes.
However at approximately the same time the upgrading commenced the total demand did not rise; it in fact fell and has continued to fall. Despite of this the network companies continued to spend upgrading the
infrastructure convinced demand would once rise again. Their actions were also spurred on by the regulator of which guaranteeing them a return of every dollar plus a profit of 10%, facilitating this heavy impractical
29 (Howells, 2014) 30 (Supply, 2014)
Figure 15: Tariff 11 bill cost breakdown in 2014-15. (Queensland Competition
30
spending. In 2012 the Senate conducted an inquiry chaired by Labor MP, Matt Thistlethwaite into the cost of electricity of which he concluded that „What we found was those network businesses that earned the most profits were the ones that invested the most. So there was a perverse incentive in the system for an
overinvestment in the poles and wires, and that led to dramatic profits for those businesses, but of course it was the consumer that paid for that cost of that additional capital31.'
With a 70% rise in electricity of the past five years the costs involved with implementing a domestic solar power system is now reaching parity with grid electricity costs, even when considering the new solar in-feed tariffs32. Therefore with the continual rising costs of power mainly due to the overspending on unnecessary additional transmission capital (also largely due to PV), it is easy to speculate on theassumption that more of the domestic population will be driven to invest in personal PV systems as a result of this PV- grid parity.
PV is only becoming more attractive as the technology becomes more advanced thus reducing costs whilst improving efficiency, and with grid parity looming it can be easily hypothesized (See section 2.6.1) more domestic customers will make the change. If this is the case it will only intensify the problems PV is already
31 (Green, 2014) 32 (Lang Chen, 2011)
Figure 16: Domestic solar grid parity in Australia (Lang Chen, 2011) Red - Non-grid parity
31 Figure 17: Wind Generation Energy Time-Shift (Pete Singer, 2010 )
having upon the grid as capacity will increase, driving grid electricity prices higher whilst also making the demand profiles ever more sporadic.
It should be noted that Figure 16 is a generalised depection which is largely subject to change as many factors contribute to the actual onset of grid parity with each indivudal customer being different.
2.7: PHES for Renewable Integration and Power Time Shifting
One of the main issues associated with most renewable energy systems is their generation intermittency and unpredictability, affecting mainly wind farms and PV systems. Having to rely upon so many chaotic factors such as weather and other natural environmental factors each constantly in a state of flux causes such
32 Times of peak generation do not always coincide with demand and therefore the power generated through these times isn‟t needed, with the bulk energy resources also being much more cost effective. Furthermore the
constant state of flux the generated power is supplied in also is problematic to the electricity grid, of which has to be smoothed by some means to be used effectively. Effective large scale EES such as PHES can
accommodate for such renewables, providing a solution to these problems being able to successfully integrate the intermittent power33.
The power mainly in off-peak times would drive the pumping units within the PHES installation to move water from the lower catchment, back to the higher catchment effectively storing the renewable power as water head potential. This potential then can be kept here until times of peak demand of which then can be sold for high profits, as opposed to off-peak times when it traditionally would be sold where essentially it would be
unwanted. Furthermore in a contingency event or when ancillary support is needed a PHES system can provide such generation quickly at any period through the day where conventional renewables cannot. Therefore
emplacing such a system to readily store renewable energy has many benefits and vastly increases the usability, functionality, profit margins of owners and effectiveness of such renewable generation.
2.8: Ancillary Support and Market
Adequate ancillary support is essential to an electrical grid to maintain grid security in a number of ways. Depending upon the situation with type and amount of control required would specify the ancillary equipment needed or type of action that needs to be taken.
There are many forms of ancillary support of which are broken down into three different categories as stated in AMEO‟s Network support and control ancillary services (NSCAS) assessment 2012, being:
Network loading ancillary services (NLAS):
Standby generation capable of being brought online rapidly.
Fast runback of scheduled generating units.
Load reduction in response to certain signals.
Existing small-scale (non-scheduled) generation.
Phase-shift transformers.
Series or shunt compensation.
33
Controlled series compensation.
High voltage direct current (HVDC) links.
Voltage control ancillary services (VCAS):
The unused reactive power capacities of generating units.
Static reactive power compensators, such as capacitors and reactors.
Dynamic reactive power compensators, such as synchronous condensers, static VAR
compensators (SVCs), and static compensators (STATCOMs).
High voltage alternating current (HVAC) and HVDC transmission lines.
Control of customer load in response to certain signals.
Installation or use of existing small-scale generation.
Transient and oscillatory stability ancillary control services (TOSACS):
Generating plant, with properly designed and tuned power system stabilizers (PSS) for
improving frequency stability and reducing any oscillatory response in power networks.
Power flow and voltage control flexible alternating current transmission system (FACTS)
devices such as SVCs and HVDC links.
Series compensation to reduce system impedance.
Braking resistors 34 (Above definitions taken from AEMO web site)
Hydroelectricity fits into the ancillary support market under several of these categories along with the
generation market also, mainly due to its quick startup times and low startup costs. The actual startup time and cost for a hydropower plant depends on the technology used, with generally the cold startup times being approximately around five minutes, or if in synchronous capacitor mode less than 20 seconds. Also the ability of hydropower plants to readily vary the level of generation is also a very important and useful trait allowing for increased grid flexibility and stability yet again.
34
Furthermore a PHES scheme aside from the traditional hydropower plant offers additional grid support benefits due to its added pumping capability. This function is most useful in off-peak times to aide in stabilizing the grid and to keep the bulk energy generators online, negating shutdown and startup overheads as it can create load.
However the ancillary service area of generation supply has only minor cost impact on the overall operation of a pumped hydro, as shown by the service provision cost35 (figure 18 below).
Figure 18: NEM Customer Ancillary Services Cost. (AEMO, 2014b)
Additionally in the area of frequency stability control ancillary service support, there are six response
contingency based time bands, only of which two are available to hydro-generation: this is as detailed GUIDE TO ANCILLARY SERVICES IN THE NATIONAL ELECTRICITY MARKET36. These are
o Fast Raise (6 Second Raise) ([] Hydro-generation) o Fast Lower (6 Second Lower) ([] Hydro-generation) o Slow Raise (60 Second Raise) ([] Hydro-generation) o Slow Lower (60 Second Lower) ([] Hydro-generation) o Delayed Raise (5 Minute Raise) ([] Hydro-generation) o Delayed Lower (5 Minute Lower) ([] Hydro-generation)
2.8.1: Synchronous Condenser Mode for Grid Voltage Support
Transmission system operators specify a voltage program of which the various generators, being conventional or variable in nature are expected to follow. This means being able to adjust their reactive power output in
35 (AEMO, 2014b)
36 AEMO, Guide to Ancillary Services in the National Electricity Market, Document 160-0056 Version 1.01
35
order to maintain the voltage levels as specified. The ability to do this however for PV and wind generation systems relies primarily on the inverters and static compensates (STATCOM) used within the systems, being quite different to the conventional generation forms when compensating for the same factors. However the IEEE 1547.1 standard maintains that the power factor output has to be within 0.85 to unity lag or lead power factor (PF). This presents a problem for distribution PV and wind farm systems as they are required by legal statutory requirements to transmit power to a network at unity, and therefore in their current co-generation operation can offer only very little reactive power support when at maximum output capacity37.
However this is not a problem as the Pumped hydro system can operate in synchronous condenser mode, where the system is spinning however is not generating or creating load. Depending on its operation the PHES system could effectively generate or consume volt-amperes (VAR‟s)
2.9: Generator and Turbine systems
The motor/generator can either be an asynchronous machine or synchronous machine with a frequency converter allowing the pump/turbine to be varied in speed. This feature optimizes the operation of the turbine when generating as the desired output can be achieved and likewise when pumping, as it allows the amount of pumping to be adjusted to best fit each demand38. Having such flexibility within the system is invaluable, and being able to accommodate for all pumping and generating demands within the stations operating region enables the operators to run the station at optimum levels continually.
2.9.1: Turbines
There are two main types of turbines that are used for Hydroelectricity installations being Impulse turbines and Reaction turbines. What turbine is ultimately chosen for a project is chosen in regards to height of head, flow rate, volume of water at the location with efficiency and cost also being factors.
2.9.1.1: Impulse Turbines
Impulse turbines operate upon the velocity of the pressurized incoming water, of which it is then ejected out back to normal pressure. Impulse turbines generally consist of many runners upon a wheel, of which each coming into contact with the water stream at some point to generate torque upon the shaft. At the discharge point there is no suction generated with the water simply flowing away. These turbines are most suited for high head‟s with low flow rates.
Turbines that come under this jurisdiction is the Pelton and Turgo wheels, and cross-flow turbines. The Turgo wheel is a slight variant of the Pelton wheel, and the cross-flow turbine was essentially created for larger water velocities at lower heads of which the Pelton wheel was created for.
36 2.9.1.2: Reaction Turbines
Reaction turbines generate power from the pressure and velocity of the water, where the runner is in the direct flow of the water not being offset at all as opposed to the impulse turbines. These turbines are best suited for low head and high flow applications, basically being the opposite of impulse turbines.
Under reaction turbines there are three main variants being Propeller, Francis and Kinetic Turbines.
Propeller turbines generally have three to six blades all being in contact with the water at all times, and again there are many subtypes of this turbine also. Bulb turbines, Straflo, Tube and Kaplan turbines all fall under the jurisdiction of propeller reaction turbines.
Francis turbines consist of generally nine or more vanes, where water is injected above the vanes and falls though causing torque upon the wheel. Finally the last major variant is Kinetic turbines (Free flow Turbines) that like the name suggest, use the kinetic energy within the water as opposed to the potential energy of the head to generate torque. Kinetic turbines are generally situated within rivers, man-made channels, tidal areas and places subject to ocean currents where the kinetic potential of water is constantly oscillating39.
2.9.2: Reversible Pump Turbine Systems
Pumped Hydro Energy Storage essentially works exactly the same as conventional Hydropower schemes, except PHES incorporates an additional pumping element along with the normal turbine unit know as a
reversible pump turbine as in Figure 2. This system consists of a motor/generator with a pump/turbine making a hybrid component that can effectively undergo both generating and pumping actions.
39 (Energy, n/a)
Figure 19: Cross section of pump turbine/generator unit - (VIOTH, 2014) Motor/Generator
37 2.9.2.1: Ternary Set System
The motor/generator unit in a PHES scheme can incorporate both functions within the single unit as per figure 19, or there can be an independent pumping unit along with a generator unit known as a Ternary set. This arrangement is called a Ternary set as it consists of the motor-generator, a pumping unit and a separate what is generally a form of Pelton turbine40 as seen in figure 20. Having two individual units is generally the main approach as the technology and equipment differ for the functions of pumping and generating. Subsequently higher efficiencies can be achieved with two individual units as opposed to a universal unit, and therefore is why this method is generally used more universally in PHES stations.
These types of arrangements also could possibly yield additional operational benefits. For example pumping could continue whilst the system is operating in synchronous condenser mode for voltage support, as the
40 (VIOTH, 2014)
Figure 20: Ternary Set - (VIOTH, 2014)
To motor/generator
Turbine
38
pumping and generating systems can operate independently. However operations such as this would require additional infrastructure and equipment, but could prove to be highly beneficial.
2.10: Catchments
Pumped hydro utilizes two catchments, one being at a higher potential to give the adequate head necessary for generation as in hydroelectric plants. The water catchment above is used to store the water potential for generation, with the lower catchment being the spent potential water storage catchment41 as in figure 21. The top catchments potential is generally utilized during periods of peak demand to provide power when electricity is at its most expensive. During this period the bulk power producers normally can‟t meet demand alone and need such ancillary support to maintain grid security. After peak demand has subsided and the electricity time cycle goes into the off-peak period of which there is excess generation, this surplus cheap power is then used to pump the water from the lowercatchment back into the higher catchment. This restores the waters potential allowing the energy to be time shifted so that it can be used once again in the peak period, making more efficient use of the electricity generated within the off peak period42.
2.10.1: Catchment Head and Flow
Head in regards to hydraulics is the amount of potential per unit weight of water, of which is gained though elevating the water above sea level by a specified amount. Generally it is defined by meters of elevation above sea level, or the total change in height from water level from one catchment to another.
41 ("How Hydroelectric Energy Works ", 2006) 42 (Rachel Carnegie, 2013)
39
2.10.2: Power Output
Fundamentally all the different turbine arrangements used for Hydroelectricity conform mostly to the same set of rules that govern output. These laws are instituted in Euler‟s Turbine Equation that can be used generally for all turbines to give an approximate power output. This is because Euler‟s equation actually has nothing to do with the physical turbine itself or how it operates. This calculation is for the change in angular momentum of the water between the inputs to the exhaust, and thus is why can be applied to many situations.
Basically the equation first calculates torque enforced upon the shaft, which is then used to calculate power output. Basically the torque is equal to the change in angular speed of the water as it acts upon the turbine blades, then the power output is equal the torque generated upon the shaft multiplied by the shafts rotational speed43. The detailed description can be seen in figure 22.
Additional external factors also need to be factored in here such as the efficiency level of various components within the system such as the turbine and generator to yield accurate calculations.
43 ("HydroElectric Power," 2005)