University of Southern Queensland
Faculty of Health, Engineering & Sciences
Low-Cost Eye Tracker
A dissertation submitted by
Thomas J. Bradford
in fulfilment of the requirements of
ENG4112 Research Project
towards the degree of
Bachelor of Engineering (Computer Systems)
Abstract
Eye trackers have useful applications in numerous industries and fields of research. However, while commercial eye trackers currently exist for these applications, they are exceedingly expensive, limiting their application to high-end speciality products and thus making them unsuitable as a low-cost solution.
For this reason, a low-cost eye tracker utilising open-source software would greatly increase the accessibility of eye trackers to those who would benefit from the technol-ogy. Modern technology advancements have enabled off-the-shelf video hardware such as computer webcams and consumer video cameras to be suitable for use in an eye tracking hardware configuration while still maintaining their low cost and high acces-sibility. Furthermore, the development of open-source eye tracking software to operate in conjunction with this hardware has significantly facilitated the implementation of such hardware in the eye tracking system.
With the increasing dependence on computers and technology in everyday life, it is of increasing importance to study software usability testing and human-computer inter-action to enhance the user experience. This dissertation details the development of a low-cost eye tracker using off-the-shelf hardware and open-source software to analyse how learning tools are used by students.
University of Southern Queensland Faculty of Health, Engineering & Sciences
ENG4111/2 Research Project
Limitations of Use
The Council of the University of Southern Queensland, its Faculty of Health, Engineer-ing & Sciences, and the staff of the University of Southern Queensland, do not accept any responsibility for the truth, accuracy or completeness of material contained within or associated with this dissertation.
Persons using all or any part of this material do so at their own risk, and not at the risk of the Council of the University of Southern Queensland, its Faculty of Health, Engineering & Sciences or the staff of the University of Southern Queensland.
This dissertation reports an educational exercise and has no purpose or validity beyond this exercise. The sole purpose of the course pair entitled “Research Project” is to contribute to the overall education within the student’s chosen degree program. This document, the associated hardware, software, drawings, and other material set out in the associated appendices should not be used for any other purpose: if they are so used, it is entirely at the risk of the user.
Dean
Certification of Dissertation
I certify that the ideas, designs and experimental work, results, analyses and conclusions set out in this dissertation are entirely my own effort, except where otherwise indicated and acknowledged.
I further certify that the work is original and has not been previously submitted for assessment in any other course or institution, except where specifically stated.
Thomas J. Bradford
0050101049
Signature
Acknowledgments
This research project would not have been possible without the invaluable assistance and support of some key people.
First and foremost, I would like to thank my project supervisor Dr. Alexander Kist for offering the project and providing timely constructive feedback and guidance, keeping me on track throughout its course. I chose the project based on its element of design, providing a challenging, interesting and rewarding experience, and it did not fail to deliver. I am very thankful for this experience.
Secondly, I would like to thank my work supervisor, Ms. Karyn Onley, as well as my colleagues at the Leslie Research Facility Queensland Grains Research Laboratory for being incredibly flexible and understanding throughout the year, allowing me to prioritise my project work and take time off whenever required. I am extremely grateful to work in such an excellent workplace.
Finally, I would like to acknowledge the unconditional support and endless encourage-ment provided by my family and friends. They have been by my side not only for the duration of this project, but for all six years of my studies. Without them I wouldn’t be where I am now.
Thomas J. Bradford
University of Southern Queensland
Contents
Abstract i
Acknowledgments iv
List of Figures x
List of Tables xiii
Nomenclature xiv
Chapter 1 Introduction 1
1.1 Background . . . 1
1.2 Motivation . . . 3
1.3 Project Aim . . . 4
1.4 Research Objectives . . . 5
1.5 Overview . . . 5
CONTENTS vi
2.2 Eye Tracking . . . 7
2.2.1 Methods . . . 7
2.2.2 Hardware . . . 10
2.2.3 Software . . . 12
2.3 Data Analysis and Visualisation . . . 15
2.3.1 Fixation Identification . . . 15
2.3.2 Eye Tracking Metrics . . . 19
2.3.3 Visualisation . . . 20
2.4 Summary . . . 22
Chapter 3 Methodology 23 3.1 Outline . . . 23
3.2 Requirements Analysis . . . 23
3.2.1 Hardware Requirements . . . 24
3.2.2 Software Requirements . . . 27
3.3 Assessment of Consequential Effects . . . 29
3.3.1 Safety Issues . . . 29
3.3.2 Ethical Considerations . . . 30
3.4 Risk Assessment . . . 30
3.5 Project Timeline . . . 31
CONTENTS vii
Chapter 4 Design and Implementation 32
4.1 Outline . . . 32
4.2 Hardware Design . . . 32
4.2.1 Webcam Modification . . . 33
4.2.2 Mounting and Assembly . . . 37
4.3 Software Design . . . 41
4.3.1 Gaze Analyser Overview . . . 41
4.3.2 Session Class . . . 42
4.3.3 Metrics Class . . . 47
4.3.4 GazePlot Class . . . 48
4.3.5 HeatMap Class . . . 51
4.4 System Implementation . . . 54
4.4.1 Hardware Setup . . . 54
4.4.2 Network Servers . . . 56
4.4.3 Calibration . . . 58
4.5 Summary . . . 58
Chapter 5 Performance and Usability Evaluation 60 5.1 Outline . . . 60
5.2 Sample Output . . . 60
5.3 Gaze Accuracy . . . 61
CONTENTS viii
5.4.1 Head Movement Tolerance . . . 64
5.4.2 Cross-Platform Support . . . 65
5.4.3 Software Shortcomings . . . 66
5.5 Alternative Uses . . . 67
5.6 Summary . . . 67
Chapter 6 Conclusions and Further Work 68 6.1 Achievement of Project Objectives . . . 68
6.2 Further Work . . . 69
References 71 Appendix A Project Specification 75 Appendix B Preliminary Methodology 77 B.1 Risk Assessment . . . 78
B.2 Project Timeline . . . 80
Appendix C Data Sheets 82 Appendix D Source Code Listing 85 D.1 main.cpp . . . 86
D.2 global.hpp . . . 87
D.3 global.cpp . . . 87
CONTENTS ix
D.5 udp receive.cpp . . . 89
D.6 screenshot.cpp . . . 91
D.7 Point.cpp . . . 92
D.8 Session.cpp . . . 92
D.9 Metrics.cpp . . . 99
D.10 save bitmap.cpp . . . 102
D.11 GazePlot.cpp . . . 104
D.12 HeatMap.cpp . . . 109
List of Figures
1.1 Fixations and saccades when reading text (Wikipedia 2014). . . 2
2.1 Comparison of a bright pupil (left) and a dark pupil (right) (Morimoto, Koons, Amir, Flickner & Zhai 1999). . . 9
2.2 Bright pupil and corneal reflection due to infrared illumination (Poole & Ball 2005). . . 9
2.3 Four Purkinje images on the eye (San Agustin 2009). . . 9
2.4 Remote eye tracking system implemented by San Agustin (2009). . . 10
2.5 Head-mounted eye tracking system constructed by Mantiuk, Kowalik, Nowosielski & Bazyluk (2012). . . 11
2.6 Block diagram of the corneal reflection eye tracking system as proposed by Morimoto et al. (1999). . . 13
2.7 I-VT Algorithm (Salvucci & Goldberg 2000). . . 16
2.8 I-HMM Algorithm (Salvucci & Goldberg 2000). . . 17
2.9 I-DT Algorithm (Salvucci & Goldberg 2000). . . 18
2.10 I-MST Algorithm (Salvucci & Goldberg 2000). . . 18
2.11 I-AOI Algorithm (Salvucci & Goldberg 2000). . . 19
LIST OF FIGURES xi
2.13 A heat map produced by an eye tracking system. . . 22
4.1 Microsoft LifeCam VX-1000 webcam (Microsoft Corporation 2011). . . 33
4.2 Webcam screw locations. . . 33
4.3 Removing the front face. . . 34
4.4 Removing the PCB. . . 34
4.5 Removing the infrared blocking filter from the lens. . . 35
4.6 Photographic film behind the lens. . . 35
4.7 Schametic of the infrared illumination circuit. . . 36
4.8 Flattened section of aluminium wire with screw holes. . . 37
4.9 Front (left) and back (right) of the flattened section of aluminium wire wrapped in insulation tape with foam attached. . . 38
4.10 The webcam mounted to the alumnium wire. . . 38
4.11 Downward bending angle of the aluminium wire at the hinge. . . 39
4.12 Inward bending angle of the aluminium wire at the webcam. . . 40
4.13 Final head-mounted hardware design. . . 40
4.14 Head-mounted hardware being worn. . . 40
4.15 Image captured by the head-mounted hardware. . . 41
4.16 Gaze Analyser’s main window. . . 42
4.17 Gaze plot fixation ellipses. . . 51
4.18 Heat map weight gradient. . . 53
LIST OF FIGURES xii
4.20 Gaze Tracker camera settings. . . 56
4.21 Gaze Tracker tracking settings. . . 57
4.22 Gaze Tracker network settings. . . 57
4.23 Calibration results screen. . . 59
5.1 Gaze accuracy describing the angular distance between the gaze point of the user and the measured gaze coordinates. . . 61
5.2 Calibration point (light grey) displaying individual gaze samples (red) dispersed over a small area, indicating good precision. . . 64
5.3 Height-adjustable chin rest to stabilise the head for eye tracking. . . 65
B.1 Graphical timeline of project work. . . 81
E.1 Sample eye tracking results and metrics calculated using the low-cost eye tracking system. . . 118
E.2 Sample gaze plot generated using the low-cost eye tracking system. . . . 120
E.3 Sample ‘fixation count’ heat map generated using the low-cost eye track-ing system. . . 120
E.4 Sample ‘fixation duration’ heat map generated using the low-cost eye tracking system. . . 121
List of Tables
3.1 Hardware resource requirements for the head-mounted system design
based on Mantiuk et al. (2012). . . 25
5.1 Gaze accuracy for different user environments. . . 63
B.1 Risk assessment table. . . 80
B.2 Key dates. . . 81
Nomenclature
API Application Programmer Interface
FPS Frames Per Second
GDI Graphics Device Interface
HCI Human-Computer Interaction
I-AOI Area of Interest Identification
I-DT Dispersion Threshold Identification
I-HMM Hidden Markov Model Identification
I-MST Minimum Spanning Tree Identification
I-VT Velocity Threshold Identification
IDE Integrated Development Environment
IR Infrared
ITU Information Technology University of Copenhagen
LED Light Emitting Diode
PCB Printed Circuit Board
RANSAC Random Sample Consensus
TCP Transmission Control Protocol
UDP User Datagram Protocol
Chapter 1
Introduction
1.1
Background
Eye tracking is the process of measuring the gaze direction of a person to determine their line-of-sight or point-of-regard. In essence, it determines where a person is looking. Eye tracking technologies have useful applications in numerous industries and fields of research such as ophthalmology, psychology and psycholinguistics, cognitive linguistics, medical research, marketing and advertising research, product design, sport psychology and research, security and law enforcement, road safety and even aviation cockpit design (Tobii Technology 2013).
More recently, applications have extended to disability support, where a patient’s gaze is used as an input for human-computer interaction (HCI) (San Agustin 2009). Eye tracking technologies are also useful in usability testing and HCI research (Jacob & Karn 2003). With the increasing dependence on the use of computers in everyday lives, it is of equally increasing importance to study and analyse software usability testing and HCI in order to improve and enhance the user experience.
1.1 Background 2 occurs when the eye is fixed on a point of interest, typically for a duration of at least 100 milliseconds, whereas a saccade is defined by the rapid eye movement between two fixation points (Jacob & Karn 2003). This phenomenon is displayed in Figure 1.1, with fixations represented by shaded ellipses and saccades represented by solid lines connecting those ellipses.
Figure 1.1: Fixations and saccades when reading text (Wikipedia 2014).
Eye tracking technologies can be applied to the use of learning tools to improve their effectiveness. In recent times, computers have become a dependency in educational environments, with students of all ages frequently required to use them for research, writing, word processing, design, calculations and learning development. Learning tools can aid students in learning new concepts or practising learnt concepts, both consciously and subconsciously.
1.2 Motivation 3
1.2
Motivation
Section 1.1 identified the many eye tracking applications for research; however, Jo-hansen & Hansen (2006) questioned the need for eye trackers in their article, entitled
Do We Need Eye Trackers to Tell Where People Look?. They concluded that the valid-ity of user’s memory of their scan paths is limited in comparison to the recorded data, thus justifying the need for further research and developments within the field of eye tracking.
While commercial eye tracking solutions currently exist, they are exceptionally expen-sive and relatively inaccessible. San Agustin et al. (2010) state that “Commercial gaze tracking systems have been available for more than 15 years, but the technology is still a high priced niche”. Li, Babcock & Parkhurst (2006) report that “Until only recently, eye trackers were custom made upon demand by a very few select production houses. Even today, eye tracking systems from these sources range in price from 5,000 US dollars to 40,000 US dollars, and thus limit their application to high-end specialty products”. Furthermore, commercially available eye trackers can be platform specific, and difficult to use. A low-cost, open source system would allow anyone to explore eye tracking in many new ways (Babcock & Pelz 2004).
A seemingly popular commercial remote eye tracking solution is the Tobii X2 series from Tobii Technology, a company specialising in eye tracking and gaze interaction technology. As of March 2013, the Tobii X2-30 can be hired for 1,100 Australian dollars per month, or purchased outright for 20,000 Australian dollars, while the Tobii X2-60, with superior performance characteristics such as a higher degree of accuracy, faster refresh rate and reduced system latency can be hired or purchased for more than twice these respective prices. These prices are also non-inclusive of GST (r3dux.org 2013, Tobii Technology 2014).
From this information, it can be deduced that the high cost of commercial eye tracking systems makes them unsuitable for consumer use, and even unideal for some commercial use, particularly amongst small businesses and low-budget research corporations within the various industries that would benefit from such solutions.
1.3 Project Aim 4 evolve to a point where they are suitable for eye tracking hardware implementations while still maintaining their low cost and high accessibility. This has led to a growing interest in the use of low-cost components for eye tracking systems and the emergence of low-cost eye tracking as a field of research (San Agustin 2009).
As stated in Section 1.1, the use of eye tracking technology has its applications within an educational environment. The development of a low-cost eye tracking system can greatly improve the accessibility to eye trackers in the classroom for the analysis of the use of learning tools and educational software. This analysis can lead to improvements in the user interface of these tools and in-turn improve their effectiveness and appeal to students (Wang et al. 2006).
1.3
Project Aim
The overall aim of this research project is to develop a low-cost eye tracking system that can be used to analyse how learning tools are used by students.
From the information presented in Section 1.2, it is important that this research project should have an emphasis on low-cost design and accessibility to consumers, thus the system should utilise inexpensive off-the-shelf hardware and open source software.
Both the hardware and software implementations should be designed to perform op-timally, maximising the degree of accuracy of the hardware and the efficiency of the software while keeping the design simple and low-cost.
1.4 Research Objectives 5
1.4
Research Objectives
The research objectives involved with this research project form the basis of the project. Using the project aim presented in Section 1.3, the following research objectives were identified:
• Outline current eye tracking solutions, identifying their uses, cost and limitations
• Identify methods of eye tracking
• Identify techniques of analysis and visualisation of eye tracking data
• Select appropriate hardware and software for use with the low-cost eye tracking system
• Design, develop and implement the hardware and software components of the system
• Critically analyse and evaluate the system performance, optimising where neces-sary
The Project Specification in Appendix A presents a concise list of project objectives as identified and stipulated prior to the commencement of the project.
1.5
Overview
The remaining sections of this report are organised as follows:
Chapter 2 presents a literature review relating to and detailing numerous aspects of eye tracking, particularly with the use of low-cost off-the-shelf hardware.
Chapter 3 outlines the methodology for the development of the low-cost eye track-ing system, specifytrack-ing resource requirements for both the hardware and software designs.
1.5 Overview 6 Chapter 5 evaluates the performance of the low-cost eye tracking system, recognizes
limitations in the system and identifies alternative uses for the system.
Chapter 2
Literature Review
2.1
Outline
This chapter reviews literature relating to and detailing numerous aspects of eye track-ing, particularly with the use of low-cost off-the-shelf hardware. The topics covered in this literature review are separated into two main sections; eye tracking and data analysis and visualisation.
2.2
Eye Tracking
Comprehensive knowledge of eye tracking and gaze estimation is necessary to form the required in-depth understanding of principles for this research project. This section discusses the fundamental concepts of eye tracking and gaze estimation, identifying methods and techniques of execution and, subsequently, the various hardware configu-rations and supporting software, particularly with respect to low-cost eye tracking.
2.2.1 Methods
2.2 Eye Tracking 8 electro-oculography – a technique used to detect changes in electrical potential near the eye as the eye moved by placing electrodes on the skin around the eyes. A more accurate, yet more intrusive method required the use of contact lenses with an embedded coil, where changes in electrical potential as the eye moved were able to be measured when a voltage was induced in the coil with an electromagnetic field (Mantiuk et al. 2012). This required the contact lenses to be wired to an appropriate measuring device, thus making them very uncomfortable (San Agustin 2009).
A much less intrusive method of eye tracking involves the implementation of video-oculography – a technique which makes use of video capture hardware to record the gaze of the user. Image processing software is used in conjunction with this hardware to extract information about different eye features to measure the point-of-regard or line-of-sight. These eye tracking systems are arguably the most popular solution due to their non-intrusiveness while maintaining appropriate degrees of accuracy (San Agustin 2009).
Most common video-oculography eye tracking systems measure point-of-regard using the corneal reflection method (Goldberg & Wichansky 2003). In this method, the eye is directly illuminated by infrared light which is reflected on the retina, causing the pupil to appear as a concise disc in contrast to the surrounding iris. If the infrared light source is co-axial with the camera, the camera’s sensor is able to detect infrared light reflected on the retina, which causes the pupil to appear bright (known as the ‘bright pupil’ effect) (Poole & Ball 2005). This phenomenon can also be seen in flash photography, when a subject’s eyes can appear red if the flash is close to the camera lens. Conversely, if the infrared light source is off axis with the camera, the pupil will appear dark (Figure 2.1). In some eye tracking systems, images of both the bright pupil and dark pupil are obtained and subtracted from one another in order to detect the pupil more accurately and make the system more robust (Morimoto et al. 1999).
2.2 Eye Tracking 9
[image:24.595.221.362.251.342.2]Figure 2.1: Comparison of a bright pupil (left) and a dark pupil (right) (Morimoto et al. 1999).
Figure 2.2: Bright pupil and corneal reflection due to infrared illumination (Poole & Ball 2005).
Figure 2.3: Four Purkinje images on the eye (San Agustin 2009).
[image:24.595.199.384.397.549.2]2.2 Eye Tracking 10
2.2.2 Hardware
[image:25.595.198.382.326.499.2]Video-oculography eye tracking systems can usually be classified based on two hard-ware configurations: remote and head-mounted. Remote configurations involve both the camera and infrared light source being placed at a small distance from the user’s eyes, typically near the base of the computer monitor in which the user is observing (San Agustin 2009). Remote configurations have an advantage over head-mounted configurations in that they are much less obtrusive for the user and do not obstruct the user’s field of view, however, they are only able to estimate a user’s gaze within a very limited area, making them less tolerant to head movement (Cooke 2005). Figure 2.4 shows a remote eye tracking system implemented by (San Agustin 2009) using an off-the-shelf video camera and two off-the-shelf infrared lights.
Figure 2.4: Remote eye tracking system implemented by San Agustin (2009).
2.2 Eye Tracking 11 and LEDs are mounted to the frames of some safety glasses.
Figure 2.5: Head-mounted eye tracking system constructed by Mantiuk et al. (2012).
In order to capture the bright pupil and corneal reflection under infrared illumination, the video recording hardware must be sensitive to infrared light (Mantiuk et al. 2012). The sensor must also be able to capture video at an appropriate resolution to produce suitably detailed images of the eye for processing. The required resolution is dependent on whether a remote or head-mounted system is used, as the detail of the image of the eye is dependent on distance between the camera and the eye.
Off-the-shelf webcams without an infrared blocking filter can generally be used in head-mounted configurations. San Agustin et al. (2010) state that “Standard webcams usu-ally have a low resolution and a broad field of view, but by placing the camera close to the user’s eye we can obtain images of sufficient quality”. Most off-the-shelf webcams contain an infrared blocking filter behind the lens, so some modification to remove this filter may be required to enable the webcam to detect infrared light. Furthermore, it may be necessary to insert a visible light blocking filter in its place to remove undesir-able corneal reflections or interference caused by room lighting. Mantiuk et al. (2012) reported that a piece of developed analogue camera film can be used as a visible light filter due to its similar spectral characteristics to a properly designed infrared pass filter. Other sources have claimed that a piece of the magnetic layer of a floppy disc can also be used for this purpose (FreeTrack Forum User Gian92 2012).
2.2 Eye Tracking 12 Generally, most off-the-shelf webcams do not have built-in infrared light sources. Some video cameras may contain small infrared light emitters, but they may not be bright enough to create a corneal reflection on the eye for remote eye tracking applications (San Agustin 2009). Therefore, the use of external infrared LEDs or illuminators is usually required in both remote and head-mounted configurations to sufficiently illuminate the eye and create a corneal reflection.
2.2.3 Software
Image processing software is required to be implemented in conjunction with the hard-ware to extract information about the eye features and calculate the approximate gaze position of the user. Generally utilising pupil detection and the corneal reflection method, the algorithms within the software measure the relative movement of the pupil and corneal reflection. This generally requires a calibration procedure where the user looks at a set of target points on the screen to establish a mapping between the pupil-glint vector and the corresponding screen coordinates (Mantiuk et al. 2012).
Morimoto et al. (1999) established an eye tracking technique using the corneal reflection method. In their technique, the surface of the eye is approximated by a sphere. With the infrared light source fixed, the corneal reflection can be taken as a reference point. After a calibration procedure, the vector from the corneal reflection to the centre of the pupil will describe gaze direction. A block diagram of this procedure is shown in Figure 2.6.
2.2 Eye Tracking 13
Figure 2.6: Block diagram of the corneal reflection eye tracking system as proposed by Morimoto et al. (1999).
ITU Gaze Tracker
In order to provide an accessible, low-cost eye tracking system compatible with off-the-shelf hardware, some researchers and software developers have worked towards developing their own eye tracking software to benefit both end-users and researchers alike. A notable example of this is the ITU Gaze Tracker, developed by researchers in the ITU GazeGroup at the IT University of Copenhagen in Denmark and released as open-source in 2009 (San Agustin et al. 2010).
The ITU Gaze Tracker was developed with the following design considerations (San Agustin et al. 2010):
1. The gaze tracker should be robust and accurate enough to work with at least one gaze-communication system.
2. Use of low-cost off-the-shelf components. The hardware employed should be avail-able in any electronics store or at online shops to allow for easy acquisition and replacement. Furthermore, no hardware moderations should be needed.
2.2 Eye Tracking 14 it accessible in bed should make no difference.
4. Open-source software. Developing an efficient gaze tracker from low-cost com-ponents is a huge endeavour. No single group of developers is likely to come up with the ultimate solution. Open source allows anybody to improve and modify the source code to fit specific needs.
The ITU Gaze Tracker runs on the Microsoft Windows operating system and supports both remote and head-mounted hardware configurations, making it easily accessible and versatile with low-cost off-the-shelf hardware. It is developed in C# and utilises OpenCV, a vision library developed by Intel and free to use under the open source BSD licence, for image processing (San Agustin et al. 2010).
Both remote and head-mounted configurations are supported by the ITU Gaze Tracker. For remote configurations, the software implements both pupil detection and the corneal reflection method for increased robustness and head movement tolerance in the X and Y plane. For head-mounted configurations, only pupil detection is utilised, therefore any head movement will decrease the calibration accuracy.
Detection of the pupil in the ITU Gaze Tracker is performed by the OpenCV package, with the algorithm parameters adjusted within the ITU Gaze Tracker user interface to specify the pupil size and detection sensitivity (Mantiuk et al. 2012). Points in the contour between the pupil and the iris are then extracted and fitted to an ellipse using the RANSAC regression method to eliminate possible outliers (San Agustin et al. 2010). The pupil centre is then identified using these points. Corneal reflections are detected using a different threshold, with the assumption that corneal reflections produced by the infrared light source are the ones closest to the pupil, thus eliminating any potential undesirable corneal reflections caused by room lighting (San Agustin 2009).
Gaze estimation in the ITU Gaze Tracker is implemented using the interpolation tech-nique proposed by Morimoto et al. (1999) as described previously in this section. Users are required to perform the calibration procedure using either 9, 12 or 16 points pre-sented in either a set or random order, with the level of accuracy in the calibration dependent on these settings (San Agustin et al. 2010).
2.3 Data Analysis and Visualisation 15 whether it be a fixation or a saccade, and input that information into a smoothing algorithm to produce a smooth cursor on screen (San Agustin 2009). Alternatively, it can stream gaze coordinates via UDP using the built-in network/client API, which can be received by an external application.
2.3
Data Analysis and Visualisation
Data analysis and visualisation is an important feature of eye tracking systems utilised in usability testing applications. This section discusses methods and algorithms for identifying fixations within raw eye tracking data obtained from an eye tracker. From there, it details techniques of both the analysis and visualisation of fixations identi-fied from eye tracking data, outlining various eye tracking metrics and visualisation techniques.
2.3.1 Fixation Identification
Section 1.1 briefly explained that whilst reading text, eye movements are defined as either fixations and saccades. Kumar (2007) states that, “Data from an eye tracker is noisy and includes jitter due to errors in tracking and because of the physiology of the eye.” Therefore, in order to statistically analyse and visualise eye tracking data, the raw eye tracking data must be filtered to identify fixations and separate them from saccades.
Jacob & Karn (2003) define a fixation as “a relatively stable eye-in-head position within some threshold of dispersion (typically approximately 2 degrees) over some minimum duration (typically 100 to 200 milliseconds), and with a velocity below some threshold (typically 15 to 100 degrees per second).” A saccade is defined as the fast eye movement between two fixation points (Kumar, Klingner, Puranik, Winograd & Paepcke 2008).
2.3 Data Analysis and Visualisation 16 area-based algorithms identify fixation points within specified areas of interest (Salvucci & Goldberg 2000).
Velocity-Based Algorithms
I-VT (Velocity-Threshold Identification) identifies fixation and saccade points based on their point-to-point velocities. Fixation points typically have a velocity of less than 100 degrees per second, while saccade points typically have a velocity of greater than 300 degrees per second. The I-VT algorithm requires one parameter; the velocity threshold which is dependent on the distance from the eye to the visual stimuli. The pseudocode for the I-VT algorithm, as outlined by Salvucci & Goldberg (2000), is shown in Figure 2.7:
Figure 2.7: I-VT Algorithm (Salvucci & Goldberg 2000).
2.3 Data Analysis and Visualisation 17
Figure 2.8: I-HMM Algorithm (Salvucci & Goldberg 2000).
Dispersion-Based Algorithms
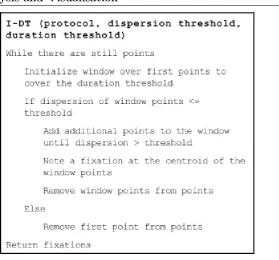
I-DT (Dispersion-Threshold Identification) identifies fixation points based on the as-sumption that, due to their low velocity, fixation points lie in close proximity to one another. Fixations are identified as groups of consecutive points within a particular dispersion threshold or radius. Salvucci & Goldberg (2000) utilised a moving window technique which calculates the dispersion between the minimum and maximum coordinates of the points within the window (Equation 2.1) and expands the window if the dispersion is below the specified threshold. The I-DT algorithm requires two parameters; the dispersion threshold and the duration threshold (typically 100 milliseconds). The pseudocode for the I-DT algorithm, as outlined by Salvucci & Goldberg (2000), is shown in Figure 2.9.
D= (xmax−xmin) + (ymax−ymin) (2.1)
2.3 Data Analysis and Visualisation 18
Figure 2.9: I-DT Algorithm (Salvucci & Goldberg 2000).
Figure 2.10: I-MST Algorithm (Salvucci & Goldberg 2000).
Area-Based Algorithms
2.3 Data Analysis and Visualisation 19
Figure 2.11: I-AOI Algorithm (Salvucci & Goldberg 2000).
2.3.2 Eye Tracking Metrics
Eye tracking metrics are used for the analysis and interpretation of eye tracking data. Jacob & Karn (2003) state that, “The usability researcher must choose eye tracking metrics that are relevant to the tasks and their inherent cognitive activities for each usability study individually”.
After analysing 20 different usability studies that have incorporated eye tracking, Jacob & Karn (2003) determined the six most frequently used metrics are as follows:
Overall number of fixations is an indication of the user’s search efficiency. A larger number of fixations indicates a less efficient search as the user shifts their gaze try-ing to locate areas of interest. This is possibly an indication of poor arrangement of display elements
Percentage of time spent on each area of interest is a reflection of the impor-tance of the respective area of interest. A higher percentage of time indicates that the area of interest is of high importance.
Overall mean fixation duration is an indication of difficulty in the extraction of in-formation from the screen. A longer duration is the result of the user experiencing difficulty extracting information.
impor-2.3 Data Analysis and Visualisation 20 tance of that area of interest.
Mean fixation duration on each area of interest is an indication of difficulty in the extraction of information from the respective area of interest. Much like the overall mean fixation duration metric, a longer duration is the result of the user experiencing difficulty extracting information.
Overall fixation rate is the number of fixations divided by the time spent fixating, which is closely related to the overall mean fixation duration metric, thus it is an indication of difficulty in the extraction of information from the screen.
Poole & Ball (2005) and Ehmke & Wilson (2007) also compiled their own extensive lists of eye movement metrics for use with eye tracking data analysis. Their sources included previous usability studies and supporting literature.
2.3.3 Visualisation
Eye tracking data can be represented using visualisations, which are graphical repre-sentations of the eye tracking metrics. These visualisations are generally superimposed over the original stimulus in order to assist the analyst with interpretation of the visu-alisation and formulate conclusions about the stimulus. (Blignaut 2010). Two common visualisation techniques utilised by commercial eye tracking systems include gaze plots and heat maps (Tobii Technology 2010).
Gaze Plots
A gaze plot, also known as a saccade plot or scan path, is a visualisation of the sequential organisation of the fixations detected by the eye tracking system (Cooke 2005). On a gaze plot, fixations are displayed as ellipses, and are connected by thin lines representing the saccade between them. Ellipses are numbered in sequential order and have a varying radius, the size of which is directly proportional to the duration of the respective fixation.
2.3 Data Analysis and Visualisation 21 of the efficiency of the program’s user interface (Jacob & Karn 2003). An example of a gaze plot superimposed on top of an advertisement is shown in Figure 2.12.
Figure 2.12: A gaze plot produced by an eye tracking system.
Heat Maps
Blignaut (2010) states that, “Heat maps are semi-transparent, multi-coloured layers that cover areas of higher attention with warmer colours and areas of less attention with cooler colours”. Colour transitions are generally smoothed with a gradient for increased readability and visual appeal. Some heat maps may only use a single colour, with the level of attention on the respective area of interest indicated by the intensity or opacity of that colour.
Gradient heat maps are are effectively a graphical representation of the number of fixations on each area of interest metric, indicating the importance of the respective area of interest. An example of an eye tracking heat map superimposed on top of an advertisement is shown in Figure 2.13.
2.4 Summary 22
Figure 2.13: A heat map produced by an eye tracking system.
2.4
Summary
This literature review detailed the various aspects of eye tracking, identifying methods of eye tracking, as well as low-cost hardware configurations and open source software solutions. It outlined algorithms used to identify fixations and saccades within raw eye tracking data, as well as the techniques involved in data analysis and visualisation including eye tracking metrics and graphical representations of eye tracking data.
Chapter 3
Methodology
3.1
Outline
This chapter proposes a methodology for this research project, identifying and analysing both the hardware and software requirements of the low-cost eye tracking system while listing the resources necessary for implementation. With the methodology defined, it was subsequently important to assess the consequential effects associated with this research project and undertake a risk assessment to evaluate and mitigate the risks involved with the project work.
3.2
Requirements Analysis
3.2 Requirements Analysis 24
3.2.1 Hardware Requirements
The first requirement of the low-cost eye tracking hardware is that it must below-cost, as specified by the aim of this research project. Section 2.2.2 explained the implemen-tation of both remote and head-mounted eye tracking hardware configurations with consideration of low-cost off-the-shelf hardware. It outlined that video cameras with optical zoom capabilities were required for remote configurations, whereas webcams were appropriate for use in head-mounted configurations. Generally, webcams are sig-nificantly lower in cost compared to video cameras. With this in mind, it can be decided that a head-mounted hardware configuration is the most appropriate solution for this research project.
In order to minimise intrusiveness and maximise comfort of the head-mounted hardware for the user, the camera module must be as small and lightweight as possible. To achieve this, only the necessary components of the webcam—the webcam’s PCB containing the sensor and the lens, and the USB cable to interface the camera to a computer—should be implemented in the design. Therefore, the webcam must be completely disassembled, allowing these necessary components to be removed from the webcam’s casing and thus enabling them to be mounted to a piece of head-mounted hardware.
Section 2.2.2 described the requirement for infrared illumination in the eye tracking hardware to create the dark pupil effect, increasing pupil definition with respect to the iris. This illumination can be provided by infrared LEDs positioned near the webcam. Subsequently, the webcam must be sensitive to infrared light, and must be modified accordingly with the removal of the infrared blocking filter and, ideally, replacing it with an infrared pass filter/visible light blocking filter to reduce the effects of ambient light on the camera hardware.
3.2 Requirements Analysis 25 layers of overdeveloped photographic film should be used as a low-cost alternative to an infrared pass filter in the webcam for best eye tracking performance.
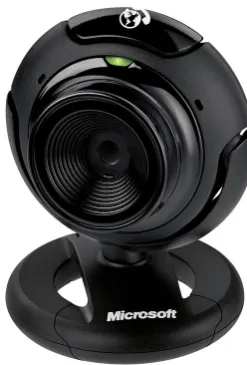
The head-mounted eye tracking hardware was constructed using pre-existing low-cost designs as a basis. Mantiuk et al. (2012) designed and constructed a head-mounted hardware configuration by mounting a modified Microsoft LifeCam VX-1000 webcam and a small illuminator circuit consisting of three infrared LEDs to the frames of a pair of safety glasses, as shown in Figure 2.5 in Section 2.2.2. This procedure is detailed by Kowalik (2010).
Resource Analysis
Using the low-cost head-mounted design by Mantiuk et al. (2012) as detailed by Kowalik (2010) as a basis, the required hardware resources and their respective costs and sources were identified as listed in Table 3.1. Note that all prices are expressed in Australian dollars.
Item Qty. $/Unit Total $ Source
Electronic Components:
Microsoft LifeCam VX-1000 webcam 1 20.00 20.00 Online auction
ZD1946 3mm IR LED 3 1.25 3.75 Jaycar
220Ω 1W carbon film resistor (2 pack) 1 0.44 0.44 Jaycar
Photographic film 1 N/A N/A On-hand item
Mounting Hardware:
Protector safety glasses 1 13.70 13.70 Bunnings 10 gauge alumnium wire (1.0m) 1 1.83 1.83 Bunnings Consumables:
10mm heat-shrink tubing (1.2m) 1 2.95 2.95 Jaycar 100x25mm cable ties (25 pack) 1 0.99 0.99 Bunnings Insulation tape (1 roll) 1 2.20 2.20 Bunnings General purpose adhesive 1 3.50 3.50 Bunnings
Table 3.1: Hardware resource requirements for the head-mounted system design based on Mantiuk et al. (2012).
3.2 Requirements Analysis 26 LED are outlined on their respective datasheets in Appendix C.
The price of the hardware listed in Table 3.1 totalled just 49.36 Australian dollars, which includes the price of consumables—undisputedly placing it in the ‘low-cost’ price bracket as specified by the aim of this research project.
In addition to the hardware requirements of the low-cost eye tracker, construction of the head-mounted eye tracking hardware required the use of a large variety of tools:
Philips head screwdrivers (multiple sizes) — required for the disassembly of the Microsoft LifeCam VX-1000 webcam to remove the PCB containing the webcam’s sensor and lens from its casing, as well as the securing of the modified webcam to the aluminium wire.
Plastic separation tool — facilitated the separation of the front face of the webcam from the rear casing.
Utility knife — required to remove the plastic collar securing the USB cable to the rear casing of the webcam. It was then utilised to dislodge the webcam’s infrared sensor from its position behind the lens and subsequently cut the photographic film to its required size in order to secure it behind the lens to act as an infrared pass filter. It was also used for general purposes during the assembly procedure, such as the cutting of heat-shrink tubing and insulation tape.
Wire cutters — utilised to trim terminals on the electronic components and trim excess aluminium after assembly
Soldering iron, solder and solder fluid — enabled the soldering of the infrared illumination circuit to the webcam’s 5 volt USB power supply.
Digital multimeter — utilised to test the voltage and current at various points throughout the infrared illumination circuit, ensuring correct operation.
Ruler with 1 millimetre precision — ensured correct and precise measurements were taken during construction and assembly.
3.2 Requirements Analysis 27 Drill fitted with a 1 millimetre drill piece — required to produce 1 millimetre diameter drill holes on the flattened surface of aluminium wire to mount the webcam.
Centre punch and hammer — used to ensure the drill holes correctly aligned with the screw holes on the webcam (approximately 26 millimetres between hole cen-tres).
Heat gun — utilised to apply sufficient heat to shrink the heat-shrink tubing.
3.2.2 Software Requirements
The ITU Gaze Tracker, presented in Section 2.2.3, provided an ideal open-source soft-ware solution for implementation with the low-cost eye tracking system due to its compatibility with low-cost off-the-shelf hardware. The software’s features outlined in Section 2.2.3 make it an integral component of the eye tracking system.
In addition to Gaze Tracker, analysis software was designed and developed for im-plementation in the eye tracking system. The software was required to perform the following tasks:
• Define specific session details such as trial name and test subject name
• Initiate a calibration procedure in Gaze Tracker
• Once calibrated, launch an eye tracking session via a key combination press
• Receive gaze coordinates streamed by Gaze Tracker
• Cease an eye tracking session via a key combination press
• Store gaze coordinates for the respective session to a file
• Implement a fixation identification algorithm to identify fixations within the gaze coordinates
• Calculate relevant eye tracking metrics for the identified fixations and display a statistical report of the analysis
3.2 Requirements Analysis 28 It was decided that I-DT fixation identification described in Section 2.3.1 would be implemented in the software, as its implementation is relatively simple in comparison to other fixation identification algorithms, and it only requires one user-defined parameter; the dispersion threshold, or radius, in pixels. This parameter should be estimated based on the size and resolution of the screen in which the eye tracking session is being performed on, as well as the test subject’s view distance to the screen. For example, if the test subject is gazing at a large screen from a small distance, the screen will occupy a greater percentage of their field of view, thus a smaller dispersion threshold should be selected. Conversely, if the test subject is gazing at a small screen from a large distance, the screen will occupy a smaller percentage of their field of view, thus a larger dispersion threshold should be selected (Blignaut 2009).
The eye tracking metrics to be calculated by the software were chosen from the com-prehensive list collaborated by Jacob & Karn (2003). These metrics include:
• Overall number of fixations (defined as either on-screen or off-screen fixations)
• Overall mean fixation duration
• Overall fixation rate
• Mean saccade length
• Number of fixations on each area of interest
• Total fixation duration on each area of interest
• Mean fixation duration on each area of interest
Finally, with these metrics in mind, it was decided that the software should generate heat maps utilising the grid technique outlined in Section 2.3.3, where each cell in the grid arbitrarily defines areas of interest on the screen. This allows the three area of interest-dependent metrics chosen to be easily visualised within the grid.
Resource Analysis
3.3 Assessment of Consequential Effects 29 MinGW GCC/C++ compiler — required for compilation of source code files
Code::Blocks IDE — provides an environment to facilitate the development of the software, with features such as syntax highlighting, debugging and tools for de-veloping and building entire projects.
Windows API — defined in windows.h, it enables the utilisation of Windows API functions. In addition to this, it provides GDI graphics functions with the use of thegdi32library, required by the software for drawing gaze plots and heat maps.
Windows Sockets 2 API — defined winsock2.h, it provides the API functions re-quired to implement networking functions in the software, particularly the TCP/IP and UDP protocols required by the software to send a calibration command and receive gaze coordinates streamed by Gaze Tracker, respectively. The wsock32
library is also required.
3.3
Assessment of Consequential Effects
The potential consequential effects that result from this research project involve both safety issues and ethical considerations. These effects are can have negative impacts for the user, thus the research project was undertaken with the user’s best interests in mind. This section identifies and describes those safety issues, evaluating their severity with respect to the user. Furthermore, the ethical aspects of the research project are outlined and considered.
3.3.1 Safety Issues
3.4 Risk Assessment 30 Mulvey et al. (2008) state that “The ACGIH and ICNIRP recommend a maximal daily corneal exposure of 10 milliwatts per square centimetre total irradiance for wavelengths 770 to 3,000 nanometres for day-long, continuous exposures”. Other low-cost eye track-ers using infrared illumination have reported irradiance levels well below 10 milliwatts per square centimetre (Babcock & Pelz 2004), however, this recommendation was still considered when implementing infrared illumination circuit on the head-mounted eye tracking hardware.
3.3.2 Ethical Considerations
Engineers Australia (2010) specify their ethical standards and requirements in the Code of Ethics. It was of utmost importance that the Code of Ethics be strictly upheld at all times throughout the duration of this research project.
Secondly, in order to track the user’s gaze, a portion their face, and more importantly; the direction of their gaze, must be recorded by the camera for the duration of the eye tracking session. This could be considered as a violation of the user’s privacy. Furthermore, the eye tracking data and output generated from the session will likely be stored for further analysis or comparison with other users. Therefore, it is important that the user fully understands and acknowledges these requirements of the eye tracking system and thus agrees to partake in the session.
3.4
Risk Assessment
3.5 Project Timeline 31
3.5
Project Timeline
Figure B.1 in Appendix B.2 presents a graphical timeline of the tasks undertaken throughout the course of this research project and their approximate commencement and completion dates. Key dates are displayed as thick vertical lines. Table B.2 lists these key dates with their corresponding number from the timeline.
3.6
Summary
Chapter 4
Design and Implementation
4.1
Outline
The design elements of this research project involve both hardware design and software design. The implementation of these elements form the low-cost eye tracking system. As stated in Section 3.2.2, the ITU Gaze Tracker software is an integral component of the eye tracking system, thus both the hardware and software must be designed to operate in conjunction with Gaze Tracker. This chapter details both the hardware and software designs and their implementation with Gaze Tracker to form the eye tracking system.
4.2
Hardware Design
4.2 Hardware Design 33
Figure 4.1: Microsoft LifeCam VX-1000 webcam (Microsoft Corporation 2011).
4.2.1 Webcam Modification
The following procedure outlines the steps that were performed to modify the webcam for use in a head-mounted configuration.
In order for the camera to be as small and lightweight as possible for use in a head-mounted configuration, the PCB containing the webcam’s sensor and lens was required to be removed from the its casing:
1. The screws identified at A and B in Figure 4.2 were unscrewed and the base of
[image:48.595.226.350.75.258.2]the webcam was removed.
Figure 4.2: Webcam screw locations.
4.2 Hardware Design 34 Figure 4.3.
Figure 4.3: Removing the front face.
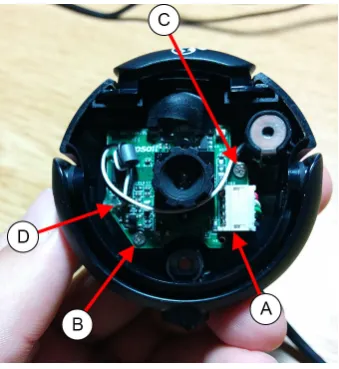
3. After unplugging the USB cable at A in Figure 4.4, the screws identified at B
and C were unscrewed to remove the PCB containing the camera from the rear
[image:49.595.207.377.394.579.2]casing of the webcam. The microphone cable at D was also removed.
Figure 4.4: Removing the PCB.
4. The USB cable was removed from the rear casing of the webcam by removing the plastic collar securing it to the case.
In order for the camera to be sensitive to the infrared light spectrum, the infrared blocking filter required removal from the camera’s lens and replaced with two layers of overdeveloped photographic film as explained in Section 3.2.1:
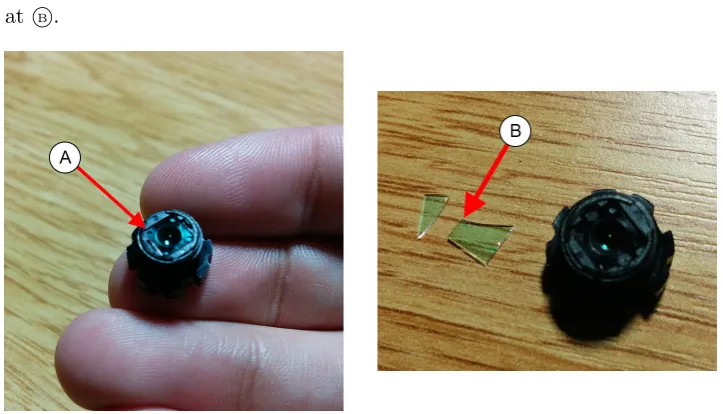
4.2 Hardware Design 35 blocking filter was located behind the lens as shown at A in Figure 4.5 and
[image:50.595.111.473.118.325.2]removed using a thin, sharp blade. The broken infrared blocking filter is shown atB.
Figure 4.5: Removing the infrared blocking filter from the lens.
[image:50.595.206.376.461.644.2]6. Two small squares of the same size as the infrared blocking filter (approximately 5 square millimetres) were cut from a piece of overdeveloped photographic film and secured in place behind the lens with a small amount of glue as shown in Figure 4.6.
Figure 4.6: Photographic film behind the lens.
7. The lens was reinserted into the lens holder on the webcam.
4.2 Hardware Design 36 8. Three 3 millimetre ZD1946 infrared LEDs (Appendix C) surrounding the web-cam’s lens were soldered in series with a 22 ohm resistor and the 5 volt USB power supply on the webcam’s USB connector, as shown by the schematic in Figure 4.7. Assuming typical conditions, the ZD1946 infared LED has a for-ward voltage range of 1.2 to 1.4 volts, allowing three in series to be powered by the 5 volt USB power supply, providing sufficient illumination with a minimal-istic implementation. A 22 ohm resistor was chosen to provide a supply current within the ZD1946 infrared LED’s forward current range of 20 to 100 milliamps (Equations 4.1 and 4.2) for typical conditions.
Figure 4.7: Schametic of the infrared illumination circuit.
R1min≈
VU SB−3VF min
IF max
≈ 5−3×1.2
0.10
≈14Ω (4.1)
R1max≈
VU SB−3VF max
IF min
≈ 5−3×1.4
0.02
4.2 Hardware Design 37 The final capture module which can be seen in Figure 4.10 is a lightweight, infrared sen-sitive version of the Microsoft LifeCam VX-1000 webcam with an infrared illumination circuit.
4.2.2 Mounting and Assembly
The following procedure outlines the steps that were performed to assemble the head-mounted hardware, including mounting the modified webcam.
Firstly, the modified webcam was mounted to a 300 millimetre length of 10 gauge aluminium wire:
1. A section of approximately 40 millimetres at one end of the aluminium wire was flattened by striking it with a mallet on a hard surface (Figure 4.8).
[image:52.595.207.377.438.577.2]2. To align with the mounting screw holes on the webcam, two holes of 1 millimetre diameter were drilled at a distance of 26 millimetres between hole centres on the flattened section of aluminium wire (Figure 4.8).
Figure 4.8: Flattened section of aluminium wire with screw holes.
3. The flattened section of the aluminium wire was wrapped in insulation tape and a thin slice of soft foam was adhered to one side. The two holes were re-drilled to create holes in both the tape and foam (Figure 4.9).
4. The remaining length of aluminium wire was covered in heat-shrink tubing of 10 millimetre diameter.
4.2 Hardware Design 38
Figure 4.9: Front (left) and back (right) of the flattened section of aluminium wire wrapped in insulation tape with foam attached.
the non-flattened end of the aluminium wire and working it towards the flattened end.
6. The webcam was placed on top of the foam on the flattened end of the aluminium wire with the mounting screw holes aligned with the drilled holes. It was then screwed into place using the original mounting screws (Figure 4.10).
[image:53.595.206.377.469.611.2]7. The webcam’s USB cable was inserted into its connector on the webcam and secured to the aluminium wire at the end of the heat-shrink tubing with a cable tie (Figure 4.10).
Figure 4.10: The webcam mounted to the alumnium wire.
8. The heat-shrink tubing was then shrunk with a heat gun to tightly wrap the USB cable and aluminium wire.
4.2 Hardware Design 39 9. The protective shield of the safety glasses was removed by releasing the clip above
the nose pad.
10. The aluminium wire was secured to the left arm of the frames using multiple cable ties with the webcam extending forwards and facing inwards, allowing ap-proximately 200 millimetres distance from the hinge to the tip of the flattened end of the aluminium wire.
[image:54.595.206.377.302.441.2]11. With the point of inflection near the hinge of the left arm, the aluminium wire was bent downward at an angle of approximately 55 degrees as shown in Figure 4.11. It was also bent slightly outward at an angle of approximately 15 degrees to reduce obstruction to the user’s field of view.
Figure 4.11: Downward bending angle of the aluminium wire at the hinge.
12. With the point of inflection approximately 30 millimetres from the edge of the webcam, the aluminium wire was bent upward and inward at an angle of approxi-mately 105 degrees, creating an inside angle of approxiapproxi-mately 75 degrees as shown in Figure 4.12. This caused the webcam to point towards the left eye region of the frames at a distance of approximately 80 millimetres.
13. Finally, the excess aluminium wire was removed from behind the left arm of the frames and any exposed aluminium wire was covered with heat-shrink tubing.
The final head-mounted hardware design is shown from multiple angles in Figure 4.13, while Figure 4.14 displays the head-mounted hardware being worn.
4.2 Hardware Design 40
[image:55.595.186.378.72.258.2]Figure 4.12: Inward bending angle of the aluminium wire at the webcam.
Figure 4.13: Final head-mounted hardware design.
[image:55.595.207.376.520.700.2]4.3 Software Design 41
Figure 4.15: Image captured by the head-mounted hardware.
4.3
Software Design
Eye tracking analysis software informally named Gaze Analyser was designed and de-veloped for use in the eye tracking system. As specified in Section 3.2.2, the software was developed using the C++ programming language and was designed to facilitate an eye tracking session for the user; setting session details, receiving and storing gaze co-ordinate data, identifying fixations within that data and analysing and creating visual-isations of those fixations. This section describes the software design and development, detailing class functions and their implementation.
4.3.1 Gaze Analyser Overview
Users interact with Gaze Analyser via a text-based user interface. Upon launching the program, the user is presented with a text-driven menu, prompting them to either start a new eye tracking session or exit the program. This menu is implemented in the main() function (Appendix D.1) utilising switch-case statements to handle and validate user input. Figure 4.16 displays Gaze Analyser’s main window presenting the text-driven menu.
By considering the software requirements specified in Section 3.2.2, four unique classes were identified for Gaze Analyser:
4.3 Software Design 42
Figure 4.16: Gaze Analyser’s main window.
• Metrics class (Section 4.3.3)
• GazePlot class (Section 4.3.4)
• HeatMap class (Section 4.3.5)
Four global variables were also required by the program (Section D.3):
• res widthandres height: the screen’s horizontal and vertical resolution values in pixels respectively, initialised when the program is launched
• t fix min: the constant specifying the minimum fixation duration threshold in milliseconds for the I-DT fixation identification algorithm implementation, set to 100 milliseconds; and
• track: the Boolean to control gaze coordinate data retrieval from Gaze Tracker in theudp receive() function (Section D.5)
4.3.2 Session Class
Listing 4.1: Session Class Definition
/∗ ∗
∗ @ f i l e S e s s i o n . hpp
∗ @author Thomas B r a d f o r d ( thomas . b r a d f o r d 9 1 @ g m a i l . com )
∗
∗ S e s s i o n c l a s s d e f i n i t i o n
4.3 Software Design 43
#i f n d e f SESSION HPP #define SESSION HPP #include <s t r i n g> #include <v e c t o r> #include <windows . h> #include ” P o i n t . hpp”
c l a s s S e s s i o n
{
void g e t d e t a i l s ( ) ; void c a l i b r a t e ( ) ; void t r a c k i n g ( ) ;
unsigned i n t p r o c e s s ( ) ;
void g e t l i m i t s ( s t d : : v e c t o r<Point>) ; void a d d f i x a t i o n ( s t d : : v e c t o r<Point>) ; P o i n t min ;
P o i n t max ; public:
S e s s i o n ( ) ; ˜ S e s s i o n ( ) ;
s t d : : s t r i n g t r i a l ; s t d : : s t r i n g s u b j e c t ; i n t f i x r a d i u s ; HDC hCaptureDC ;
s t d : : v e c t o r<Point> f i x p a t h ; i n t t s e s s i o n ;
};
#endif // SESSION HPP
Refer to Appendix D.8 for the Session class implementation.
The Session class performs three main operations: initialisation of a new eye tracking session, calibration, initiation and cessation of that eye tracking session; and the pro-cessing of the gaze coordinate data obtained in that session to identify fixations. All operations are handled by the default constructor for the class.
4.3 Software Design 44 class variablestrial,subjectandfix radiusrespectively. The function ensures valid input for all three variables: checking if the trial name is not blank, the subject name is not blank and does not already have a results file for that trial, and if the fixation radius is greater than 0 pixels.
After obtaining the user-specific details for the Session, the default constructor calls the calibrate()function to calibrate the eye tracker. The function calls an external function, tcp send()(Appendix D.4), to send the ‘CAL START’ command via TCP port 5555 on localhost; the command server for Gaze Tracker running concurrently on the machine. It ensures the command is sent successfully, creating a calibration window in Gaze Tracker and setting it as the foreground window. After calibration in Gaze Tracker is complete, the function prompts the user to either accept the calibra-tion or perform another calibracalibra-tion procedure to potentially achieve a more accurate calibration.
Once the calibration is accepted by the user, the default constructor calls thetracking()
function which handles the eye tracking procedure itself. The function informs the user that the eye tracker is ready and instructs them to press the ‘Ctrl+Alt+E’ key combi-nation to begin an eye tracking session. When the key combicombi-nation press is detected, the eye tracking data file ‘subject data.txt’ is created in the trial directory and the header containing the trial,subject and the time of commencement of the eye tracking session is written to the file. The function then sets the track Boolean to true and creates a new thread, calling an external function, udp receive()(Appendix D.5), which ensures a connection to UDP port 6666; the data server for Gaze Tracker, receives gaze coordinate data from the data server, writes it to a buffer and sends the buffer to the file stream for the data file. The udp receive() function receives gaze coordinate data until the trackBoolean is set to false in its calling thread.
4.3 Software Design 45 The default constructor then calls the process() function to process the gaze coordi-nate data stored to the data file and identify fixations within that data, storing them to the public class vector fix path. After opening the file, the function loops through the file line by line until the end-of-file is reached. Lines containing gaze coordinate data contain the string ‘STREAM DATA’ and are formatted as follows:
STREAM_DATA <timestamp> <x-coordinate> <y-coordinate>
Where the timestamp is expressed in milliseconds. If the ‘STREAM DATA’ string is found in the current line, the timestamp, x-coordinate and y-coordinate of the respec-tive point are stored in a Point struct (Listing 4.2).
Listing 4.2: Point Struct Definition
/∗ ∗
∗ @ f i l e P o i n t . hpp
∗ @author Thomas B r a d f o r d ( thomas . b r a d f o r d 9 1 @ g m a i l . com )
∗
∗ P o i n t s t r u c t d e f i n i t i o n
∗/
#i f n d e f POINT HPP #define POINT HPP
s t r u c t P o i n t
{
P o i n t (double = 0 , double = 0 , long long = 0 ) ; double x ;
double y ; long long t ; bool o n s c r e e n ;
};
#endif // POINT HPP
4.3 Software Design 46 the set and the current point is added to the set, thus shifting the current potential fixation.
The algorithm was adapted from that proposed by Salvucci & Goldberg (2000) to support the line-by-line processing of gaze coordinate data. The pseudocode for the I-DT algorithm implemented in this function is displayed in Algorithm 4.1.
Algorithm 4.1 I-DT algorithm implementation if tlast−tf irst<t fix minthen
Add current point to fixation points vector
else if ((xmax−xmin) + (ymax−ymin)≤2∗fix radiusthen
Add current point to fixation points vector Get new min and max coordinates
if (xmax−xmin) + (ymax−ymin)>2∗fix radiusthen
Remove current point from fixation points vector
Calculate fixation coordinates using fixation points vector Add fixation to fix path vector
Clear fixation points vector
Add current point back to fixation points vector end if
else
Erase first point from fixation points vector Add current point to fixation points vector end if
Get new min and max coordinates
After a fixation is identified, the coordinates at its centroid are calculated by averaging the coordinates of all points in the fixation points vector (Equation 4.3). The duration of the fixation is also calculated by subtracting the time of the first point in the fixation from the time of the last point in the fixation (Equation 4.4).
(x, y)f ixation =
Pn
i=1(x, y)i
n (4.3)
Tf ixation =tn−t1 (4.4)
Where n is the number of points in the fixation points vector.
4.3 Software Design 47 variables—and is set accordingly. The Point data is then pushed back to thefix path
vector. This is implemented in the add fixationclass function.
Finally, after all gaze coordinate data has been processed, the function calculates the duration of the eye tracking session (t session) by subtracting the time of the first point in the session from the time of the last point in the session and returns the number of fixations identified in the gaze coordinate data.
If fixations were identified in the gaze coordinate data (that is, if the return value of the process() function is greater than 0), the default constructor creates new Met-rics (Section 4.3.3), GazePlot (Section 4.3.4) and HeatMap (Section 4.3.5) objects to generate results and visualisations for that Session.
4.3.3 Metrics Class
Listing 4.3: Metrics Class Definition
/∗ ∗
∗ @ f i l e M e t r i c s . hpp
∗ @author Thomas B r a d f o r d ( thomas . b r a d f o r d 9 1 @ g m a i l . com )
∗
∗ M e t r i c s c l a s s d e f i n i t i o n
∗/
#i f n d e f METRICS HPP #define METRICS HPP #include ” S e s s i o n . hpp”
c l a s s M e t r i c s
{
void w r i t e r e s u l t s ( s t d : : s t r i n g , s t d : : s t r i n g , i n t) ; unsigned i n t t s e s s i o n m i n s ;
unsigned i n t t s e s s i o n s e c s ; unsigned i n t on ;
unsigned i n t o f f ; double f i x r a t e ; double t f i x m e a n ;
double s a c c a d e l e n g t h m e a n ; public:
M e t r i c s ( S e s s i o n∗) ;
};
#endif // METRICS HPP
4.3 Software Design 48 The Metrics class is responsible for the calculation of the chosen eye tracking metrics identified in Section 3.2.2, as well as the generation of the results file for the session. The constructor accepts a pointer to a Session class object as an argument. Using the Session object’s public class variables, it calculates the number of on-screen and off-screen fixations within thefix pathvector. The overall fixation rate for the session in fixations per second is calculated by dividing the number of fixations identified (equivalent to the size of the fix path vector) by the session duration in seconds. The mean on-screen fixation duration in milliseconds is calculated by averaging the duration of each on-screen fixation identified. Finally, the length of each saccade in pixels between two on-screen fixation points is calculated using Pythagoras’ theorem and the mean on-screen saccade length is calculated (Equation 4.5).
Lsaccade=
Pn−1
i=1
p
|xi−xi+1|2+|yi−yi+1|2
n (4.5)
Where n is the number of on-screen fixations identified.
After calculating the eye tracking metrics, the constructor calls the write results()
function which creates the ‘subject results.txt’ file and writes the session details in-cluding the trial name, subject name, date, screen resolution, fixation radius and session duration. It then writes all eye tracking metrics calculated in the constructor. A sample of the results file is displayed in Figure E.1 in Appendix E.
4.3.4 GazePlot Class
Listing 4.4: GazePlot Class Definition
/∗ ∗
∗ @ f i l e G a z e P l o t . hpp
∗ @author Thomas B r a d f o r d ( thomas . b r a d f o r d 9 1 @ g m a i l . com )
∗
∗ G a z e P l o t c l a s s d e f i n i t i o n
∗/
4.3 Software Design 49
c l a s s GazePlot {
void g e t u p p e r ( s t d : : v e c t o r<Point>) ; void draw ( s t d : : v e c t o r<Point>, i n t) ; i n t g e t r a d i u s (int, i n t) ;
void d r a w f o o t e r ( s t d : : s t r i n g , s t d : : s t r i n g , i n t) ; unsigned i n t l o w e r ;
unsigned i n t upper ; HDC hGazePlotDC ; HBITMAP hGazePlotBmp ; HFONT hFont ;
HPEN hPurplePen ; HPEN hGreenPen ; HPEN hBluePen ; HPEN hRedPen ; HPEN hOrangePen ; HPEN hBlackPen ;
HBRUSH h L i g h t P u r p l e B r u s h ; HBRUSH hLightGreenBrush ; HBRUSH h L i g h t B l u e B r u s h ; HBRUSH hLigh