International Journal of Innovative Technology and Exploring Engineering (IJITEE) ISSN: 2278-3075, Volume-8 Issue-9, July 2019
Abstract: The existing paper is concerned with the improvement of the traditional cotton yarn appearance grading system with the help of computerized MATLAB image processing and fuzzy logic system. The complete system of this research comprises of yarn winder blackboard, digital camera for taking sample image, computer for processing and analyzing the sample quality by using MATLAB graphical user toolbox to facilitate the investment of algorithm during image processing and analyzing of yarn quality. Since in textile industry, mostly the cotton yarn appearance grading evaluation is principally based on labor-intensive assessment. This research used to solve the inherent limitations of the human visual inspection. The MATLAB image processing in graphical user toolbox integrates the image acquisition, digital image extraction, and yarn quality classification based on the sample yarn count and the ASTM (D2255) standard of yarn image of number of pixels. Totally this paper proposes the new method for cotton yarn appearance grading system by using matlab image processing methods and fuzzy logic systems to modify and improve the existing manual appearance grading system.
Keywords: Cotton Yarn Appearance Grading, Blackboard Winder, Yarn image Processing, Graphical User Interface, Fuzzy logic system.
I. INTRODUCTION
A. Cotton yarn quality and its impact in textile processing
In the world textile product manufacturing industry, yarns are used as a primary raw materials to manufacture woven, knitted fabrics. Yarn occurs in the following forms: a number of fiber twist together, a number of filament laid together without twist, a number of filament laid together with a degree of twist, and a single filament with or without twist (a mono-filament) proposed for use in a textile construction [1]. In textile yarn manufacturing since quality is the main issue, all manufacturers encourage qualities as a primary customer value and consider its critical achievement factor for accomplishing effectiveness and customer satisfaction. Cotton yarns are widely serviceable in the form of raw material for the manufacturing of woven and knitted fabrics, sewing threads and different ropes.
Revised Manuscript Received on July 06, 2019.
Abriham Atinafu, Mechanical Engineering, Sharda University, Greater Noida, Indida.
Anuj Kumar Sehgal, Mechanical and Automobile Engineering, Sharda University, Greater Noida, India.
Vineet Kumar, Mechanical and Automobile Engineering, Sharda University, Greater Noida, India
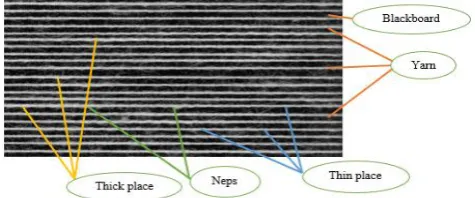
[image:1.595.308.546.618.717.2]The yarn appearance is not merely affect the commercial value but also directly deteriorates the durability and performance of end products. Since cotton yarns are building blocks of fabrics, their nature and quality has a direct effect on the product quality and efficiency of the manufacturing process. Technical textiles which used for manufacturing of the automobile of different interior components are made from yarns. So to assure the serviceability, smoothness, feeling of comfort and other properties, inspection and evaluating of yarn quality is the main factor for good quality end product. The cotton yarn surface appearance is one of the most important quality parameter which is known as yarn unevenness or irregularity (mass variation with in a given length of yarn). During the manufacturing of woven and knitted fabrics, yarns are subjected to the machine parts mainly to healed wire, reeds and needle parts. Those machine parts are very sensitive to the variation in the yarn surface evenness which is widely facing to affect in textile fabric manufacturing process. It also can badly deteriorate various textile fabric properties such as threads shrinkage variation, improper yarn twist, surface abrasion, pilling, soil holding, and drape porosity. Therefore, understanding of yarn surface appearance is the main significant factor in determining the quality and the resultant suitability for its end product and customer satisfaction. The blackboard yarn surface grading is commonly applicable in textile yarn manufacturing industry, but the visual observing evaluation is not very accurate because of human perception errors. The most relevant quality parameters for assessing yarn and classifying in terms of quality, includes some defects (imperfections) such as thick place, thin place and neps as shown in the figure1. These defects have a significant factor for the production cost (down time), due to the breakage in the yarn during fabric manufacturing.
Figure 1. Yarn wound on blackboard yarn winder and its surface defects
Improving Cotton Yarn Appearance Grading
System Using Image Processing of Blackboard
Yarn Winder In MATLAB
In MATLAB
Traditionally the inspection is carried out directly by visual comparison of the wound yarn sample (blackboard wrappings of yarns) with the grade labelled photographic standards (grade A or best, B, C and D or worst) and based on the assessment of regularity, freedom from imperfections, foreign matter, neppiness and lack of hairiness. As shown in the figure2, the yarn to be examined is wrapped on the blackboard surface in equally spaced turns. Then they judges the appearance of the wound yarn sample and give a grade according to a given series of ASTM cotton yarn appearance standards which are photographs of different counts with the appearance classified in to four grades.
(a) (b)
Figure2. (a) Yarn carrying blackboard; (b) Visual observation and grading.
ASTM 2255 standards, the general descriptions that used for manual evaluation for each yarn quality grade can be described in the table below.
Table1─yarn grading and quality description according to ASTM standards [1]
Grade Description
A Good uniformity and surface cover, no large neps, no excessive fuzziness
B A few small neps, small piece of foreign matter, a bit fuzziness and irregularities
C More neps and fuzziness, greater contrast between thick and thin places
D Large neps, more fuzziness, over all rough surface appearances
In textile manufacturing industry, because of technical limitation, the manual testing system has been used to test the appearance of cotton yarn surface, such as yarn evenness, neps, and other impurities for long time. Many industries use the traditional one of blackboard yarn grading system, even if it needs two or more persons to observe and decide the yarn grade visually by compare and contrast with the standard ASTM (2255)photograph image, and it is tedious for visual observing the yarn surface defects [1,11]. Although, human evaluation of yarn quality appearance seen less costly, it is limited to observe and find out small defects from the yarn surface. Because of these vast drawbacks and in order to improve the process of blackboard yarn appearance grading system, tries are being made by adding a computerized MATLAB image processing on blackboard yarn surface grading system.
ІІ. LITRATURE REVIEW
A. Earlest quality inspection methods
Historically one of the earliest journals on the estimation of yarn evenness was prepared by Martindale since 1945, which is accomplished by cutting the yarn into equal set of lengths and take each yarn weight measured value and by calculating the mean, and variation of the weights of each yarn length [2]. Researchers, have also reported two old-style methods for yarn diameter measurement such that; rod method (yarn diameter is calculated by dividing the length of yarn wound on rod by the total number of turns) and traveling microscope method (which has microscopic pointer and venire calliper scale for reading), that have been investigated in the first time [3]. According to the standard method of ASTM (D-2255-02), cotton yarn appearance standard were first adopted in 1938 and revised in1964, with series ІІІ being revised again in 1975. Traditionally the inspection is carried out directly by visual comparison of the wound yarn sample (blackboard wrappings of yarns) with the grade labelled photographic standards (grade A or best, B, C and D or worst) and based on the assessment of regularity, freedom from imperfections, foreign matter, neppiness and lack of hairiness [4].
B. Recent studying
Researchers have been developed a machine vision based method, for analysing and evaluation of yarn evenness. Their work were depend on using of image capturing device, and image processing algorithms in MATLAB. They have been used histogram equalization to correct the image, image filtration to remove the excess hairiness of the yarn, and morphological operation to remove undefined amount of pixels or noise parts during image processing [2]. Researchers also have developed and constructed a neural network model, to predict ring spun yarn quality from fiber properties, yarn count and twist. They made a database based on the fiber characteristics by using NemrodW software. Then by using neural network tools, they modelled yarn quality index from fiber properties of statistical result. Accordingly by using desirability approach with combination of neural network, they proposed a good application for yarn quality assessment [5]. Authors have been introduced a direct technique of yarn evenness measurement process based on machine visualization way. During their experiment, they used and processed sequentially image processing algorithm to determine the yarn core mainly and precisely, such as image acquisition system, and computer image processing (threshold segmentation and morphological opening operation) to decrease the hairiness part. After that they measured the yarn diameter and its coefficient of variation (CV) which is primary parameter to reflect its evenness [6]. Authors, also have studied about the yarn evenness test result by comparing the uster yarn evenness tester and Constant Tension Transport (CTT) methods. They used linear digital camera and database software system for constant tension transport yarn evenness methods. In their investigation, the concluded by comparing the Uster with CTT tester, the CTT tester can more scientifically
and exactly describes the basic properties of yarns [7].
International Journal of Innovative Technology and Exploring Engineering (IJITEE) ISSN: 2278-3075, Volume-8 Issue-9, July 2019
computer-based method for testing and evaluating the results based on numerical methods. They used ‘Uster’ yarn evenness tester as a sensor for measuring the variation of the yarn surface and display the recorded output in the computer by converting the signal into digital data [8]. Authors have been used a statistical function of semivariogram method for evaluation of yarn surface unevenness. To accomplish their investigation, they used image processing algorithms in matlab software such as image acquiring, and grey scale image conversion. Then based on the standard yarn board (CSN8 0704), the fluctuation in the degree of greyness between the square field image has evaluated by semivariogram. The greyness degree were constructed from the standard yarn board by dividing the grey image into
[image:3.595.52.548.239.608.2]square field of selected size [9]. Recently researchers developed an artificial intelligence and computer vision evaluation method. To evaluate and to classify the yarn quality and grade in artificial neural network, authors have been used eighteen yarn features and statistical results of USTER yarn evenness tester such as yarn diameter and hairiness characteristics as input parameters for artificial neural network of yarn grade classification [10]. Researchers also, have proposed an artificial intelligence techniques based on image of ASTM standards (D2255) to evaluate the yarn evenness. They proposed a similar method with human vision evaluation even if they used a computer vision, and image processing algorithm in matlab. Their objective were to cover the limitation of the human inspection methods [11].
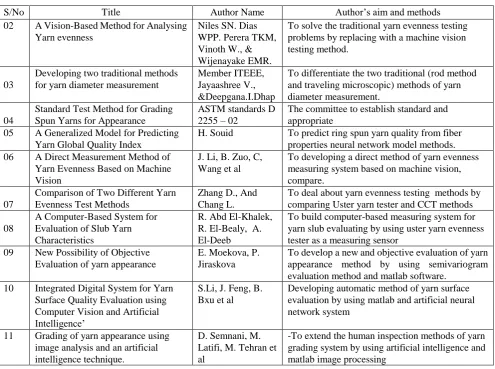
Table 2─summary of review papers for cotton yarn appearance grading methods
S/No Title Author Name Author’s aim and methods
02 A Vision-Based Method for Analysing Yarn evenness
Niles SN. Dias WPP. Perera TKM, Vinoth W., & Wijenayake EMR.
To solve the traditional yarn evenness testing problems by replacing with a machine vision testing method.
03
Developing two traditional methods for yarn diameter measurement
Member ITEEE, Jayaashree V., &Deepgana.I.Dhap
To differentiate the two traditional (rod method and traveling microscopic) methods of yarn diameter measurement.
04
Standard Test Method for Grading Spun Yarns for Appearance
ASTM standards D 2255 – 02
The committee to establish standard and appropriate
05 A Generalized Model for Predicting Yarn Global Quality Index
H. Souid To predict ring spun yarn quality from fiber properties neural network model methods. 06 A Direct Measurement Method of
Yarn Evenness Based on Machine Vision
J. Li, B. Zuo, C, Wang et al
To developing a direct method of yarn evenness measuring system based on machine vision, compare.
07
Comparison of Two Different Yarn Evenness Test Methods
Zhang D., And Chang L.
To deal about yarn evenness testing methods by comparing Uster yarn tester and CCT methods
08
A Computer-Based System for Evaluation of Slub Yarn Characteristics
R. Abd El-Khalek, R. El-Bealy, A. El-Deeb
To build computer-based measuring system for yarn slub evaluating by using uster yarn evenness tester as a measuring sensor
09 New Possibility of Objective Evaluation of yarn appearance
E. Moekova, P. Jiraskova
To develop a new and objective evaluation of yarn appearance method by using semivariogram evaluation method and matlab software.
10 Integrated Digital System for Yarn Surface Quality Evaluation using Computer Vision and Artificial Intelligence’
S.Li, J. Feng, B. Bxu et al
Developing automatic method of yarn surface evaluation by using matlab and artificial neural network system
11 Grading of yarn appearance using image analysis and an artificial intelligence technique.
D. Semnani, M. Latifi, M. Tehran et al
-To extend the human inspection methods of yarn grading system by using artificial intelligence and matlab image processing
Generally this paper reviewed some journal papers which are related to the textile yarn quality testing methods and we summarized their aims, applied software and algorithms in the above table. Even if many researchers have proposed different methods for textile yarn surface appearance evaluation and grading process, the yarn manufacturing companies did not adopted to apply the current proposed yarn testing methods. Because internationally, between yarn suppliers and customers mostly they communicate and exchange the yarn products based on ASTM standard testing method which is depend on the traditional way of visual assessment of yarn appearance by using photographic images. In addition to this, since researchers applied some complex software and the yarn quality inspectors are not well trained
for such method, it is difficult to use the proposed testing systems. This project concerned on the process of evaluating and deciding the cotton yarn surface quality by applying image processing of blackboard yarn winder in MATLAB software to generate the white pixel of the yarn from the whole blackboard surface, and by using mathematical equation of a fuzzy logic membership function for grading in percentage.
C. Statement of the problem
Instead of manual blackboard yarn appearance grading
system, using a
computerized and
In MATLAB
appearance grading system and outputs will be improved and can get accurate result by replacing the human vision and perception grading method. However, in textile yarn manufacturing, many industries use the traditional one of blackboard yarn grading system, it needs two or more persons to observe and decide the yarn grade visually by compare and contrast with the standard ASTM (D-2255) [12], photograph image, and it is tedious for visual observing the yarn surface defects. To solve this problem, using of software based yarn evaluating method is important to get more precise yarn grading result. In addition to this the yarn image and analysed data result can be stored in a computer for a long time. To accomplish this investigation and to apply in Textile Company to replace the human visual grading system, it requires cost effective digital camera, and computer with MATLAB software in addition to the blackboard yarn winder machine.
D. Impact of MATLAB yarn image processing on the blackboard yarn appearance grading system
In this paper, using of MATLAB cotton yarn image processing for evaluating yarn surface quality has a great effect over the traditional type of blackboard yarn appearance grading system. The first one is by replacing the visual observing and evaluation of yarn surface defects which wound on blackboard, it removes the human perception error and time consuming of yarn quality grading. Secondly, the yarn evaluation system is basically will be implemented using the MATLAB and for the reason that the efficient behaviour with the types of images and the ease of the operation to be performed. Finally, the traditional one of blackboard yarn appearance grading system could not store the tested result and yarn image, while the versatility of using software based yarn evaluating method that the yarn image and analysed results can be stored in a computer for a long time.
E. Objective of the project
The objective of this project mainly concerned on the improving of the manual blackboard cotton yarn winder and appearance grading system by using computerized MATLAB image processing and to get accurate yarn surface quality grading result. It is also applied to replace other auto method type of yarn quality inspection machine which is expensive in price and costy for maintenance (e.g. uster yarn tester).
ІІІ. METHODS AND MATERIALS
The methodology of this research for yarn appearance grading process by using computerized and MATLAB image processing and analysing is on the basics of blackboard yarn winder, and image acquirement with the use of cost effective digital camera. The image to be evaluated, has to be converted to binary image in order to get the number of white and black pixels. The method of image process and yarn grading is schematically represented as shown in the figure below.
[image:4.595.304.547.78.163.2]
Figure 3. Major Components for yarn appearance grading system by using MATLAB image processing The methodology, that the whole system consists of the pre-processing to ready samples for camera image capturing and software for image processing and analysing to evaluate the yarn appearance. In this paper to accomplish the experiment, the required material includes: yarn wound blackboard; digital camera; and computer with matlab software.
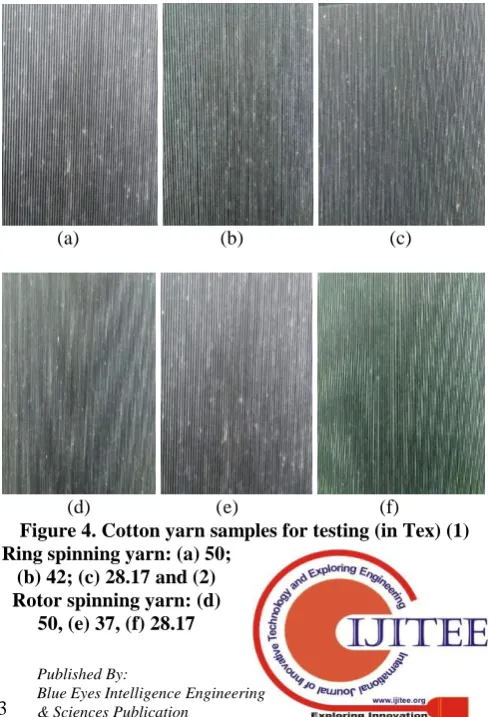
1. Pre-processing─ This step describes the image setup technique which comprises the process of sample preparation by which either manually operated or motor driven machine for winding yarn sample which is to be evaluated on the thermosetting resin bonded laminate trapezium shape type of blackboard. The equipment is also fitted with the traversing guide to advance the yarn across the board as it is wound. To wound the yarn sample on the board plate surface, the quality tester should follow the ASTM standard specimen preparation requirements and procedures based on the sample yarn count. But to accomplish this research, we received the prepared yarn sample image by email from Kombolcha Textile Industry which found in Ethiopian Country. In the figure below are the received yarn samples that we used for experiment in this investigation.
(a) (b) (c)
(d) (e) (f)
Figure 4. Cotton yarn samples for testing (in Tex) (1) Ring spinning yarn: (a) 50;
(b) 42; (c) 28.17 and (2) Rotor spinning yarn: (d)
50, (e) 37, (f) 28.17
Binary image conversion
Image thresholding Grey scale
image Image
acquiring Pre-process
ing
[image:4.595.304.549.471.830.2]International Journal of Innovative Technology and Exploring Engineering (IJITEE) ISSN: 2278-3075, Volume-8 Issue-9, July 2019
2. Image acquiring─ Image capture process accomplished after yarn wound on the blackboard surface by using a digital camera. The image taking carried out on both sides of the blackboard surface in order to take average grade evaluation of one sample of single yarn count. During image capturing, it’s necessary to use a proper resolution and zooming out
image taking process in order to obtain the required image quality.
3. Grey scale image─ In this phase the captured image is converted into the grey scale image by using ‘rgb2gray’ MATLAB command in graphical user interface. It also known as an intensity or grey image with three arrays of the intensity values ranging from [0, 255] for 8bit units.
4. Image thresholding─ Image thresholding a simplest way for partitioning an image into a foreground and background level and in order to get clear and fuzzy free image. This type of image analyse technique is used for image segmentation that isolates objects by converting grayscale image into binary image.
[image:5.595.307.543.133.216.2]5 Binary image conversion─ Here as the name indicates, it contains only two colours (i.e. white and black) and two pixel values (0 and1), where 0=black and 1=white colour. From this in MATLAB image processing, the result of white pixel value of the binary image plays a vital role for this research, in order to decide the yarn appearance based on the analysed pixel value of the binary image of yarn sample. In the below diagram, since the foreground part combines the pure (core) yarn and its surface defects, when it has more defects, the whole yarn surface on the blackboard becomes wider and due to this its white pixel will be large. This expression becomes vies- versa at the time of minimum yarn surface defects.
Figure 5. Yarn wrapped blackboard binary image components
Generally from the above mentioned image processing algorithm, grey scale image conversion and image thresholding both are important to remove the noisy and unclear parts from the sample surface in order to get clear image for better test result during yarn pixel value generating in this paper by using MATLAB image processing. In this project to accomplish the experiment, the required material includes; yarn cone, backboard yarn winder, cost effective digital camera and computer. So generally the materials used for this investigation are diagrammatically listed below.
(a) (b)
Figure 6(1). Materials for experiment: (a) Yarn cone; (b) Yarn wound blackboard
(c) (d)
Figure 6(2). Materials for experiment: (c) Digital camera; (d) Computer with MATLAB
Yarn image processing
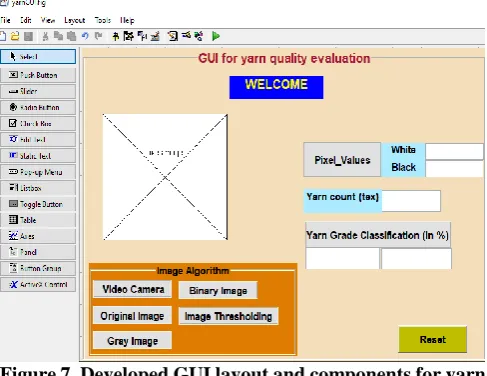
[image:5.595.48.270.360.494.2]To analyse this process, first a simple graphical user interface (GUI), has been created for MATLAB algorithm of yarn image processing. GUI tool makes the image processing to be easier and faster, because image processing in MATLAB has become more efficient, and interactive for user in order to have a clear idea for the outcome of the work, while in visual inspection it’s insufficient and time consuming. GUI Layout Editor can be opened by typing ‘guide’ matlab tool in the command window and then by using different components the GUI will be created as shown in the figure below.
Figure 7. Developed GUI layout and components for yarn image processing and analysing.
Once the GUI based on the requirement component is formed, and when the figure is saved, two files (the figure file and M. file) will be formed with the same filename but different extents. The figure file contains the actual formed components and figure layout and M. file contains the MATLAB program to load and control the figure and call-back function for each formed elements. Then write MATLAB program function and for each formed of GUI figure layout and components by using call-back function. This function used to respond the matlab program for each event and components or to
[image:5.595.305.549.407.595.2] [image:5.595.46.291.632.731.2]In MATLAB
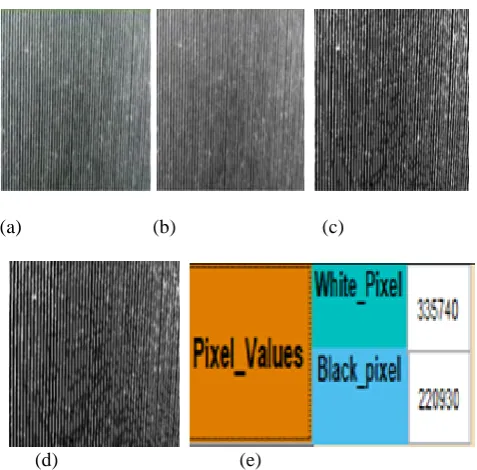
Generally during the time of image processing and analysing of the yarn sample which wound on the blackboard surface, in MATLAB software by using a simple graphical user interface, the output result which includes the binary pixel value (black and white pixels), and the different stages of image processing are described in the figure below sequentially step by step.
(a) (b) (c)
[image:6.595.47.286.139.374.2]
(d) (e)
Figure 8. Yarn image processing in GUI and its output: (a) Original image, (b) Grey scale image, (c) Threshold image,
[image:6.595.50.290.516.626.2](d) Binary image, and (e) output pixel values After blackboard cotton yarn image processing and analysing in the developed MATLAB graphical user interface, the output of binary image pixel values (white and black pixels) of all yarn count samples are listed below.
Table 3─ Generated pixel values of the binary image or each yarn count sample
Sample source
Count (tex)
Binary image pixel values White pixel Black pixel
Ring spinning
50 392514 301136
42 388800 216510
28.17 325296 237652
Ring spinning
50 380340 298630
37 402526 313526
28.17 368286 204657
Based on ASTM standard (D-2255) method, totally there are six series of yarn count ranges which are applicable the world textile manufacturing industry. According to the investigation of [13], all four graded yarn images of each count ranges have their fixed white pixel values. The white pixels of the analysed image describes the foreground (yarn surface) quality, because it is the combination of pure (core) yarn and surface defects. That means the fewer pixels describes the higher yarn quality (less thick place and neps) and smooth surface appearance, while higher pixels describes low yarn quality (more thick place and neps.
ІѴ. RESULT AND DISCUSSION
A. Yarn quality grading and classification
In this studying, after generating the pixel value of cotton yarn sample image, next object is using a mathematical equation of fuzzy logic system membership function and formulate MATLAB program, to decide its degree of membership based on the amount of pixel values. The fuzzy logic is defined as a tool that uses a degree of membership which always range between o and 1 in sets rather than the binary truth value and it help to validate a vagueness information by making a fuzzy membership function [14 15]. The yarn quality evaluation and grading system will takes place by grouping in a fuzzy set of classes based on their relative similarities of the standards and by calculating the degree of membership, which defines the truth value of the yarn in the given fuzzy set. The degree of membership in a fuzzy set can be defined by a mathematical function which is called membership function (MF). MF is a curve that defines how each point in the input space is mapped to a membership value (degree of membership) between 1 and 0 or it is a graphical representation of each input values, and ts denoted by miw (µ). In MF, the input space sometimes termed to as the fuzzy set width or universe of discourse [16]. Since, mostly the visual assesment of yarn surface grading report result is in uncertainity and vagueness form, this project is applyied to cover such limitation.
B. Develop input and output variable of fuzzy logic MF for yarn quality grading process
To classify and to decide the yarn surface appearance, this paper take a triangular (trimf) and trapezoidal (trapmf) membership function, to build input and output variable of fuzzy logic membership function. This project choice the second yarn count series of ASTM (D-2255), to construct a fuzzy logic membership function and fuzzy sets, because the cotton yarn sample that we collected from Kombolcha Textile Share company (KTSC) belongs between this standard count ranges.The following figures (figure13 & figure14), describes the input and output variables of MF based on the given parameters respectively.
Table 4─ Parameters to construct input variable fuzzy logic membership function
No. Varia ble
Membership function
Crisp values (parameters for each membership)
1 A Trapezoidal (3.0 , 3.0, 3.235, 3.763)*105 2 B Triangle (3.235, 3.763, 4.151)*105 3 C Triangle (3.763, 4.151, 4.685)*105
4 D Trapezoidal (4.151, 4.685, 5.0, 5.0)*105
[image:6.595.306.545.566.646.2]International Journal of Innovative Technology and Exploring Engineering (IJITEE) ISSN: 2278-3075, Volume-8 Issue-9, July 2019
Figure 9. Input variables of fuzzy logic MF for white pixel values
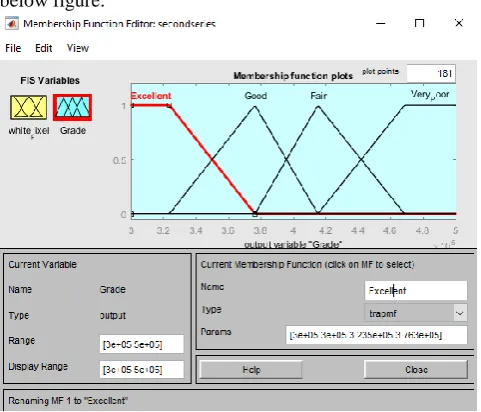
[image:7.595.47.290.48.243.2]Theoutput variable of quality grade, has four linguistics and its universe of discourse is ranging same length like that of input variable in order to have equal width and same shape membership function. The output variable is described as below figure.
Figure 10. Output variable of MF for yarn grading and classification
The next step is develop fuzzy rule viewer based on the number of constructed variables of MF. The fuzzy logic rule viewer easily shows how each rules are combined together in order to get the final crisp value. The figure below shows the developed rule viewer, for both yarn image pixel input variable and grade quality output variable. As shown in the left bottom side of input area by changing the pixel numbers simply it’s possible to gate output values of the aggregated
[image:7.595.305.545.68.230.2]rules in right corner side.
Figure 11. Rule viewer of the input white pixel and output quality grade variables
Based on the above developed rule viewer, and by taking the previous generated pixel values of cotton yarn sample images from table3, the combined rules output crisp value becomes as follows in the table.
Table 5─yarn sample pixel and output variable crisp values
Sample source Count (tex)
Sample pixel value
aggregated output
Ring spining
50 392514 392514
42 388800 339583
28.17 325296 326734
Rotor spining
50 380340 378906
37 402526 402412
28.17 368286 366414
The decision and classification of yarn appearance grading and classification will accomplish by formulating a MATLAB program based on the triangular and trapezoidal MF equations, and it will be done in the developed GUI layout and components. Reading the constructed fuzzy logic membership by using ‘readfis()’ function in the formed MATLAB graphical user interface.
>> fis =readfis (‘SecondSeries’);
The aggregated output is generated by evalfis() function and it’s written as;
>> Output= evalfis(whitePixel, fis);
[image:7.595.47.288.324.530.2]In MATLAB
Figure 12. Final yarn appearance evaluation result in the developed GUI layout
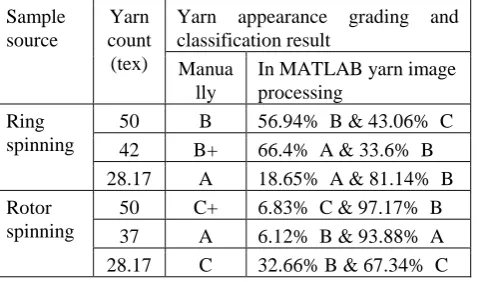
Finally, the yarn surface appearance description and classification result can be conclude as shown in table below. In this investigation the selected adjective words, that we used to describe the yarn appearance and grade classification which includes (excellent, good, fair, and very poor) will replaced the standard letters (A, B, C, and D) respectively. Because, in yarn manufacturing industry mostly, quality evaluators used these adjective words instead of letters to assess the yarn surface appearance.
Table 6─yarn quality grading and classification result
Sample source
Yarn count
(tex)
Yarn appearance grading and classification result
Manua lly
In MATLAB yarn image processing
Ring spinning
50 B 56.94% B & 43.06% C
42 B+ 66.4% A & 33.6% B
28.17 A 18.65% A & 81.14% B Rotor
spinning
50 C+ 6.83% C & 97.17% B
37 A 6.12% B & 93.88% A 28.17 C 32.66% B & 67.34% C
From this work result and discussion, it could be noted that by using MATLAB image processing and a fuzzy logic system membership function the yarn quality evaluation and appearance grading can be assessed and analysed based on the generated pixel values. This studying shows accurate result than the traditional methods, because this work accomplished by converting the whole yarn surface area into quantitative value (pixels) and it gives the result in percentage instead using ‘+’ sign after the letter and other human perception errors.
Ѵ. CONCLUSION
This paper applied MATLAB software for cotton yarn image processing and fuzzy logic system (FLS) to evaluate and classify the yarn surface appearance based on the generated pixel values of the cotton yarn image which wound on blackboard surface. Traditionally by using the standard method of ASTM (D-2255), the yarn quality checker sometimes give same grade for which has different yarn surface appearance in the same yarn count and which get from the same processing machine. Even in case of blackboard
warping, due to the difficult of precisely evaluating the yarn appearance and when sometimes the grade falls between the two consecutive grades, they denotes the grade by using plus sign after the letter based on their perception. In yarn manufacturing textile industry, many methods are available to determine the yarn evenness, many of them are tedious and the grading result is depend on the quality checkers skill, while others those less subjective and of high speed, are probability expensive and required high cost for maintenance during damaging time because of their more sensitive and easily damageable parts. Therefore, this project proposed a simple method to evaluate yarn appearance by using mathematical equation of fuzzy logic membership function and we get accurate appearance grading result by removing the manual testing method limitation.
REFERENCES
1. Kaur M., and Sharma M., ‘Evaluation of Yarn Quality in Fabric Using Image Processing Techniques’, Journal of Applied Engineering and Technology: Indian, Vol. 4(4), 2014.
2. Niles SN. Dias WPP, Perera TKM, Vinoth W., and Wijenayake EMR., ‘A Vision-Based Method for Analyzing Yarn evenness’ Journal of Scientific & Technology Research: Volume 6, Issue 02, 2017. 3. Member ITEEE, Jayaashree V., and Deepgana.I.Dhap, ‘Developing
Two Traditional Methods for Yarn Diameter Measurement’, 2013. 4. ASTM International (D2255-2), ‘Standard Test Method for Grading
Spun Yarns for Appearance’, PO Box C700, West Conshohocken, PA 19428-2959, United States, 2002.
5. H. Souid, ‘A Generalized Model for Predicting Yarn Global Quality Index’, Journal Textile Research Unit of ISET of Ksar-Hellal: Tunisdia, Volume 5 9, 2012.
6. J. Li, B. Zuo, C, Wang et al, ‘A Direct Measurement Method of Yarn Evenness Based on Machine Vision’, Soochow University, Journal of Engineered Fibers and Fabrics,Volume 10, Issue 4, 2018.
7. Zhang D., And Chang L., ‘Comparison of Two Different Yarn Evenness Test Methods’, China, College of Textiles, Tianjin Polytechnic University, 2010.
8. R. Abd El-Khalek, R. El-Bealy, A. El-Deeb, ‘A Computer-Based System for Evaluation of Slub Yarn Characteristics’, Egypt, Mansoura University, and Textile Engineering Department: Volume 2014, Article ID 784516, 2014.
9. E. Moekova, P. Jiraskova, ‘New Possibility of Objective Evaluation of Yarn Appearance’, Journal of Department of Textile Technologies: Vol. 12, No1, 2012.
10. S. Li, J. Feng, B. Bxu et al., ‘Integrated Digital System for Yarn Surface Quality Evaluation using Computer Vision and Artificial Intelligence’, Institute of Textiles and Clothing: Hong Kong Polytechnic University, 2012.
11. D. Semnani, M. Latifi, M. Tehran et al, ‘Grading of Yarn Appearance Using Image Analysis and an Artificial Intelligence Technique’, Textile Research Journal: Vol 76(3), 2016.
12. Shedthi B., Shetty S., And Siddappa M., ‘Development and Implementation Of Graphical User Interface for Image Pre-processing Using Matlab’, Journal of Computer Applications: Volume 161, 2017. 13. Ghazi A., Khaddam H., and Horani M., ‘A New Method to Evaluate the Appearance of Cotton Yarn Using Image processing and Fuzzy Inference System Supported with Graphical User Interface’, Journal of Textile Science & Engineering: Damascus University, Syria, 2018. 14. S. Princy, ‘Comparison of Triangular and Trapezoidal Fuzzy
Membership Function’, journal of Computer Science and Engineering, paper 6, Vol 2, 2016.
15. A. Safari, ‘fuzzy image processing’, power point, 2017.
16. O. Ali, A. Ali, B. Sumait, ‘Comparison between the Effects of Different Types of Membership Functions on Fuzzy Logic Controller Performance’, Journal of Engineering and Research Technology: Volume 3, 2015.
17. [17] Y. Bai, D. Wang, ‘Fundamentals of Fuzzy Logic Control — Fuzzy Sets, Fuzzy Rules and
[image:8.595.54.295.394.535.2]