Abstract: This paper focused on building predictive models for data mining projects and knowledge discovery functionalities. The objectives are 1) data selection and transformation, 2) Generation of a prediction models using classification data mining techniques, 3) Identification of different attributes which affects retention and performance of students and 4) Comparison of accuracy on the classification techniques used in the prediction models. The study used dataset from the students enrolled in the BS Computer Engineering program. Decision tree classifiers such as ID3, J48 and CART were used to build models. Results of the study showed that when the attribute evaluation was conducted using WEKA (Waikato Environment for Knowledge Analysis), the College Entrance Test (CET) got the highest significant value among the identified attributes in predicting the retention and performance of studentswhile J48 got the highest accuracy rating when classifying instances. However, further research on factors or attributes that influence retention and performance of students should be investigated and to include other programs in the University to improve the accuracy of the results of classification.
Index Terms: Data Mining, ID3, J48, CART, CET, GWA, HSGPA, SCHLR
I. INTRODUCTION
Today higher education institution are facing the problem of student retention. Every institution follows approved retention policy to ensure the quality of students who will complete college. One of this institutions is Isabela State University, a state university located in the Cagayan Valley Region in the Philippines. The University has a total of one thousand seventy five (1,075) employees composed of faculty and non-teaching personnel and more than sixteen thousand (16,000) students distributed to the different campuses. As a general University policy on retention, any student shall be classified according to the scholastic status depending on their academic performance. Student with no failing grade belong to a clear status. Any student who obtains final grade below 3 in less than 25% of the total number of academic units for which he is registered during the semester is in good standing status. Warning status is given to any student who obtains final grade below 3 in 25% of the total number of academic units for which he is registered during the semester and shall have limited academic load to be determined by the Dean or Academic Adviser. Probation status is given to any student who obtains final grades below 3 in 50%-74% of the total academic units in which he is enrolled for the semester. Dismissed status is given to student who, at the end of the
Revised Manuscript Received on May 06, 2019
Allen M. Paz, College of Computing Studies, Information and Communication Technology, Isabela State University, Cabagan, Isabela, Philippines.
semester obtained a grade below 3 in 75% but less than 100% of the total number of academic units enrolled during the semester. Permanent disqualification status is given to student who obtains final grade below 3 in 100% of the academic units enrolled during the semester. Student in this academic status will no longer be allowed to enroll in any program in all campuses of the University. A student may regain a status of good standing by passing more than 50% of the units in which he enrolled during the semester, otherwise, he shall be dropped from the roll of the college where he belongs. Any student dropped from the roll of one college shall not be admitted to another college in the University. However, in extraordinary cases, where the student‟s aptitude is different from where he has failed. He may be recommended by the Guidance Office to the College Dean or Campus Head to be allowed to enroll in another unit where his aptitude may be developed. Re-admission to any college of the University shall be allowed only once. No re-admission of dismissed or disqualified student shall be considered by the Dean without favorable recommendation from the Director of the Student Services or his authorized representative. (ISU and You Student Handbook).
This general retention policy was formulated, approved and implemented to encourage students to study seriously and strive to earn college degrees. Early identification of vulnerable students who are prone to drop their courses is crucial for the success of any retention strategy. This would allow education institutions to undertake timely and proactive measures. Early identification of at-risk students can be the recipient of academic and administrative support to increase their chance of staying in the course and eventually complete the program.
The evolving reforms in higher education system in the Philippines aimed at improving the performance of state Universities in changing economic condition. Thus, retaining good students who will become source of human capital to improve the economy of the country is a gargantuan task for the University. It is a challenge every higher education institution must accept and monitoring students‟ performance is not an easy task for an academic institution with large number of students. The implementation of retention policy is sometimes too drastic for the student to accept and therefore early discovery of at risk students may cause the students to strive harder to stay in the program. Thus, this study was concerned to build prediction models for performance and retention of students using decision tree classifiers.
The research by [1] attempted to use data mining particularly classification to
Building Predictive Models For Data Mining
Projects
help enhance the quality of higher educational system by evaluating student data to study the main attributes that affect the student performance in courses. Three different classification methods namely ID3, C4.5, and the NaïveBayes were used. The result of their study shows that HSGrade (the high school grade) has the highest gain ratio. This attribute is considered as the root node of the decision tree. From the results obtained, they notice that the classification algorithms for the three algorithms is not so high which implies that the samples and attributes are not sufficient to generate a high quality classification model.
The research by [2] adopted an experimental methodology to generate database. By means of Bayesian classification method on 17 attributes, it was found that the factors like students‟ grade in senior secondary education, living location, medium of teaching, mother‟s qualification, students other habit, family annual income and student‟s family status were highly correlated with the student academic performance. They found out that academic performance of students are not always dependent on their own effort. The research shows that other factors have significant influence over students‟ performance.
According to [3] “education is a crucial element in the society” and to improve the quality of education and enhance school resource management, they have addressed the prediction of secondary grades of two core classes (Mathematics and Portuguese) by using past school grades, demographics, social and other school related data. The results were obtained using decision trees, random forests, neural networks and support vector machines. They achieved high level of predictive accuracy when the past grades were included. In some cases their models included also the school related features, demographics (student‟s age, parent‟s job and education) and social variables.
The research by [4] identify learning processes based on data extracted from log files. The log files document the learner‟s action within an online learning environment. Four elementary school students were the subject of the study. A graphical representation tool was used to visualize students‟ learning process over time. Seven learning variables were defined and computed showing the difference between the learning processes. The variables are Time in the Module, Time on Task, Relative Time on Task, Resource Consumption, Completion Rate, Sequence of Learning and Time Segmentation. Their study serves as a base for a bigger research to understand learning processes in Web-based learning environment. The information is important for educators to evaluate the student‟s learning processes based on their actual behaviors and preferences.
According [5] a software for data mining was described as a tool that can be used to analyze data from different dimensions. It will categorize and summarize the relationships identified during the process of mining. The research by [7] focused on the student performance in intermediate examination associated with the profile of students such as attitude towards attendance in classes, time allocation for studies, parents‟ level of income, mother‟s age and mother education. A hypothesis was formed based on the
students' family income, students' mother's age and mother's education are significantly related with student performance". By means of simple linear regression analysis, it was found that the factors like mother‟s education and student‟s family income were highly correlated with the student academic performance.
A research by [8] investigated the prognostic value of certain cognitive, non-cognitive and demographic variables in relation to scholastic achievement of higher secondary students in science stream. The cognitive variables are intelligence (verbal and non-verbal) and creativity. Non-cognitive variables are personality and achievement motivation while socio-economic status for the demographic variables. The selection was based on cluster sampling technique in which the entire population of interest was divided into groups, or clusters (high achievers and low achievers), and a random sample of these clusters was selected for further analyses. It was found that girls with high socio-economic status had relatively higher academic achievement in science stream and boys with low socioeconomic status had relatively higher academic achievement in general.
A research by [9] presented a case study on educational data mining to identify up to what extent the enrolment data can be used to predict student‟s success. The algorithms CHAID (Chi-square Automatic Interaction Detection) and CART (Classification and Regression Tree) were applied on student enrolment data of open polytechnic of New Zealand to get two decision trees classifying successful and unsuccessful students. The accuracy obtained with CHAID and CART was 59.4 and 60.5 respectively. The results show that the most important factors separating successful from unsuccessful students are ethnicity, course program and course block, CART was the most successful in growing the tree and both the risk estimated which are based only on enrolment data, are not good in separating successful from unsuccessful students. A research by [10] used data mining technique name Bayesian classification in predicting performer or underperformer students It was found that whether new comer students will become performer or some will not. The study helped the institution reduce the drop out ratio to a significant level and improve the performance level of the institution.
A research by [11] applied a data mining approach to differentiate predictors of retention among freshmen students. Using the classification tree based on an entropy tree-splitting criterion, they concluded that „cumulated earned hours‟ was the most important factor contributing to retention. Gender and ethnic origin were not identified as significant.
As this study was concerned to build prediction models for performance and retention of students using decision tree classifiers the objectives are:
1. Data selection and transformation;
2. Generation of prediction models using classification data mining techniques;
3. Identification of different attributes which affects retention and performance of students; and
techniques use in the prediction models.
Concept of Data Mining
The process of extracting useful knowledge and information including, patterns and association is known as data mining. It is considered as one of the knowledge discovery step, which interacts with user or knowledge base. The interesting patterns are presented to users, and can be stored as new knowledge. Even though it is only one step in the entire knowledge discovery processes it is considered essential since it uncover hidden patterns for evaluation [6].
II.WORK DONE/CONTRIBUTIONS A. Framework of the Study
The study made use of the Knowledge Discovery Process (KDP) as illustrated by [7]. The KDP figure was modified to suit the objectives of the study. The modified version is presented on Fig.1. The process starts from preprocessing of data used in the study, followed by selection and transformation of data where data are transformed into a type compatible to the software used in data mining and interpretation and evaluation of the results to gain knowledge.
Fig. 1. Framework of the Study
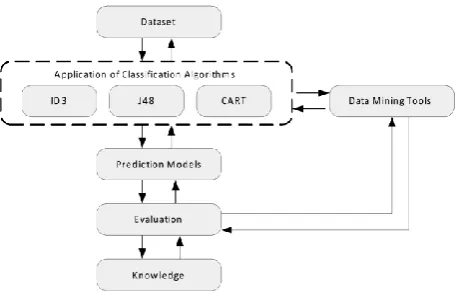
B. Data Mining Process Framework
[image:3.595.312.542.49.199.2]Data mining process framework in Fig. 2 shows the data mining process used in the study. The dataset is produced after data preprocessing. This serves as input to the data mining tool for the application of the selected classification algorithms such as ID3, J48 and CART to produce prediction models. The prediction models are then evaluated based from their classification accuracy consistent with the results obtained from training dataset. The knowledge discovered can then be used for decision making.
Fig. 2. Data Mining Process Framework
C. Methodology
Proposed Model
The proposed model makes prediction about retention of students based on university entrance examination result, general point average in high school and previous semester average.
If CET= good, HSGPA= first; GWA=high, then performance = high
If CET=average, HSGPA= second; GWA=Medium, then performance = average
If CET=poor, HSGPA= second, GWA=low, then performance = low
If CET=good, HSGPA= third, GWA=Med, then performance = average
If CET=poor, HSGPA= third, GWA=low, then retention = low
Application
The data gathered from university students was analyzed using a decision tree algorithms such as ID3, J48 and CART. The following steps were performed in sequence:
Application Software
Weka 3.6 a popular data mining software was used to analyze the dataset.
Data Mining Process
The following steps consist of a data mining process:
a. Data Preparation/Preprocessing
In this step, data were cleaned removing those with incomplete information and completing those which can still be completed.
b. Data Selection and Transformation
The following variables were defined as the domain values for the variables used in the study.
CET = College Entrance Exam. This variable was divided into three set values: Good : >=60, Average : >=40 and < 60, Poor >=20 and <40
GWA = General Weighted Average. This variable was divided into three set values: High : <=2.0, Medium: >2.0 and <=2.5, Low: >2.5
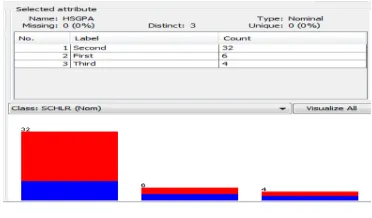
[image:4.595.299.533.48.222.2]HSGPA = High School General Point Average. This variable was divided into four set values: First: >=90%, Second: >=85% and < 90%, Third: >= 75% and < 85%, Fail < 75%. SCHLR = Scholar. This variable contains a yes or a no value.
Table I.
Student Related Variables
Variable Description Possible Values HSGPA High School General
Point Average
{First >=90%, Second >= 85% and < 90%, Third >=75% and < 85%, Fail < 75%}
CET College Entrance
Test
{Good : >=60, Average : >=40 and < 60, Poor >=20 and <40}
GWA General Weighted
Average
High = <=2.0 Med = >2.0 and <=2.5
Low = >2.5
SCHLR Scholar Yes/No
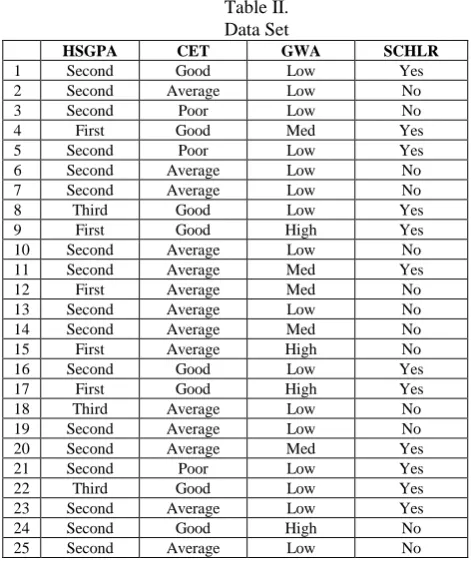
c. Dataset
[image:4.595.41.277.221.416.2]The dataset shown in Table II were among the data gathered from the ICT Department of Isabela State University. Initially 42 students were enrolled in the BS Computer Engineering program.
Table II. Data Set
HSGPA CET GWA SCHLR
1 Second Good Low Yes
2 Second Average Low No
3 Second Poor Low No
4 First Good Med Yes
5 Second Poor Low Yes
6 Second Average Low No
7 Second Average Low No
8 Third Good Low Yes
9 First Good High Yes
10 Second Average Low No
11 Second Average Med Yes
12 First Average Med No
13 Second Average Low No
14 Second Average Med No
15 First Average High No
16 Second Good Low Yes
17 First Good High Yes
18 Third Average Low No
19 Second Average Low No
20 Second Average Med Yes
21 Second Poor Low Yes
22 Third Good Low Yes
23 Second Average Low Yes
26 Second Poor Low No
27 Second Average Med No
28 Second Average Low No
29 Second Good Low Yes
30 Second Average Med No
31 Second Poor Low Yes
32 Second Poor Low No
33 Second Average Low No
34 Second Average Low No
35 Second Poor Low No
36 First Average Med No
37 Second Average Med No
38 Second Average Med No
39 Second Average Low No
40 Second Good Med No
41 Second Average Low No
42 Third Average Low No
d. Model Construction/Simulation
d.1 Data Visualization
[image:4.595.328.519.331.450.2]Fig. 3 shows that 64% of students got a GWA of >2.5, during first semester, 26% got a GWA of 2.5 or better and only 10% of students got a GWA of 2.0 or better.
Fig. 3. GWA Indicator
Fig. 4 shows that 24% of students got a score of 60 or higher during the college entrance test given by the university, 60% got a score of less than 60 but not lower than 40 and 16% got a score of less than 40 but not lower than 20.
Fig. 4. CET Indicator
[image:4.595.40.276.507.788.2] [image:4.595.330.516.550.669.2]Fig. 5. HSGPA Indicator
[image:5.595.75.261.248.357.2]Fig. 6 shows that 33% of students are scholars while majority or 67% are not scholars.
Fig. 6. SCHLR Indicator
d.2 Results Obtained
[image:5.595.330.523.342.590.2]One of the objectives of the study is to generate a prediction model using classification techniques such as ID3, J48 and CART using variables CET, GWA, HSGPA and SCHLR. Another objective is to identify which attribute affects the retention and performance of students. It also aimed to find out which of the predictions models is the most accurate in classifying instances. Following are the results: The results of testing the classifiers‟ accuracy is presented in Table III. It can be seen from the table that J48 got a highest accuracy rating of 71.43% compared to ID3 and CART algorithms for classification applied to the datasets using 10-fold cross validation:
Table III. Classifiers Accuracy Algorithm Correctly Classified
Instances
Incorrectly Classified Instances
J48 71.43% 28.57%
ID3 66.67% 28.57%
CART 69.05% 30.95%
d.3 The Prediction Models
Rule-based classifiers such as ID3 and CART make use of the collection of if-then statements to present the rules derived which ensures that every record is covered by at most one rule while J48 presents the rules by forming a tree. These if-then rules and trees generated by the classifiers are referred to in this study as prediction models.
ID3 (Iterative Dichotomiser 3)
The prediction model generated by ID3 in a 10-fold cross validation is presented in Fig.7. It consists of the following 11 rules:
If CET = Good and GWA = Low then Retention = Yes If CET = Good and GWA = Med and HSGPA = Second then
Retention = No
If CET = Good and GWA = Med and HSGPA = First then Retention = Yes
If CET = Good and GWA = High and HSGPA = Second then Retention = No
If CET = Good and GWA = High and HSGPA = First then Retention = Yes
If CET = Average and GWA = Low and HSGPA = Second then Retention = No
If CET = Average and GWA = Low and HSGPA = Third then Retention = No
If CET = Average and GWA = Med and HSGPA = Second then Retention = No
If CET = Average and GWA = Med and HSGPA = First then Retention = No
If CET = Average and GWA = high then Retention = No If CET = Poor then Retention = No
Fig. 7. Prediction Model of ID3
J48
The prediction model generated by J48 in a 10- fold cross validation is presented in Fig. 8. The size of the tree is 4 having 3 leaves. The tree is interpreted as follows:
[image:5.595.50.287.569.649.2]Fig. 8. Prediction Model of J48
CART
The prediction model generated by CART in a 10- fold cross validation is presented in Fig. 9. The size of the tree is 7 having 4 leaf nodes. The tree is interpreted as follows:
If CET = Average or Poor then retention = No
If CET = Average or Poor and HSGPA = Second and GWA = Med or High then Retention = Yes
[image:6.595.303.549.54.131.2]If CET = Average or Poor and HSGPA = Second then Retention = Yes
Fig. 9. Prediction Model of CART
[image:6.595.307.546.201.365.2]The confusion matrix shown in Table V, VI and VII compared the actual and predicted classifications. In addition, the classification accuracy for the two-class outcome categories was presented.
Table V.
Confusion Matrix – ID3 Prediction Model
Retention/Performance
Predicted % of
Correct Precision
Yes No
Actual Yes 7 7 58.3%
No 5 21 75%
Table VI.
Confusion Matrix – J48 Prediction Model
Retention/Performance
Predicted % of
Correct Precision
Yes No
Actual Yes 8 6 57.1%
Table VII.
Confusion Matrix – CART Prediction Model
Retention/Performance
Predicted % of
Correct Precision
Yes No
Actual Yes 7 7 53.8%
No 6 22 75%
The classifiers accuracy on the given dataset is presented in the form of a graph in Fig. 10. It can be seen that J48 has a higher percent of accuracy in terms of correctly classified instances compared with ID3 and CART.
Fig. 10. Comparison of Classifiers
III. CONCLUSION
Based from the result of the study the College Entrance Test (CET) got the highest significant value among the identified attributes in predicting the retention and performance of students while J48 got the highest accuracy rating when classifying instances compared to ID3 and CART. However, further research on factors or attributes that influence retention and performance of students should be investigated and to include other programs in the University to improve the accuracy of the results of classification.
IV. FUTURE WORK
Future researchers may use additional predictor variables such as demographic profile, income of parents and other variables to increase the accuracy of the resulting model. As author‟s further work, she intend to use the model as a process model to develop an appropriate data mining system for Isabela State University (ISU) based on the priorities and requirements of the institution so that the university will be reaching a higher level of academic standard.
ACKNOWLEDGMENT
The author would like to express her appreciation and gratitude to the Administrators of the Isabela State University Cabagan Campus from the Executive Officer to the Dean of the College for allowing her to conduct the study in the campus and to the BS Computer Engineering students for answering the author‟s
[image:6.595.43.294.370.492.2] [image:6.595.44.292.590.782.2]REFERENCES
1. Q. A. AI-Radaideh, E. M. AI-Shawakfa, and M. I. AI-Najjar, “Mining Student Data using Decision Trees,” International Arab Conference on Information Technology(ACIT'2006), Yarmouk University, Jordan, 2006.
2. B. K. Bharadwaj, and S. Pal, “Data Mining: A prediction for performance improvement using classification,” International Journal of Computer Science and Information Security (IJCSIS), Vol. 9, No. 4, pp. 136-140, 2011.
3. P. Cortez, and A. Silva, “Using data mining to predict secondary school student performance.” In the Proceedings of 5th
Annual Future Business Technology Conference, Porto, Portugal, 5-12, 2008.
4. A. Galit, A. Hershkovitz, R. Mintz, and R. Nachmias, “Examining online learning processes based on log files analysis: a case study.” Research, Reflection and Innovations in Integrating ICT in Education 2007.
5. J. Han, and M. Kamber, "Data Mining: Concepts and Techniques,” 2nd edition. The Morgan Kaufmann Series in Data Management Systems, Jim Gray, Series Editor, 2006.
6. J. Han and M. Kamber, “Data Mining: Concepts and Techniques.” Simon Fraser University, Morgan Kaufmann publishers, ISBN 1-55860-489-8. 2001.
7. S. T. Hijazi, and R.S.M.M. Naqvi, “Factors Affecting Student‟s Performance: A Case of Private Colleges,” Bangladesh e-Journal of Sociology, Vol. 3, No. 1, 2006.
8. Z. N. Khan, “Scholastic achievement of higher secondary students in science stream,” Journal of Social Sciences, Vol. 1, No. 2, pp. 84-87, 2005..
9. Z. J. Kovacic, “Early prediction of student success: Mining student enrollment data,” Proceedings of Informing Science & IT Education Conference 2010.
10. U. K. Pandey and S. Pal, “Data Mining: A prediction of performer or underperformer using classification,” (IJCSIT) International Journal of Computer Science and Information Technology, Vol. 2(2), 2011, 686-690, ISSN:0975-9646.
11. C. H. Yu, S. DiGangi, A. Jannasch-Pennell, W. Lo, and C. Kaprolet. “A data-mining approach to differentiate predictors of retention.” In the Proceedings of the Educause Southwest Conference, Austin, Texas, USA, 2007
12. ISU Student Handbook. “ISU and You”
AUTHOR’SPROFILE