Visualizing the Protein Sequence Universe
Larissa Stanberry
Bioinformatics & High-throughput Analysis Laboratory, Seattle Children’sResearch Institute (SCRI)
larissa.stanberry@
seattlechildrens.org
Roger Higdon
Bioinformatics & High-throughput AnalysisLaboratory, SCRI
Winston Haynes
Bioinformatics & High-throughput AnalysisLaboratory,SCRI
Natali Kolker
High-Throughput AnalysisCore, SCRI
William Broomall
High-Throughput AnalysisCore, SCRI
Saliya Ekanayake
School of Informatics and Computing and Pervasive Technology Institute, IndianaUniversity
ABSTRACT
Modern biology is experiencing a rapid increase of data vol-umes that challenges our analytical skills and existing cy-berinfrastructure. Exponential expansion of the Protein Se-quence Universe (PSU), a protein seSe-quence space, together with complexities of manual creation creates a major bottle-neck in a biomedical research which requires a fusion of novel analytical approaches and computational means. Compre-hensive visualization tool can be instrumental in meeting the need for functional annotation. Current existing resources lack scalable visualization tools to study the structure of the PSU. Here, we describe a multi-dimensional scaling (MDS) implementation to create a 3D embedding of the PSU. Ap-plying the method to the prokaryotic PSU shows that MDS is capable of preserving important grouping structure such as relative proximity of functionally similar clusters, and a clear structural separation between clusters with specific and general functions. We also discuss the merits of the method including its scalable implementation and its role as a protein annotation tool that could help alleviate major bottleneck issue in modern biology. In conclusions, we em-phasize the need for a transdisciplinary approach to quickly and efficiently translate the influx of new data into tangible innovations and long-awaited treatments.
Categories and Subject Descriptors
J.3 [Computer Applications]: Life and Medical Sciences— Biology and genetics; H.3.3 [Information Systems]: In-formation Storage and Retrieval—InIn-formation search and retrieval
Keywords
MapReduce, data-enabled science, computational bioinfor-matics, protein annotation, protein sequence universe, PSU, COG, UniRef, DELSA, multidimensional scaling, data vi-sualization, Needleman-Wunsch, BLAST, Azure, Sammon, Twister.
1.
INTRODUCTION
Functional annotation of newly sequenced genomes and meta-genomes is one of the principal challenges of modern biol-ogy. Rapidly advancing sequencing technologies generate peta- and even exa-scale data, exponentially expanding the PSU [51, 54, 15]. Assigning functions to this glut of newly sequenced proteins is an immense computational challenge that requires advanced analytical tools and scaling capabil-ities [58, 61, 50, 46, 45, 38, 36, 53, 35, 28, 37].
Surmounting the annotation challenge requires the ability to coherently display a vast amount of protein information. Currently, none of the existing resources provide interac-tive tools to visualize and analyze data across large sets of proteins. The analysis is typically done on the experiment level and in the context of known relationships, e.g. path-ways, complexes. Tools for pathway and network visualiza-tion (e.g. Ingenuity or Biobase) do not relate to sequence similarity or extend to the entire protein sequence universe. To map the proteins beyond their network or pathway, to estimate the mutual proximity of proteins identified in the experiment (with respect to sequence similarity, expression levels, structure, etc.) or to project the identified proteins into the subspace of interest require ample computational ef-fort. Clearly, such a resource-intensive approach is a major undertaking for individual laboratories.
domains [20, 47], protein families [33, 29, 41, 67, 40, 64].
Currently, functional annotation and analysis is done on a protein-by-protein basis that is tedious, time-consuming, and relies on a multitude of resources. While the ‘manual’ approach is feasible for a small group of proteins, it quickly becomes unsustainable as the volume of sequences expands [23, 7]. Given the scale of modern research studies, the inability to quickly and efficiently analyze protein sequence data creates an ever expanding backlog of un-annotated pro-teins [11, 39, 36, 35, 24].
A viable computational approach to functional annotation uses clustering to identify functionally similar groups of pro-teins [64, 29, 32, 67, 40, 38]. The cluster annotation can then be propagated to newly assigned uncharacterized proteins. In view of the exponential growth of data, this approach is computationally advantageous as it facilitates the annota-tion of large numbers of proteins.
To demonstrate the complexity of the protein functional an-notation task, we completed a first of a kind all-versus-all se-quence alignments for 9.9 million proteins in the UniRef100 database. The alignment was done on the Microsoft Win-dows Azure cloud system [18] with 475 eight-core virtual machines that produced over 3 billion filtered records in six days. Protein classification into functional groups was then performed using an innovative implementation of a single-linkage algorithm on a Hadoop compute cluster using Hive and the MapReduce paradigm [38]. Using the normalized alignment score, we have assigned 68% of 5.1 million bac-terial proteins into clusters in the Clusters of Orthologous Genes (COG) database [64]. The remaining proteins were classified into functional groups using Hive and custom jars implemented on top of Apache Hadoop utilizing the MapRe-duce paradigm. This implementation significantly reMapRe-duced the run time for non-indexed queries and optimized clus-tering performance. Consequently, nearly 2 million proteins were agglomerated into half a million functional groups. A similar approach was applied to 2.8 million eukaryotic se-quences from the UniRef100 [62], thereby expanding the eu-karyotic database by over 1 million proteins and producing 100,000 new functional groups.
The UniRef100 clustering project showcased both the promise and the challenges of protein annotation. It took the con-siderable efforts of a diverse group of researchers along with multiple cloud systems to successfully complete the task. Es-tablished open-source resources are struggling to cope with the influx of data as well and are either no longer supported [64, 41, 40] or have limited capabilities [29, 33]. All this highlights the pressing need of the biological community for a scalable and efficient computational approach to visualize, explore and assign functional annotations to new proteins.
Protein sequence annotation is an example of one of the grand challenges of modern biology that requires a focused, concentrated effort of experts from multiple scientific fields. In addition, the current funding climate severely limits the capabilities of any single research laboratory [27] thus com-pelling scientists to forge alliances and leverage skills across different disciplines [49]. This drive for collective innovation in data-enabled sciences translates into community efforts
such as DELSA, the Data-enabled Life Sciences Alliance. The goal of the newly founded transdisciplinary alliance is to create a synergy between the computer science and life sciences to tackle modern biological challenges through best computational practices and advanced cyberinfrastructure [49, 38, 37].
In this paper, we propose using an MDS approach to create a 3D embedding of the PSU [10]. The parallel implementa-tion on a multigrid platform utilizes Iterative MapReduce, the standard Message Passing Interface (MPI), and thread-ing. The MDS representation provides an advanced visual representation of the PSU. Furthermore, the scalable im-plementation allows for efficient mapping and annotation of newly sequenced data.
In what follows, we describe the method to create a 3D ren-dering of 100,000 sequences from the prokaryotic PSU. We briefly describe the data and outline the MDS implementa-tion. The resulting 3D representation is given in the Results section. We then discuss the application and merits of the proposed approach to the functional annotation of new pro-tein data.
2.
MATERIALS AND METHODS
2.1
COG Database
A major principle of molecular evolution is that function-ally important proteins tend to be conserved across species. Clusters of Orthologous Groups of proteins (COGs) was a project by the National Center for Biotechnology Informa-tion (NCBI) [64]. The project constructed clusters of pro-teins from 66 prokaryotic and seven eukaryotic genomes. For each protein, the best aligned protein in every other genome was determined using a sequence similarity search [2]. If three proteins from three organisms were mutual best hits, they created a triple. COGs are the result of exhaustive, successive merging of triples with two common members. Manual curation of the clusters was done by experts to en-sure correct grouping and functional annotations. The COG database is separated into COGs for prokaryotic genomes and KOGs for eukaryotic genomes [63, 64]. In this paper, we are using the COG database of prokaryotic genomes that we will refer to as COGs.
2.2
UniRef Database
UniRef is composed of the distinct databases UniRef100, UniRef90, and UniRef50, which have 100%, 90%, and 50% sequence similarity, respectively, within protein clusters and reduce the UniProt database size by approximately 10%, 40%, and 70%, respectively. Each cluster contains one refer-ence sequrefer-ence and all proteins within the similarity thresh-old to the reference. UniRef retains annotation from all members of the protein cluster to prevent information loss [6, 62].
2.3
Multi-Dimensional Scaling
The MDS algorithm was used to project the protein se-quence similarity data into a low-dimensional space [14, 42]. The method has anO(n2) computational complexity to map
In this paper, we used Sammon’sχ2 optimization [57] with
an objective function
H=
n X
i,j=1
i<j
(f(δij)−d(xi, xj))2
f(δij)
, (1)
where δij is the dissimilarity measure between sequences i
and j and d is the Euclidean distance between the corre-sponding 3D projectionsxiandxj. Functionfin equation
(1) is a monotone transformation of dissimilarity measure. The denominator term in (1) ensures a larger contribution from smaller dissimilarities thus making the clustering struc-ture of the data more apparent. We used a highly robust implementation of the nonlinearχ2 minimization with
Lev-enberg - Marquardt algorithm to regularize Newton’s equa-tions [44].
The transformationf is chosen heuristically to increase the ratio of standard deviation to mean forf(δij) and to increase
the range of dissimilarity measures. For example, if f is an identity, the high dimensional data will essentially be projected onto the surface of 3D structure, which lowers the utility of the mapping.
2.4
Implementation
We used a scaling, parallel traditional MPI with thread-ing intranode for MDS implementation [21]. In the Reduce phase of MapReduce, we used Twister, a MapReduce exten-sion to support more efficient and broader range of commu-nication collectives (including reduce, gather and broadcast in an MPI language) [66, 68, 16]. In Twister, all communica-tion avoids using intermediate disk and is built around Ac-tiveMQ, an Apache publish-subscribe environment, in Java Twister and around Azure primitives in the Microsoft cloud.
The method was applied to obtain a three dimensional pro-jection of 100,000 sequences from well-characterized COGs in prokaryotic PSU. Pairwise distances were calculated using an MPI implementation of the Needleman-Wunsch (NW) alignment algorithm. The NW algorithm was realized by a parallel computation on the 24-core node system. The ef-ficiency of the parallel distance computation was less than that of MDS due to saturation of memory bandwidth.
Further, we applied a monotone square-root transformation to the pairwise NW distances [34]. To map the data into a 3D Euclidean space, we fed the transformed distances into an MPI implementation of theχ2 MDS. The resulting 3D
projection were visualized in PlotViz [56]. The calculations were performed on a 768 core Microsoft HPC cluster.
The NW distance calculation required one day to complete and the MDS job ran for three days. The parallel efficiency of the code was approximately 70% based on earlier studies that discuss both the inter-node and intra-node cases and find that it is essential to adopt a hybrid model with intra-node threading and MPI between intra-nodes [21, 52, 22]. The transformation was chosen heuristically to reduce the for-mal dimension of distance data (in this case, from 244 with originalδijto 14 forf(δij) after mapping), which allows for
a more uniform coverage of the target Euclidean space by the MDS projections.
3.
RESULTS
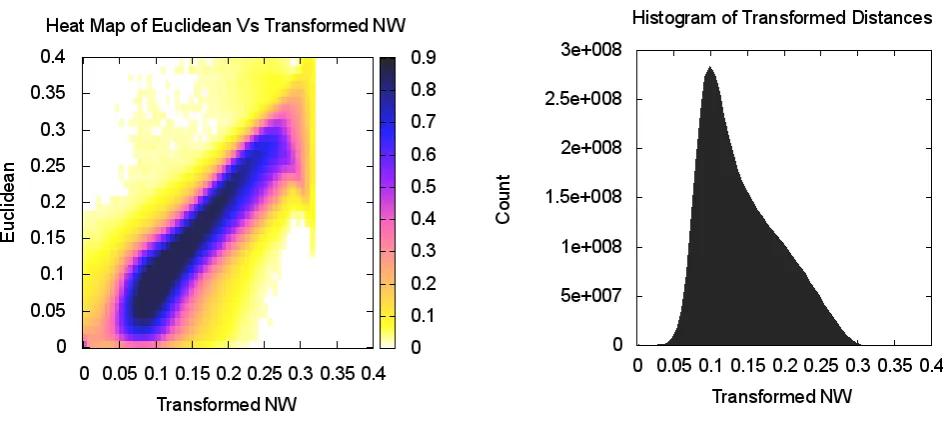
Figure 1 shows the 3D embedding of the prokaryotic PSU. Each point represents a particular sequence. The figure shows the complexity of the PSU and the presence of dis-tinct grouping structure. There is a strong correlation be-tween the NW distances and the distances based on MDS projections as illustrated by high intensity values along the diagonal in Figure 5, left. The histogram of NW distances in Figure 5 shows a lack of spatial separation between the clusters. The excess of points with mapped distances less than original values can be traced to equation (1) where denominator depends on the original rather than mapped distance.
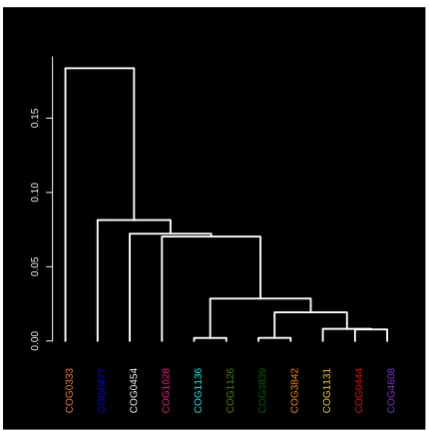
For the eleven color-coded COG clusters in Figure 1, we computed the centroids from their respective MDS projec-tions. The dendrogram tree in Figure 3 shows a relative proximity of the clusters to each other. Out of the eleven selected clusters, COG1131 (yellow) and COG1136 (cyan) are the tightest with respect to the mean intra-cluster dis-tance. These two clusters are a part of a group that includes seven COGs in all; see right branch of the dendrogram. The other four COGs 1028, 0333, 0477, 0454 appear to be less similar to these group of seven or to each other.
0.00
0.05
0.10
0.15
MDS distance
COG1131
COG1136 COG1126 COG3839 COG3842 COG0444 COG4608
COG0454
COG0477
[image:3.595.329.544.347.563.2]COG0333 COG1028
Figure 3: The dendrogram tree of the cluster cen-troids. The cluster labels are color-coded as in Fig-ure 1.
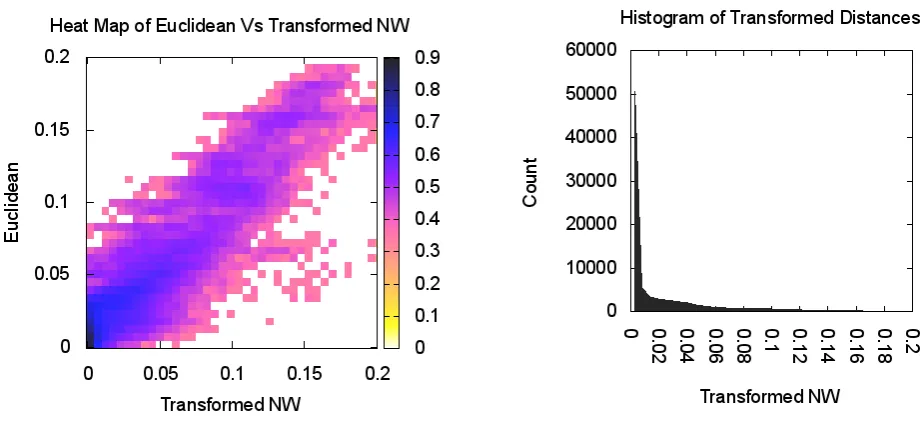
The magnified view in Figure 4 details the neighborhood structure of the COG1131 and COG1136 showing five more COGs lying in close proximity. Remarkably, all seven clus-ters are functionally similar and correspond to ABC-type transport system, ATPase component (see Table 1). The heatmap shows a good agreement between the NW distances and MDS projections; see Figure 4.
pro-Figure 1: MDS representation of the 100,000 sequences from well-characterized COGs in prokaryotic PSU. Each point represents a protein sequence. Eleven COG clusters were color-coded as marked in the legend. The number of proteins in each cluster is given in parentheses.
[image:4.595.75.524.68.335.2] [image:4.595.66.538.442.653.2]Figure 4: Magnified version of the prokaryotic PSU showing the seven functionally similar COG clusters.
[image:5.595.64.526.440.654.2]tein groups. While some clusters are rather tight, others are scattered throughout a sizeable domain. For example, com-pare the tight COG0333 cluster of ribosomal protein L32 with the diffuse COG0454 (HPA2) and COG0477 (Perme-ases of the major facilitator superfamily); see also Table 1.
From the biological standpoint, this spatial distinction con-forms well with clusters’ functionality. For example, a tight COG3839 cluster contains 142 proteins sequences of the sugar transport systems that are similar both in function and composition. Similarly, COG1126 of the polar amino acid transport system proteins with very specific functions appears as a very tight cluster. In turn, COG1131 is fairly diffuse as it combines 244 multidrug transport system pro-teins that differ in the amino acid composition and func-tional mechanisms. The similarity between different clus-ters is reflected by the distance that separates them. For example, the two oligopeptide transport systems, COG4608 and COG0444, have similar shape and are located in close proximity to one another.
As mentioned, in our previous work, we used all-versus-all alignment of 10 million UniRef100 proteins to populate the existing COG clusters [38]. The last column in Table 1 shows the number of UniRef100 proteins added to each of the eleven clusters from Figure 1. Notably the most diffuse clusters were expanded most.
4.
DISCUSSION
Functional protein annotation is one of the most important and resource-intensive challenges in biology [7] Rapid in-flux of data from newly sequenced genomes together with the limited number of annotation experts creates a major bottleneck stalling scientific advances. The number of se-quenced genomes is only poised to increase in the next five years. The Earth Microbiome Project alone is expected to sequence 500,000 microbial genomes, which will contain on the order of 1.5 billion protein sequences and half a tril-lion amino acids [15]. This is well over a 100 fold increase in the number of sequenced microbial genomes and pro-teins currently contained in GenBank. The i5K Insect and other Arthropod Genome Sequencing Initiative plans to se-quence the genomes of 5,000 insects and related species over the next five years, yielding nearly 100 million new protein sequences [54]. Assigning functions to this glut of newly sequenced proteins is an immense computational challenge that requires innovative approaches with advanced analytic and scaling capabilities.
In this paper, we used the NW algorithm for sequence align-ment. It will be of interest to compare NW to alternative dissimilarity measures such as BLAST and Smith Waterman Gotoh [2, 60, 25]. The MDS implementation used here in-corporated deterministic annealing into the EM approach, achieving significantly better results with little increase in execution time [34]. Note that the MDS method is not re-stricted to protein sequences and can be readily adapted to other types of biological data. In addition, the newly devel-oped MDS interpolation methods allow a quick mapping of sequences into the existing projection space. The interpola-tion runs inO(n) time after an initial MDS embedding with theO(n2) approach [4].
The example of the COG data demonstrates that MDS can be effectively used to create a comprehensive 3D projection of the PSU while preserving the fundamental grouping struc-ture. The 3D mapping of the protein space allows interactive exploratory data analysis that is a mandatory precursor to statistical modeling and comparisons. The projection pro-vides a unique perspective on the organization of protein space that so far had been largely described by volumes of summary statistics. The low-dimensional representation can be further used to integrate protein data together with infor-mation on function, pathways, structure, etc. and perform the analysis across domains of interest. Furthermore, the proposed implementation is scalable and would allow for the incorporation of large volumes of data at a minimum cost.
The proposed visualization method could be instrumental in enabling prompt and reliable annotation and characteriza-tion of newly sequenced proteins. For example, the UniRef mapping resulted in 70-fold increase in the size of clusters. Clearly, the manual curation of new clusters is a daunting task. By inspecting the expanded universe, one could iden-tify specific features within each cluster and use them to verify the annotations.
The challenges associated with the functional annotation of newly sequenced genomes cannot be solved by the life sci-ences community alone. A successful and sustainable solu-tion requires a new trans-disciplinary approach that would leverage and adopt most prominent advances of modern sci-ences. This turn to collective innovation in data-enabled sciences is essential for truly ground-breaking medical dis-coveries and advances that may benefit public health. Sci-entific alliances like DELSA stand to harness the diversity of skills and expertise, quickly and efficiently translating the in-flux of new data into tangible innovations and long-awaited treatments [49, 37].
5.
ACKNOWLEDGEMENTS
We would like to thank Elizabeth Stewart, Christopher Moss, Courtney MacNealy-Koch, Maggie Lackey and Randy Sala-mon for their comments and help with this manuscript. This work was made possible by the support from NSF (under DBI: 0969929) and NIH (NIGMS grant R01 GM-076680-04; NIDDK grants U01-DK-089571 and U01-DK-072473).
6.
ADDITIONAL AUTHORS
Additional authors: Yang Ruan (School of Informatics and Computing and Pervasive Technology Institute, Indiana Uni-versity Bloomington,[email protected]); Judy Qiu (School of Informatics and Computing and Pervasive Technology
In-stitute, Indiana University Bloomington, DELSA,[email protected]); Eugene Kolker (Bioinformatics & High-throughput Analysis
Laboratory, SCRI; High-throughput Analysis Core, SCRI; Predicitive Analytics, SCRI; Departments of Pediatrics and Medical Education & Biomedical Informatics, University;
DELSA, founder and co-chair of the executive [email protected]); and Geoffrey Fox (School of Informatics and Computing and
Pervasive Technology Institute; DELSA, co-chair of the op-erations committee,[email protected])
7.
REFERENCES
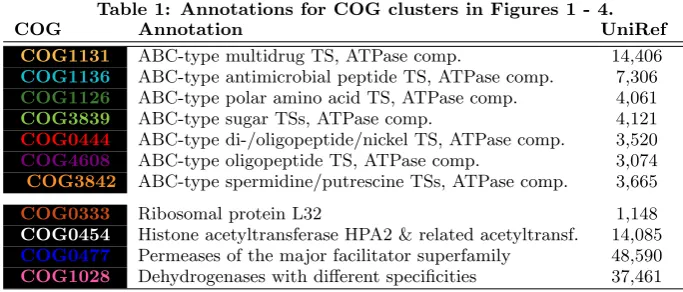
Table 1: Annotations for COG clusters in Figures 1 - 4.
COG Annotation UniRef
COG1131 ABC-type multidrug TS, ATPase comp. 14,406
COG1136 ABC-type antimicrobial peptide TS, ATPase comp. 7,306
COG1126 ABC-type polar amino acid TS, ATPase comp. 4,061
COG3839 ABC-type sugar TSs, ATPase comp. 4,121
COG0444 ABC-type di-/oligopeptide/nickel TS, ATPase comp. 3,520
COG4608 ABC-type oligopeptide TS, ATPase comp. 3,074
COG3842 ABC-type spermidine/putrescine TSs, ATPase comp. 3,665
COG0333 Ribosomal protein L32 1,148
COG0454 Histone acetyltransferase HPA2 & related acetyltransf. 14,085
COG0477 Permeases of the major facilitator superfamily 48,590
COG1028 Dehydrogenases with different specificities 37,461
2010, Melbourne, Victoria, Australia. IEEE, 2010. [2] S. F. Altschul, W. Gish, W. Miller, E. W. Myers, and
D. J. Lipman. Basic local alignment search tool.J. Mol. Biol., 215:403–410, Oct 1990.
[3] S. F. Altschul, T. L. Madden, A. A. Schaffer, J. Zhang, et al.. Gapped BLAST and PSI-BLAST: a new generation of protein database search programs. Nucleic Acids Res., 25:3389–3402, Sep 1997.
[4] S.-H. Bae, J. Y. Choi, J. Qiu, and G. Fox. Dimension reduction and visualization of large high-dimensional data via interpolation. In Hariri and Keahey [26], pages 203–214.
[5] T. L. Bailey, M. Boden, F. A. Buske, M. Frith, et al.. MEME SUITE: tools for motif discovery and
searching.Nucleic Acids Res., 37:W202–208, Jul 2009. [6] A. Bairoch, R. Apweiler, C. H. Wu, W. C. Barker, et
al.. The Universal Protein Resource (UniProt). Nucleic Acids Res., 33:D154–159, Jan 2005. [7] W. A. Baumgartner, K. B. Cohen, L. M. Fox,
G. Acquaah-Mensah, and L. Hunter. Manual curation is not sufficient for annotation of genomic databases. Bioinformatics, 23:i41–48, Jul 2007.
[8] D. A. Benson, I. Karsch-Mizrachi, K. Clark, D. J. Lipman, et al.. GenBank.Nucleic Acids Res., 40:48–53, Jan 2012.
[9] F. C. Bernstein, T. F. Koetzle, G. J. Williams, E. F. Meyer, et al.. The Protein Data Bank: a
computer-based archival file for macromolecular structures.J. Mol. Biol., 112:535–542, May 1977. [10] I. Borg and P. Groenen.Modern Multidimensional
Scaling: Theory and Applications. Springer, 2005. [11] P. Bork. Powers and pitfalls in sequence analysis: the
70% hurdle.Genome Res., 10:398–400, Apr 2000. [12] R. Caspi, T. Altman, J. M. Dale, K. Dreher, et al..
The MetaCyc database of metabolic pathways and enzymes and the BioCyc collection of
pathway/genome databases.Nucleic Acids Res., 38:D473–479, Jan 2010.
[13] J. Y. Choi, S.-H. Bae, X. Qiu, and G. Fox. High performance dimension reduction and visualization for large high-dimensional data analysis. InCCGRID [1], pages 331–340.
[14] J. de Leeuw. Applications of convex analysis to multidimensional scaling. In J. Barra, F. Brodeau, G. Romier, and B. V. Cutsem, editors,Recent
Developments in Statistics, pages 133–146. North Holland Publishing Company, Amsterdam, 1977. [15] Earth Microbiome Project.
http://www.earthmicrobiome.org/
[16] J. Ekanayake, H. Li, B. Zhang, T. Gunarathne, et al.. Twister: a runtime for iterative mapreduce. In Hariri and Keahey [26], pages 810–818.
[17] N. Eswar, B. Webb, M. A. Marti-Renom, M. S. Madhusudhan, et al.. Comparative protein structure modeling using Modeller.Curr Protoc Bioinformatics, Chapter 5:Unit 5.6, Oct 2006.
[18] Microsoft eXtreme Computing Group. NCBI BLAST on Windows Azure, 2011.
http://research.microsoft.com/en-us/projects/azure/azureblast.aspx
[19] R. D. Finn, J. Clements, and S. R. Eddy. HMMER web server: interactive sequence similarity searching. Nucleic Acids Res., 39:29–37, Jul 2011.
[20] R. D. Finn, J. Tate, J. Mistry, P. C. Coggill, et al.. The Pfam protein families database.Nucleic Acids Res., 36:D281–288, Jan 2008.
[21] G. Fox, S.-H. Bae, J. Ekanayake, X. Qiu, and H. Yuan. Parallel data mining from multicore to cloudy grids. In W. Gentzsch, L. Grandinetti, and G. R. Joubert, editors,High Performance Computing Workshop, volume 18 ofAdvances in Parallel Computing, pages 311–340. IOS Press, 2008. [22] G. Fox, X. Qiu, S. Beason, J. Y. Choi, et al..
Biomedical case studies in data intensive computing. In M. G. Jaatun, G. Zhao, and C. Rong, editors, CloudCom, volume 5931 ofLecture Notes in Computer Science, pages 2–18. Springer, 2009.
[23] D. Frishman. Protein annotation at genomic scale: the current status.Chem. Rev., 107:3448–3466, Aug 2007. [24] M. Y. Galperin and E. Kolker. New metrics for
comparative genomics.Curr. Opin. Biotechnol., 17:440–447, Oct 2006.
[25] O. Gotoh. An improved algorithm for matching biological sequences.J. Mol. Biol., 162:705–708, Dec 1982.
et al. The United States of America and scientific research.PLOS ONE, 5(8):e12203, 2010.
[28] R. Higdon, B. Louie, and E. Kolker. Modeling sequence and function similarity between proteins for protein functional annotation. InHPDC ’10
Proceedings of the 19th ACM International Symposium on High Performance Distributed
Computing, ACM Digital Library, pages 499–502, New York City, NY, 2009.
[29] L. J. Jensen, P. Julien, M. Kuhn, C. von Mering, et al.. eggNOG: automated construction and annotation of orthologous groups of genes.Nucleic Acids Res., 36:D250–254, Jan 2008.
[30] M. Kanehisa, S. Goto, S. Kawashima, Y. Okuno, and M. Hattori. The KEGG resource for deciphering the genome.Nucleic Acids Res., 32:D277–280, Jan 2004. [31] A. J. Kearsley, R. A. Tapia, and M. W. Trosset. The
solution of the metric stress and sstress problems in multidimensional scaling using Newton’s method, 1995.
[32] P. Kersey, D. Lonsdale, N. J. Mulder, R. Petryszak, and R. Apweiler. Building a biological space based on protein sequence similarities and biological ontologies. Comb. Chem. High Throughput Screen., 11:653–660, Sep 2008.
[33] W. Klimke, R. Agarwala, A. Badretdin, S. Chetvernin, et al.. The National Center for Biotechnology Information’s Protein Clusters
Database.Nucleic Acids Res., 37:D216–223, Jan 2009. [34] H. Klock. Data visualization by multidimensional
scaling: a deterministic annealing approach.Pattern Recognition, 33(4):651–669, 2000.
[35] E. Kolker, K. S. Makarova, S. Shabalina, A. F. Picone, et al.. Identification and functional analysis of
‘hypothetical’ genes expressed in Haemophilus influenzae.Nucleic Acids Res., 32:2353–2361, 2004. [36] E. Kolker, S. Purvine, M. Y. Galperin, S. Stolyar, et
al.. Initial proteome analysis of model microorganism Haemophilus influenzae strain Rd KW20.J.
Bacteriol., 185:4593–4602, Aug 2003.
[37] E. Kolker, E. Stewart, and V. Ozdemir. Opportunities and challenges for the life sciences community. OMICS, 16(3):in press, 2012.
[38] N. Kolker, R. Higdon, W. Broomall, L. Stanberry, et al.. Classifying proteins into functional groups based on all-versus-all BLAST of 10 million proteins. OMICS, 15:513–521, 2011.
[39] E. Koonin and M. Galperin.Sequence evolution -function: computational approaches in comparative genomics. Kluwer Academic, 2003.
[40] A. Krause, J. Stoye, and M. Vingron. The SYSTERS protein sequence cluster set.Nucleic Acids Res., 28:270–272, Jan 2000.
[41] E. V. Kriventseva, W. Fleischmann, E. M. Zdobnov, and R. Apweiler. CluSTr: a database of clusters of SWISS-PROT+TrEMBL proteins.Nucleic Acids Res., 29:33–36, Jan 2001.
[42] J. Kruskal. Multidimensional scaling by optimizing goodness of fit to a nonmetric hypothesis.
Psychometrika, 29(1):1–27, 1964.
[43] J. Leeuw. Convergence of the majorization method for
multidimensional scaling.Journal of Classification, 5(2):163–180, September 1988.
[44] K. Levenberg. A method for the solution of certain non-linear problems in least squares.Quarterly Journal of Applied Mathmatics, II(2):164–168, 1944. [45] B. Louie, S. Bergen, R. Higdon, and E. Kolker.
Quantifying protein function specificity in the gene ontology.Stand Genomic Sci, 2:238–244, 2010. [46] B. Louie, R. Higdon, and E. Kolker. A statistical
model of protein sequence similarity and function similarity reveals overly-specific function predictions. PLoS ONE, 4:e7546, 2009.
[47] A. Marchler-Bauer, S. Lu, J. B. Anderson, F. Chitsaz, et al.. CDD: a Conserved Domain Database for the functional annotation of proteins.Nucleic Acids Res., 39:D225–229, Jan 2011.
[48] L. Matthews, G. Gopinath, M. Gillespie, M. Caudy, et al.. Reactome knowledgebase of human biological pathways and processes.Nucleic Acids Res., 37:D619–622, Jan 2009.
[49] V. Ozdemir, D. Rosenblatt, L. Warnich, and S. e. a. Srivastava. Towards an ecology of collective
innovation: Human Variome Project, Rare Disease Consortium for Autosomal Loci and Data-Enabled Life Sciences Alliance.Current Pharmacogenomics and Personalized Medicine, 9(4):1–9, 2011.
[50] E. Pennisi. Human genome 10th anniversary. Will computers crash genomics? Science, 331:666–668, Feb 2011.
[51] L. M. Proctor. The Human Microbiome Project in 2011 and beyond.Cell Host Microbe, 10:287–291, Oct 2011.
[52] J. Qiu and S.-H. Bae. Performance of Windows multicore systems on threading and MPI. Concurrency and Computation: Practice and Experience, 24(1):14–28, 2012.
[53] A. Raghunathan, N. D. Price, M. Y. Galperin, K. S. Makarova, et al.. In Silico Metabolic Model and Protein Expression of Haemophilus influenzae Strain Rd KW20 in Rich Medium.OMICS, 8:25–41, 2004. [54] G. E. Robinson, K. J. Hackett,
M. Purcell-Miramontes, S. J. Brown, et al.. Creating a buzz about insect genomes.Science, 331:1386, Mar 2011.
[55] A. Roy, A. Kucukural, and Y. Zhang. I-TASSER: a unified platform for automated protein structure and function prediction.Nat Protoc, 5:725–738, 2010. [56] SALSA group, Indiana University. PlotViz: a tool for
visualizing large and high-dimensional data.
http://www.iterativemapreduce.org/
[57] J. W. Sammon. A nonlinear mapping for data structure analysis.IEEE Trans. Comput., 18:401–409, 1969.
[58] M. C. Schatz, B. Langmead, and S. L. Salzberg. Cloud computing and the DNA data race.Nat. Biotechnol., 28:691–693, 2010.
[60] T. F. Smith and M. S. Waterman. Identification of common molecular subsequences.J. Mol. Biol., 147:195–197, Mar 1981.
[61] L. D. Stein. The case for cloud computing in genome informatics.Genome Biol., 11:207, 2010.
[62] B. E. Suzek, H. Huang, P. McGarvey, R. Mazumder, and C. H. Wu. UniRef: comprehensive and
non-redundant UniProt reference clusters. Bioinformatics, 23:1282–1288, May 2007.
[63] R. Tatusov, E. Koonin, and D. Lipman. A genomic perspective on protein families.Science, 278:631–637, 1997.
[64] R. L. Tatusov, N. D. Fedorova, J. D. Jackson, A. R. Jacobs, et al.. The COG database: an updated version includes eukaryotes.BMC Bioinformatics, 4:41, Sep 2003.
[65] P. D. Thomas, A. Kejariwal, M. J. Campbell, H. Mi, et al.. PANTHER: a browsable database of gene products organized by biological function, using curated protein family and subfamily classification. Nucleic Acids Res., 31:334–341, Jan 2003.
[66] J. D. Thompson, D. G. Higgins, and T. J. Gibson. CLUSTAL W: improving the sensitivity of progressive multiple sequence alignment through sequence weighting, position-specific gap penalties and weight matrix choice.Nucleic Acids Res., 22:4673–4680, 1994. [67] G. Yona, N. Linial, and M. Linial. ProtoMap:
automatic classification of protein sequences and hierarchy of protein families.Nucleic Acids Res., 28:49–55, Jan 2000.