International Journal of Innovative Technology and Exploring Engineering (IJITEE) ISSN: 2278-3075,Volume-8, Issue-11, September 2019
Abstract: Data mining and prediction systems have been the center of attraction since information retrieval came into existence. Most IT companies spend a lot of resources on such analysis and systems to improve their performance and generate more revenue depending on the nature of work that they do. Online News Feed Prediction System aims to provide an analysis and comparison of various prediction techniques by using different methods of implementation. UCI repository contains a collection of databases pertaining to different topics. News popularity in multiple social media is one such dataset containing information about news topics from different sources, sentiment analysis of title and headline, topic that they are related to, publishing date, popularity score in various social media platforms. Python, R and Weka have been used on this data set to implement data preprocessing, visualization and prediction techniques like Random Forest, Decision Tree and SVM. Moreover, there is dataset on the analysis of the score for every twenty minutes for the social media platforms chosen. Analysis on these platforms helps in developing a system to reach a wider audience. News agencies can use this system to increase their profit and visibility. This paper aims to realize the ways to obtain these results.
Index Terms: online social network, news analysis, news feed, prediction, trends, data mining
I. INTRODUCTION
Daily news is essential for a large part of the population. With the advent of social media, access to news has become a lot easier and one can view news from various sources at a single place. A great amount of money is spent on the projects that help to know more about trends on the social media, and the content that gets the maximum viewers. Recording events such as news trends is an activity of great importance. With the growth of science and research work, there is an ever-increasing demand to collect the data, and process it to get vital information. News agencies use different social media platforms and news topics to reach their audience. These platforms help them to reach the audience and understand topics that are more popular for future reference. This paper aims to know about how popularity of news items’ changes with time and how it is different for different media platforms. It also gives the sentiment scores of the headline and title which helps in determining the more trending news.The rest of the paper is organized as follows: The background theory is discussed in section II, details of data collection is given in section III, Revised Manuscript Received on September 03, 2019
Arpit Garg , software developer at Temenos India Pvt Ltd, Bangalore, India.
Poornalatha G,Associate Professor in the Dept. of Information and Communication Technology, MIT, Manipal, India.
data preprocessing is explained in section IV, the result analysis for news is presented in section V, prediction done is detailed in section VI, conclusions are described in section VII followed by the references at the end.
II. BACKGROUNDTHEORY
People are becoming more interested in and relying on social network for information, news and opinion of other users on diverse subject matters. The heavy reliance on social network sites causes them to generate massive data characterized by three computational issues namely; size, noise and dynamism. These issues often make social network data very complex to analyze manually, resulting in the pertinent use of computational means of analyzing them [1]. There is an urgent need for a new generation of computational theories and tools to assist humans in extracting useful information (knowledge) from the rapidly growing volumes of digital data. These theories and tools are the subject of the emerging field of knowledge discovery in databases [2]. Cosmin et al. [3] considered platform like twitter [13-14] and created an aggregator based on the newsfeed which works online. Shankar et al. [4] classified news feeds into different groups to improve the data illustration. The authors of [5] experimented with the samples of news feed by using clustering technique.
Random Forest (RF) is an ensemble, supervised machine learning algorithm [6-8]. Decision tree learning is a typical inductive algorithm based on instance, which focus on classification rules displaying as decision trees inferred from a group of disorder and irregular instance [9]. Several recent studies have reported that the SVM (support vector
machines) generally can deliver higher performance in terms of classification accuracy than the other data classification algorithms [10].
Online News Feed Data Mining and Prediction
[image:1.595.321.569.553.715.2]Arpit Garg , Poornalatha G
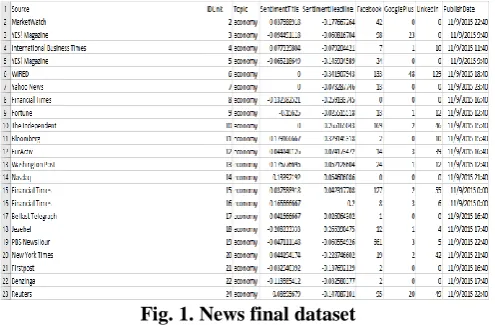
Fig. 1. News final dataset
In this paper the random forest classifier, decision tree and support vector machine have been considered for prediction purpose.
III. DATACOLLECTION
A. News Final Data Set
The dataset of UCI repository, about the different social media handles and their popularity in news on certain topics, is considered for the experimental purpose as shown in Fig.1. It contains news-related data concerning four topics: Economy, Microsoft, Obama, and Palestine. These topics were chosen ad-hoc, based on two factors: their worldwide popularity and constant activity, and the fact that they report to different types of entities (sector, company, person, and country, respectively). The data set [11] contains sentimental scores of News title and News headline and its score on Facebook, Google+ and LinkedIn. In this data set, the process to obtain these sentiment scores was carried out by applying the framework of the qdap R package with default parametrization. [11]
B. Social Feedback Dataset
This dataset contains popularity scores of each social media handle for every twenty minutes on the news articles. The data was collected on a span of two days on the topic Economy. To calculate popularity scores for Facebook, the Facebook Graph API5 is used, by querying for information concerning the URL of each news item. The data retrieved reports the number of shares concerning each unique URL, which is used as a popularity measure. Google+ does not allow to obtain the number of shares of a given URL, due to technical restrictions. Nonetheless, it allows one to check the number of times users have ”liked” the URL’s. Despite the differences with other social media sources, it is nonetheless a valid metric of received attention by news stories. This process is carried out by querying a public end-point6 in order to obtain the amount of ”+1” (similar to ”like” in Facebook) a given URL received. Concerning the LinkedIn platform, the number of times each news story URL was shared is obtained by querying its public end-point7, designed for such purposes. [11]
Fig.2, Fig.3, and Fig.4 shows the popularity scores on
Facebook, GooglePlus, and LinkedIn respectively, for twenty-minute interval.
C. Methodology
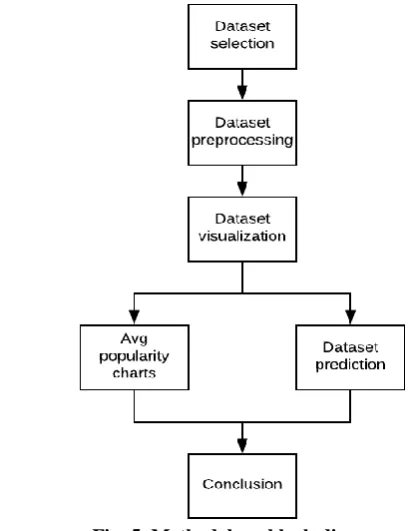
The block diagram shown in Fig.5 describes the methodology used in this paper. To get better representation of data, the data is preprocessed by removing unwanted data entry. For this purpose, Python language has been used and
functions like OneHotEncoder and qcut have been used using
libraries like preprocessing and pandas respectively, for
News final dataset. For News feedback dataset, average popularity for each time instance is calculated using the popularity scores of all the news articles and three separate datasets are formed. Weka, R and Python have been used to create graphs to get a better view of data and convert it to meaningful information. Graphs include q-q plot, box plot, timeline to name a few. These graphs help to look at trends and patterns in data. Apart from this, graphs can be used for comparison purpose, to find outliers and to understand how the data is interrelated. This is used for prediction and to look for behavior of different social media platforms. Various classifiers used for prediction are
Random Forest, Decision Tree and Fig. 2. Facebook feedback dataset
[image:2.595.315.568.54.321.2][image:2.595.317.523.345.611.2]
Fig. 3. GooglePlus feedback dataset
Fig. 4. LinkedIn feedback dataset
International Journal of Innovative Technology and Exploring Engineering (IJITEE) ISSN: 2278-3075,Volume-8, Issue-11, September 2019
SVM.
IV. DATAPREPROCESSING
For obtaining results of higher accuracy it is important to preprocess data and alter it according to the computation that needs to be done on it.
A. News Final Dataset
First, unwanted columns like, Source and Publish Date are removed as they are unique for every tuple and are of no use to the current work. The categorical data ‘Topic’ is converted to nominal data 0 for ‘economy’, 1 for ‘microsoft’, 2 for ‘obama’, and 3 for ‘palestine’ for the four major topics using
pandas qcut. The attributes ’SentimentTitle’ and ‘SetimentHeadline’ were continuous and are transformed to
discreet bins (-1, 0, 1). The preprocessed data is saved as a csv file for further use. ‘Topic’ column in the original data has also been converted to nominal form of 0 and 1 by converting ‘Topic’ into four columns and saved as a separate csv file.
B. Social Feedback Dataset
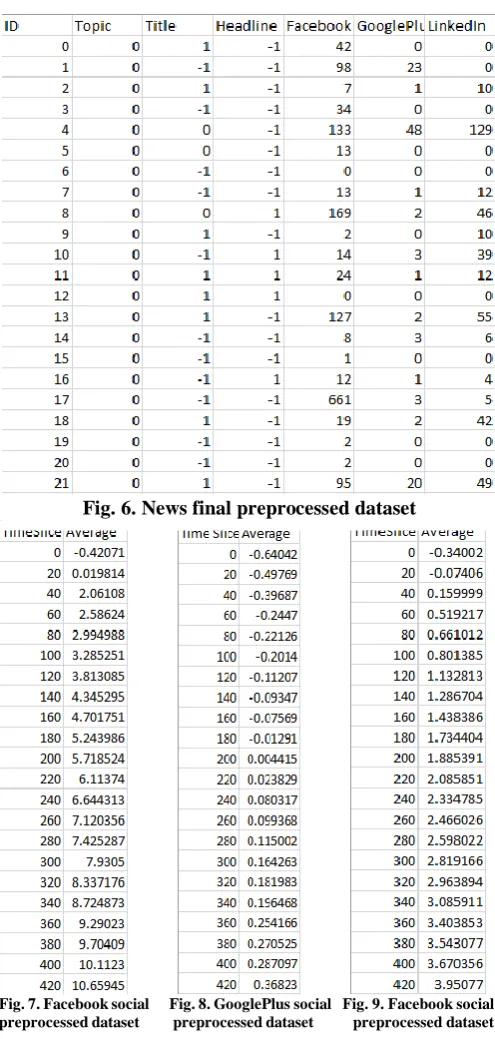
The datasets shown in Fig.7, Fig.8, and Fig.9 depicts the preprocessed dataset of facebook, googleplus and linkedin. Where ‘TimeSlice’ is the twenty minute time interval over a duration of two days and ‘Average’ is the average of scores shown in Fig.2, Fig.3 and Fig.4 for that interval.
V. NEWSANALYSIS
A. News Final Dataset
The graph in Fig.10 shows the topic wise distribution of new articles in the given data set. From this graph it is observed that, the greatest number of articles have been on Economy and least have been on Palestine. This helps to see a trend of news in a particular topic. This also shows that it might be due to readers’ interest in that topic or its popularity during that time.
The average of popularity scores is calculated for each of the topic based on its title sentiment. For example, if the topic is economy then on Facebook the average popularity score for positive sentiment of title is 37. Same is calculated for other topics and social media platforms as shown in Fig.11.
The average of popularity scores is calculated for each of the topic based on its title sentiment. For example, if the topic
is economy then on Facebook the average popularity score for positive sentiment of headline is 43. Same is calculated for other topics and social media platforms as shown in Fig.12.
B. News Feedback Dataset
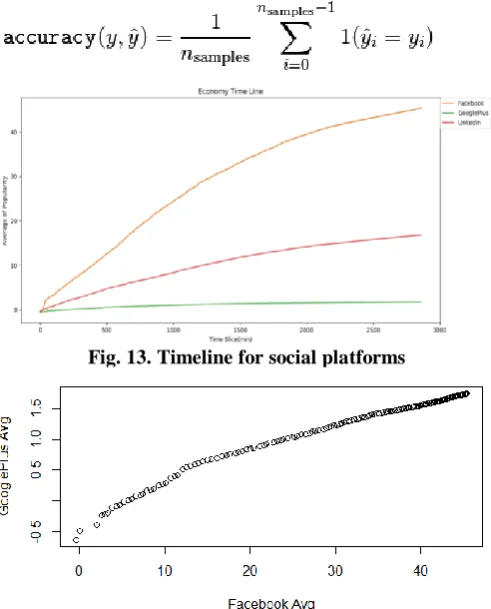
Fig.13 shows the plot of Time Slice Vs Average of Popularity for Facebook, Google Plus and LinkedIn, the data for the same can be seen in Fig.7, Fig. 8, and Fig. 9. The plot shows that the popularity measures for Facebook increase more rapidly than they do for others, while the least amount of increase can be seen in GooglePlus. This shows that the popularity for news items o Facebook increased by more than forty times of that
[image:3.595.45.293.214.734.2]
Fig. 7. Facebook social Fig. 8. GooglePlus social Fig. 9. Facebook social preprocessed dataset preprocessed dataset preprocessed dataset
[image:3.595.323.542.436.592.2]
Economy Microsoft Obama Palestine Fig. 10. Topic distribution
of GooglePlus and more than ten times than that of LinkedIn in a span of two days.
Fig.14 and Fig.15 show that the quantile-quantile plots for Facebook-GooglePlus and Facebook-LinkedIn are a normal distribution as they give an almost straight line.
Fig. 16 shows that the plot for GooglePlus and LinkedIn is right skewed as the line of points is towards right side of the graph. Metrics used in Fig.14, Fig.15 and Fig.16 are the average popularity scores calculated in Fig.7, Fig.8 and Fig.9.
Fig.17, Fig.18 and Fig.19 show the Box Plot for Facebook, GooglePlus and LinkedIn Economy data. The length of upper whisker for all the graphs are less than the lower whisker, this shows that top 75% of the popularity score values are closer to each other as compared to the lower 25% of the values that look more scattered. Median for Facebook average popularity is approximately 30 as compared to approximately 1.3 for GooglePlus and approximately 11 for LinkedIn. On further look see that there are two outliers in the data for GooglePlus as can be seen in Fig.18. Metrics used in Fig.17, Fig.18 and Fig.19 are the average popularity scores calculated in Fig.7, Fig.8 and Fig.9.
VI. NEWSPREDICTION
Accuracy score is calculated If is the predicted value of
the -th sample and is the corresponding true value, then
the fraction of correct predictions over is defined
as [12]
Random Forest Classifier
Using pandas and scikit-learn library random forest is applied for the database. Data is split into training and testing using train_test_split into 60% and 40% respectively. Accuracy for the model is calculated using accuracy_score. Taking target as LinkedIn and on converting ‘Topic’ to four columns of zeroes and ones and choosing all others as features the prediction accuracy was 54.38%. On converting ‘Topic’ to 0,1,2,3 and ‘SentimentTitle’, ‘SentimentHeadline’ to bins of -1,0,1 the accuracy score for the testing set is 0.547082797083 i.e. 54.7% for criterion as Gini index. When criterion in changed to Entropy the accuracy score comes out to be 54.64%.
A. Decision Tree
The decision tree is implemented using Python, splitting the data into training and testing sets and calculating the accuracy of prediction. Using target as LinkedIn and on converting ‘Topic’ to four columns of 0s and 1s and choosing all others as features the prediction the accuracy was 45.37% and with entropy as a criterion it became 45.55%. On converting ‘Topic’ to 0,1,2,3 and ‘SentimentTitle’, ‘SentimentHeadline’ to bins of -1,0,1 the accuracy score for the testing set is 54.65% for criterion as Gini index. When criterion in changed to Entropy the accuracy score comes out to be 54.75% as shown in Table I.
B. Support Vector Machine
[image:4.595.317.563.50.355.2]The SVM is implemented using Python, splitting the data into training and testing set using train_test_split into 60% and 40% respectively.
Fig. 13. Timeline for social platforms
[image:4.595.50.297.50.397.2]Fig. 14. Q-Q plot for Facebook and GooglePlus Fig. 11. Title average popularity chart
International Journal of Innovative Technology and Exploring Engineering (IJITEE) ISSN: 2278-3075,Volume-8, Issue-11, September 2019
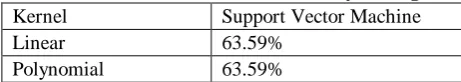
For target as economy and taking headline and title sentiment original values as features calculate the accuracy of prediction. With SVM regularization parameter as 1and kernel as linear we get the prediction to be 63.59%. When we take kernel as radial basis function prediction becomes 63.59% and on changing it to polynomial prediction comes out to be 63.59% as given in Table II.
Table- I: Prediction values with LinkedIn as target
Criterion Random Forest
Classifier
Decision Tree
Gini Index 54.7% 54.65%
[image:5.595.322.553.71.112.2]Entropy 54.64% 54.75%
Table-II: Prediction values with economy as target
Kernel Support Vector Machine
Linear 63.59%
Polynomial 63.59%
VII. CONCLUSION
In this paper, predictive model for news feed topics (Economy, Microsoft, Obama and Palestine) was represented by attributes taken from social media (Facebook, LinkedIn, GooglePlus) and the following interesting patterns are identified:
The highest prediction accuracy has been observed for Support Vector Machine.
The social media platform on which the news is being published plays a very important role in popularity scores.
The positive, negative or neutral sentiment of the news title and headline is heavily dependent on the topic. But the amount of popularity is platform dependent.
Popularity scores are highest for Facebook, then it is LinkedIn and lowest are for GooglePlus.
The popularity scores of title and headline for LinkedIn and GooglePlus are almost or exactly same, except for neutral of Microsoft.
For Obama, the popularity scores for Facebook increase when checked for title to when checked for headline. While for all others there is a decrease in the popularity. The above points if taken into consideration while publishing a news article can improve the overall reach. Based on the prediction results obtained for an article yet to be published, certain modifications can be done in that article for obtaining better results. For future work, more attributes can be taken into account like month of publishing and time of publishing for more accurate predictions. Use of feedback dataset for prediction by grouping attributes and finding common ones.
REFERENCES
1. Adedoyin-Olowe, Mariam, Gaber, Mohamed and S. Frederic. “A Survey of Data Mining Techniques for Social Media Analysis,” Journal of Data Mining and Digital Humanities, 2013
2. U. Fayyad, G. Piatetsky-Shapiro, and P. Smyth, “From Data Mining to Knowledge Discovery in Databases,” AI Magazine, vol 17, pp. 35-54, 1996
3. C. Grozea, D. Cercel, C. Onose and S. Trausan-Matu, "Atlas: News aggregation service," 16th RoEduNet Conference: Networking in Education and Research (RoEduNet), pp. 1-6, 2017
4. S. Setty, R. Jadit, S. Shaikh, C. Mattikalli, and U. Mudenagudi, “Classification of Facebook News Feeds and Sentiment Analysis,” International Conference on Advances in Computing, Communications and Informatics (ICACCI), pp.18-23, 2014 .
5. R. C. Chikkamath, B. S. Babu, “Concept detection and Cluster Analysis from Newsfeed – Singular value decomposition based Approach,” International conference on Computational Intelligence and Networks, pp.130-135, 2016.
6. J. Han, J. Pei, M. Kamber. “Data Mining: Concepts and Techniques,” 3rd Edition, Morgan Kaufmann Publisher, 2011
7. P. O. Gislason, J. A. Benediktsson, and J. R. Sveinsson, “Random Forests for land cover classification,”
[image:5.595.47.299.130.842.2]Pattern Recognition Letters, vol.27, pp.294-300, 2006. Fig. 15. Q-Q plot for Facebook and LinkedIn
Fig. 16. Q-Q plot for Facebook and LinkedIn
Fig. 17. Facebook Economy box plot for popularity average
Fig. 18. GooglePlus Economy box plot for popularity average
Fig. 19. LinkedIn Economy box plot for popularity average
Fig. 15. Q-Q plot for Facebook and LinkedIn
oto
8. V.F. Rodriguez-Galiano , M. Chica-Olmo , F. Abarca-Hernandez , P. M. Atkinson, and C. Jeganathan, “Random Forest classification of Mediterranean land cover using multi-seasonal imagery and multi-seasonal texture,” Remote Sensing of Environment, vol.121, pp.93-107, 2012
9. Q. Dai, C. Zhang, and H. Wu, “Research of Decision Tree Classification Algorithm in Data Mining,” International Journal of Database Theory and Application. vol.9, pp.1-8, 2016
10.K. Durgesh and L. Bhambhu, “Data Classification Using Support Vector Machine,” Journal of Theoretical and Applied Information Technology, pp.1-7, 2010
11.N. Moniz and L. Targo, “Multi-Source Social Feedback of Online News Feeds”,2018 Scikit-learn webpage. [Online]. Available:
12.http://scikit-learn.org/stable/modules/model_evaluation.html (September,2018)
13.S. Bhat, S. Garg, G. Poornalatha, “Assigning Sentiment Scores for Twitter Tweets”. International Conference on Advances in Computing, Communications and Informatics, pp.934-937, 2018
14.M. Masrani, G. Poornalatha, “Twitter Sentiment Analysis using a modified Naïve Bayes algorithm”. Advances in Intelligent Systems and Computing, pp.171-181, 2018
AUTHORSPROFILE
Arpit Garg is a Computer and Communication Engineering B.Tech. graduate of year 2018 from Manipal Institute of Technology, Manipal. Currently working as a software developer at Temenos India Pvt Ltd, Bangalore. Author of ‘Landslide prediction using classifier models’ which was presented at IRES’17, Thailand. rpit Garg is a Computers and Communication. Currently working as a software developer at Temenos India Pvt Ltd, Bangalore. He has worked on multiple technical projects, and has been associate with Temenos for the past one year. Author of ‘Landslide prediction using classifier models’ which was presented at RES’17, Thailand. Minor project as a student during his B.Tech course includes influenza outbreak using dataset from WHO website. He has also represented India at World Hip Hop dance Championship'17 which was conducted in Arizona, USA. Also won Bronze medal at Indian Hip Hop Dance Championship'17, Mumbai.