Animals Breeding Efficiency According to the
Phenotype of their Offspring
Fedoseyeva Natalya Anatolyevna, Sanova Zoya Sergeevna, Myshkina Maya Sergeevna, Kiselev Leonid Yuryevich, Kiselyov Vladimir Leonidovich
Abstract: The paper aims to identify the best animals with the optimal variant of selection traits in dairy cattle breeding by studying the breeding and genetic parameters (M, m, σ, Cv, r) of the basic dairy and reproductive traits of individuals and genetic groups, which make it possible to comprehensively assess the breeding efficiency of animals according to the phenotype of their offspring. The paper justifies characteristics of the seed bulls fixed for the breeding stock, and proposes basic principles of selection. The range of evaluated traits was expanded – from milk productivity and reproductive qualities to health indicators (longevity, somatic cell content in milk) and estimate of the animal body type (exterior). The correlation coefficient (g) between fat and protein was not standard: when selecting animals with a high content of protein in milk, only in 20% of cases the selected cows have a high level of fat.
Keywords: Breed; Genetic groups; Genetic potential; Genetic progress through selection; Productivity
1. INTRODUCTİON
Breeding shifts from short-term "breeding achievements" to improvement of the holsteinized population using an optimized breeding program, and this is one of scientific problems in solving these tasks. The factors of the genetic improvement of herds are not always taken into account in the achievement of high indicators of milk production, that is, the quantity does not go into quality.
Breeding has gone far ahead due to the use of a maximum of known and reliable information for the evaluation of dairy cattle: from the breeding background and indicators of the own productivity and the productivity of offspring to genetic data.
Revised Manuscript Received on July, 2019.
Fedoseyeva Natalya Anatolyevna, Research Scholar
Sanova Zoya Sergeevna, Research Scholar
Myshkina Maya Sergeevna, Research Scholar
Kiselev Leonid Yuryevich, Research Scholar
Kiselyov Vladimir Leonidovich, Research Scholar
In comparison with the evaluation of seed bulls using the method of the daughter herdmate, it is possible to select bulls and cows taking into account the genetic trend in generations, and regulate the level of intensity of the selection process in the population. This allows increasing the comparability of animals at the population level, and improving the effectiveness of custom mating to obtain offspring with the aimed genotype parameters.
The Interbull system serves as a basis for comparing animals with each other. Later, it will allow identifying the best seed bulls and cows (for example, for obtaining embryos) by creating ratings of regional and national levels. The first results were obtained in 2015-2016 in the Moscow and Leningrad Regions, which showed the possibility of practical use of genomic and genetic assessments in the breeding of dairy cattle at the regional management level (Amerkhanov 2017: 2).
A necessary condition for obtaining high productivity of cows is the intensive use of highly valuable, in respect of breeding, seed bulls. As is known, the genetic contribution of a bull to the efficiency of breeding is 70%.
The experience of the past decades has shown that ignoring the indices of reproduction and health in breeding activities irreversibly leads to their serious degradation. Therefore, almost all countries with developed dairy cattle use indicators of reproduction and health in the selection (Saragusty 2011).
Based on selection and genetic parameters for a specific population, it is possible to calculate the expected result of selection, and to develop such selection methods that will allow obtaining the maximum progress through selection – in this case, higher milk production. Progress through selection shall mean shifts in the genetic average value in a given population over a period of one generation to the next, which are the result of the selection measures applied at a certain selection pressure.
of bankruptcy at a productivity of 10,000 kg per cow in Western Europe due to the high costs for veterinary services, imported concentrates and rearing bull-calves breeding (Sørensen et al 2016).
Historically, the Nordic countries (Sweden, Norway, Denmark and Finland) attached great importance to the use of health and reproduction indicators in dairy cattle breeding; the US used only the milk productivity indicators (Gaworski & Rocha 2016; Hayes 2013).
Currently, there is a general consensus that it is necessary to calculate milk yield using relative indicators, which is confirmed by the practice of such countries as Sweden, Finland and the Federal Republic of Germany, the USA (Igna et al 2010; Beever 2006).
The average milk yield of cows remains the main selection and economic indicator in dairy cattle breeding. However, against the background of its growth and, in a number of cases, the achievement of European and world levels, the tendencies of reproduction parameters degradation and reduction in the productive longevity of cows have occurred in recent years.
Therefore, the main is the need for methodological innovation for more objective comprehensive group assessment of bred cattle. Animal assessment based 0n a set of traits using own methods is carried out throughout the world (Stelvagen 2011). In the system of international assessment of seed bulls called Interbull (Sweden), the equations for conversion of the breeding value and the reliability of the forecast (MACE) for each of the 29 countries participating in the process are used. In the case of Canada, the reliability level of dairy productivity indicators when converting estimates of foreign bulls will vary from 0.28-0.42 to 0.50-0.75 with similar values in countries of animals' origin such as New Zealand and the USA, 0.60 and 0.90, respectively. Thus, even in the international system, it is necessary to confirm the current status of the bull (Vajta 2012; Phillips 1993). If it is not possible to get replacement heifers only from the best mother cows, it is necessary to provide the excellent quality of father bulls; and the worse the mother cow, the more important is the seed bull, which must improve the offspring.
Genetic improvement of the herd depends on the degree of inheritance of the high productive qualities of parents by the offspring (Tario et al 2010). Therefore, in the case of mass selection and selection of the best animals in the parent generation based on their phenotype, it is necessary to predict a possible genetic shift in the generation of offspring obtained according to the main selectable traits.
2. MATERIAL AND METHODS
Calculation of the bull breeding value (BBV) was carried out according to the formula: BBV = 2b – (Pd – Phm), where b is the regression coefficient of the breeding value for the animal genotype; Pd is the average productivity of daughters, Phm is the average productivity of herdmates. Genetic progress through selection of the seed bull was calculated by the formula: SE0 = S, where S is the selection differential.
To assess breeding activities, we estimated the effectiveness of selection according to the actual maternal milk yield and the breeding value of used seed bulls. For this, highly productive mother cows (M+m) with milk yields above 6 thousand kg of milk (n = 171 or 21.5% of the total herd) were divided according to the increase in productivity into 5 groups.
In the selected groups of mothers, the selection differential (S) was calculated, which is the difference between the maternal productivity indicator in the selected group and the average indicator of productivity in the herd:
S = Mselect – Mav. in the herd.
The value of the heritability coefficient h2, calculated by the method of analysis of variance between the milk yield of daughters and mothers, was 0.96. Given the value of the heritability coefficient, it is possible to calculate the response to selection (∆g) – the product of the heritability
coefficient by the selection differential: ∆g = h2‧S. The expected productivity of daughters of the selected mothers (Dselect. mothers) was calculated by adding the indicator of average productivity in the herd (Mav.in the herd) and the response to selection (∆g):
Dselect. mothers = M av.in the herd+∆g.
The spectrum of evaluated characteristics: milk production (milk yield for 305 days of lactation, fat, protein) and the reproductive capacity of animals (age of first calving, live weight at the first insemination). The material for research was highly productive Holstein animals of the dairy complex on one of the farms in the region. The total number of first-calf cows' daughters in the studied population was 366 animals; 228 of them were estimated according to the first complete lactation. The herd was formed from purchased heifers from Hungary, America and Denmark. All animals are purebred and have certificates confirming their breeding status. The choice of these countries is dictated by productive qualities. Highly productive animals from America were selected due to dairy productivity and highly productive animals from Denmark were selected due to the fat and protein indicators and long life expectancy. Selex (2018) electronic database was used. All calculations of live cows' dairy productivity are given as of January 1, 2016. The digital material of the experimental data was processed by the method of variational statistics and the program Microsoft Office Excel.
In order to determine the level of variability of any quantitative trait, and to evaluate the results of breeding activities according to this trait, the method of variational curves is used. The trait indicators are distributed from the lowest value to the uppermost value in the form of intervals with the same step and the number of animals falling into the corresponding interval is calculated. Variational curves are made based on this data; the quantitative value of the trait is placed on the abscissa axis (the X-axis), and the number of animals with this trait is placed along the ordinate axis (the Y-axis).
(the area filled with diamonds). The right class includes animals with indicators higher than the modal class (the area filled with waves). The left class includes animals with indicators lower than the modal class (the area filled with dots). The standard deviation (σ) is the statistical indicator according to which trait consolidation is judged (or the "average" scatter of the variable values with respect to its arithmetic average, which is equal to the square root of the variance).
3. RESULTS
The milk productivity of cows in the average for the herd was 9,414 kg of milk, the fat content – 3.60 and the protein content – 3.22. All cows are purebred, of the elite-record class. First-calf cows have a very high productivity potential – the average milk yield during the first lactation was almost 10,130 kg; the percentage of fat and protein on average was 3.62 and 3.22%, which corresponds to the breed standard.
However, the herd contains 158 cows, or 23%, the butter-fat yielding capacity of which is less than 3.60%. First-calf cows, as in the previous groups analyzed, have low consolidation of animals. This means that, when selecting animals with a high content of protein in milk, only in 20% of cases the selected cows will have a high level of fat (Table 1).
Table 1. General characteristics of first-calf cows' milk productivity for 305 days of lactationa
According to the protein content in milk, the interval of the modal class is narrow and is ± 0.03 (σ), σ does not exceed permissible 5% and is only 0.93% of the average; the actual modal class includes about 87% of the animals (Figure 1).
Figure 1. Variation curve for fat and protein content in milk
The variation curve for the distribution of animals according to the butterfat content indicator corresponds to the classical form: there is a pronounced peak, only two points fall into the modal class – this indicates a high consolidation of the animals; the left side is steep, and the right side is flatter – this indicates that animals with a low indicator of the trait are practically absent, and animals with high fat percentage are present in the herd and this is a reserve for improving the indicator. In the authors' studies, the correlation coefficient (r) between fat and protein was not standard and amounted to +0.188 at an average, but the correlation coefficient between milk yield and fat in this herd is very close to ideal and is +0.996, which coincides with the data of domestic and foreign researchers. The variational curve of the total fat and protein content in milk is shown (Figure 2).
Figure 2. Variational curve of total fat and protein content in milk, kg
As a result, the heterogeneity of animals on the basis of the milk yield trait occurs and thus consolidation decreases. This is confirmed by the rate of the variational curve – a wide base, gentle descent (especially on the left), the top of the peak has a plateau (Figure 3).
Figure 3. Variational curve of the first-calf cows' milk yield for 305 days
This means that, at least during the first 100 days of lactation, the animals were not sufficiently tried to obtain a higher milk yield. The calculation is based on the fact that the milk yield of Holstein cows in the first 100 days of lactation corresponds to 40-45% of the total milk yield for 305 days of the lactation. At first glance, the potential for milk productivity of first-calf cows was fully implemented, since if the milk yield in the first 100 days was 3,198 kg, the milk yield for all lactation should be 7,106-7,995 kg, and on average 7,550 kg, and in fact it was 10,130 kg
The first-calf cows had certain problems with the implementation of the genetic potential. The lactation period is divided into three parts: the first 90-100 days of lactation, the second 90-100 days of lactation and the third 105-125 days of lactation.
The main milk yield falls within the first and the second periods of lactation, which is why they are usually taken into account as "the first 100 days" and "the first 200 days" of lactation. Physiologically justifiable milk yields on average during these periods should be: the first period (the first 100 days) – 40-50%; the second period (second 100 days) – 30-35%; the third period (third 105 days) – 20-25%.
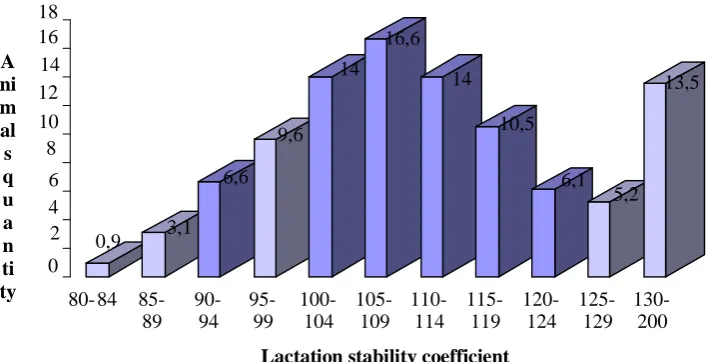
The stability coefficient can reach 98-99%, but in normal conditions, it does not exceed 100%, the lactation stability coefficient (LCS) in the economy is 112% at an average. The presented data (Figure 4) again confirms that cows in the farm are not tried to obtain a higher milk yield correctly in the first three months of lactation.
Figure 4. Variational curve of the lactation stability coefficient
A similar pattern is observed not only in first-calf cows but also in cows having the second and third lactation. According to the physiological standards, milk yield in the last 100 days of lactation should not exceed 20% of the total milk yield. Based on milk productivity in the first lactation, the forecast was made for the milk yield of cows analyzed above according to the last completed lactation (LCL) (third, second, first-calf) for subsequent lactation (Table 2).
Table 2. Forecast of milk yield of cows with 1-3 finished lactations for the next few years (on average)a
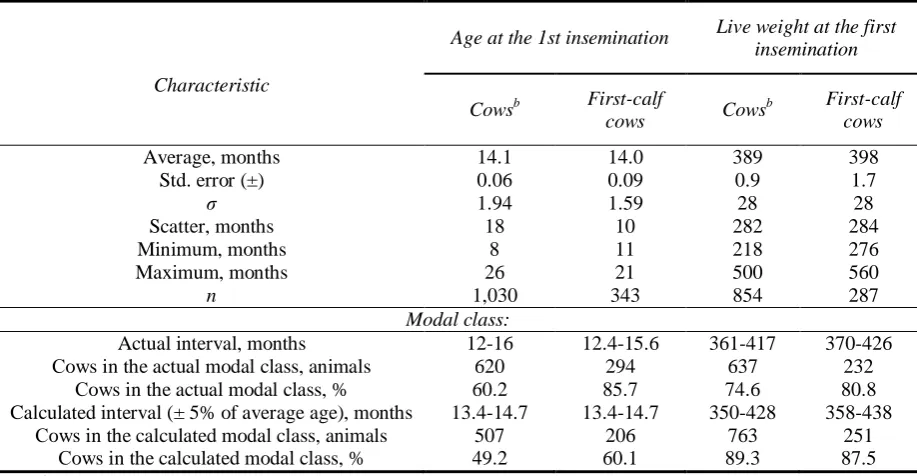
and only 49% of cows and 60% of first-calf cows fall within this interval. The age at the first insemination of 118 cows and 25 first-calf cows in the herd was 17 months and more, which is 11.8% and 7.3%, respectively (Table 3).
Table 3. General characteristics of age at the 1st inseminationa
The indicators of the average live weight of animals at the 1st insemination are fairly close to the standard parameters characteristic for this breed (370-380 kg). The animals in the herd are well-consolidated according to this trait. The interval of the calculated modal class (σ = 28 kg, or 7.0-7.2%) turned out to be wider than the interval of the actual modal class (±39 kg). 75% of animals among cows with the 2nd last completed lactation and above fall within the actual modal class, and 81% among first-calf cows, and 90% of animals (87-89%) fall within the calculated modal class.
There are 16 cows with a weight below 350 kg in a herd, or 1.9%, and 6 first-calf cows, or 2.1%. There are 75 cows with a weight at the 1st insemination more than 430 kg in a herd, or 8.8%, and 29 first-calf cows, or 10%. As for the animals which did not gain enough weight by the 1st insemination, there may be two reasons: very young animals aged 10-12 months were inseminated, or undernourished animals were inseminated. As for animals with excess weight at the 1st insemination, the reason is in several successively infertile inseminations.
The dairy productivity of animals belonging to different genotypes is given in Table 4.
Table 4. Productivity of cows depending on their belonging to the linesa
There was no significant difference in the productivity of the lines. This indicates good uniformity of the herd, despite the importation of animals from different countries. Selection of bulls of American and Canadian selection ensured the uniformity of the herd in terms of productivity and type. For expressing the level of statistical significance, use conventional abbreviations, for example, P<0.05, P<0.001 or P>0.05.
The productivity of the first-calf cows of the W.B. Ideal 933122 line exceeded the first-calf cows at an average by 99 kg of milk, and R. Sovering cows 198998 in the second lactation exceeded the productivity of other lines by 135 kg of milk. The productivity of cows that had third and above lactation did not have a big difference. First-calf cows and cows of the second calving are the animals obtained and grown in a breeding farm.
The evaluation was carried out for all indicators included in the database, so the number of daughters (n) is indicated by the traits with the maximum information. For each indicator in the herd, there is a sufficient scatter of data, in addition, according to one indicator the best are the daughters of some bulls, and according to the other – the daughters of other bulls. The highest milk yield (over 10,500 kg of milk) was shown by the daughters of the California-M (11,198 kg), W. Torshot-Et (10,867 kg), Event-M (10,748 kg) and Dipenhoek Fighter (10,597 kg) bulls, and the lowest milk yields (below 9,900 kg) was
shown by the daughters of the Sotti-M (9,883 kg), Blister-M (9,702 kg) and Dolman (9,499 kg) bulls.
Table 5. Daughters’ milk productivity and economic traits depending on the seed bulla
The percentage of fat in milk was the best for the daughters of Vomaz Patch-Et – 3.64% and W. Topshot-Et, Alta Toma, J.L. Winston, Dolman – 3.62%, and the butterfat content 3.56% was shown by the daughters of Event-M and H. Ruffian. It should be noted that, despite the fact that the percentage of fat in milk in the best cows was 3.62-3.64%, these figures are below the breed standard (3.7%). The percentage of protein in milk in the herd fluctuates within a narrow range of 3.21-3.24. In this regard, it is difficult to select the best or worst daughters of different bulls.
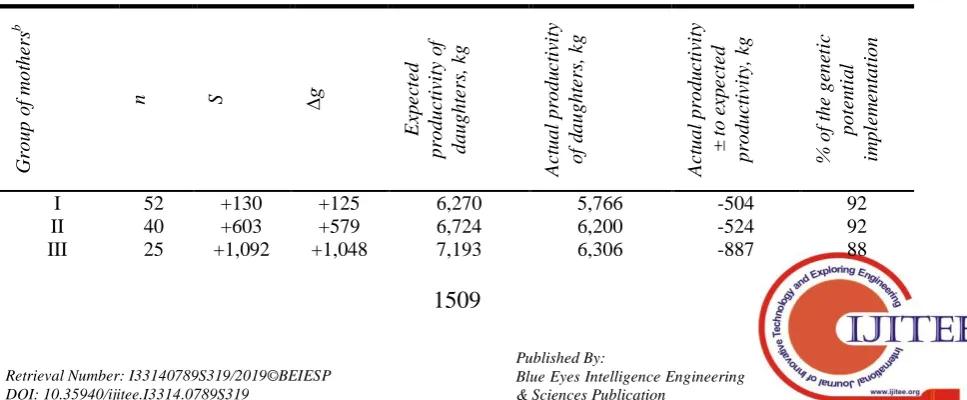
The higher the selection differential, the greater the genetic progress through selection in subsequent generations. However, the actual productivity of daughters did not coincide with the expected one – the percentage of implementation of the genetic potential of mothers was 72-92% (Table 6).
Table 6. Indicators of the implemented genetic progress through selection in groups of highly productive mothers-cowsa
This may be due to the fact that mothers were raised in other conditions of feeding and management than their daughters, and due to improper selection of seed bulls with worse potential than mothers.
The correlation coefficient of daughters milk yield for the first lactation and the average milk productivity was 0.96, which indicates a high level of correlation of indicators and the possibility of reliable evaluation of seed bulls by the first lactation of their daughters.
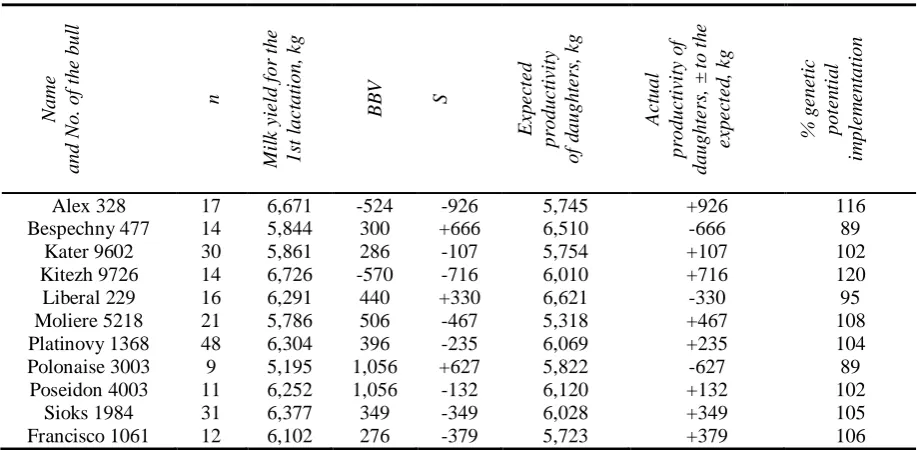
The calculated genetic progress through selection of the seed bull, which is the difference between the productivity of daughters and the mothers of these daughters, showed that only four seed bulls were selected correctly and turned out to be improvers – Bespechny 477, Liberal 229, Polonaise 3003 and Hamok 397558. The genetic potential of the other seed bulls used was below the potential of mothers, and the actual productivity of the daughters was largely due to the potential of mothers (Table 7).
Table 7. Prediction of the genetic progress through selection according to the seed bullsa
The analysis of the bulls used in the herd indicates that only 5 of 12 seed bulls had a positive breeding value – BBV.
4. DISCUSSION
We calculated the generalized indicators of the differences between the estimates of lines and bulls. As a rule, simple averaging was used to calculate the animals' indicators generalized by groups. With an equal number of animals in each group, this averaging is correct. If the groups differ in the number of animals, the final assessment will be more or less biased.
evaluated in models of this type are the sample average, the effects of factors and the forecast of the genetic progress through selection. The latter is used to obtain information on the statistical significance of the effects of factors evaluations. In this case, the effects of four specific lines were of interest. Therefore, the conclusions apply only to the sample being analyzed. The lines estimates given in Tables 4, 5, and 7 are indicative of actual positive or negative deviations from the mean population value. It seems that for a breeder or a farmer, the following question is more important: bull sperm of which line should be used at present, in order to obtain an increase in production and, consequently, profit in the future? In other words, it is desirable to have predictive estimates of the lines.
Estimates of the breeding value of bulls were used to obtain predictive estimates of the lines. The assessment of the seed bull effect was predictive. It indicated how much the average indicators of future daughters of the bull in the standard conditions will deviate in the direction "+" or "-" from D.). According to the estimates used, one can judge the breeding value of the line with a probability of 30-70%.
We demonstrated the opportunities of modern statistical methods and corresponding computer programs in the analysis of various indicators of animals, to show how objective can be the results of such analyzes (see Tables 1, 3).
The breeding value of lines is determined by the breeding value of its bulls. The assessment of bulls depends, in turn, on the reliability of the forecast of their genotype and the intensity of removing the worst. Bulls in the country assessed by comparison with herdmates (SS-method) annually and centrally (VNIIPlem – All-Russian Scientific Research Institute of Breeding).
In recent years, work with lines has come to the "binding" of one or another imported Holstein bull (sperm) or offspring to one of 5 genealogical lines (Saksa 2018). In the USA, in the homeland of the Holstein breed, firstly, there is no breeding by lines as a system of breeding activities. Secondly, the direction of selecting bulls for artificial insemination focuses on obtaining net profit. The latter largely correlates with the indicators of milk productivity. Similarly, in Russia, if breeders perform any selection of bulls, then regardless of linearity, the vector of selection is directed at productive features. Therefore, there are no significant differences between the Holstein lines (Table 4).
Russian holsteinized populations are at the base of the selection pyramid. Russian farms will no longer "get off" from the Holstein genetics and the need for a "better world gene pool" will increase. Already, most seed bulls at Russian breeding enterprises are of the Holstein breed. The area of holsteinization is expanding; the concentration of Holstein genes is increasing, especially in breeding farms.
Intensive selection of seed bulls in donor populations and international trade of sperm reduce the effective number of transboundary Holstein breeds (Lawlor 2012;
Statistical Indicators 2012, Rodriguez et al 2011). This can lead to an increase in the probability of spontaneous inbreeding in recipient populations. Therefore, with today's breeding, genealogical lines and their monitoring are necessary, firstly, as a means of preventing spontaneous inbreeding; secondly, to monitor genetic changes in Russian populations. Such monitoring can be useful until "electronic selection" is created and widely introduced (based on genealogical and/or molecular-genetic markers) in Russia. Ideally, the function of the latter should consist in harmonizing the selection of mating partners, the expected offspring of which would combine a high total breeding value with the permissible level of the coefficient of inbreeding. "Electronic selection" should maximize the prognostic assessment of the economic value of future offspring. It is naive to believe that Russian breeding stock will ever compete with that of North America and the leading countries of Western Europe.
The field of cattle breeding needs evolutionary changes: the permanent importation of the "best world gene pool" in order to develop and introduce modern breeding methods, reproductive and molecular genetic technologies, information systems.
Even with intensive selection of the best mothers in the breeding flock, improperly selected seed bulls can level the positive effect of breeding or significantly reduce it. Depending on the breed characteristics and zonal conditions, it is necessary to take into account the genetic potential of seed bulls and mothers to increase the efficiency of breeding activities, and to correctly select pairs based on the calculation of the genetic progress through selection.
5. CONCLUSIONS
Evaluation of cows using the set of milk productivity indicators (milk yield, fat and protein content in milk) and reproductive capacity makes it possible to select and use the best animals for raising bulls with a high breeding value, not only in the Russian Federation but also abroad. This is important for the correct selection of bulls, which determines the characteristics of the future offspring, high dairy productivity, reproduction, and longevity.
qualities. The best identified bulls in terms of milk yield: California-M, W. Thorshot-Et, Event-M and Dipenhoek Fighter are recommended for selection in farms.
REFERENCES
1. Amerkhanov Kh A (2017). Status and development of dairy cattle breeding in the Russian Federation [Состояние и развитие молочного скотоводства в Российской Федерации]. Dairy and Beef Cattle Breeding 1: 2-5. (in Russian)
2. Beever D E (2006). The impact of controlled nutrition during the dry period on dairy cow health, fertility and performance. Animal Reproduction Science 96: 212-226.
3. Gaworski M & Rocha A G F (2016). Effect of management practices on time spent by cows in waiting area before milking. In Engineering for Rural Development: 15th International Scientific Conference Proceedings: Vol. 15. Jelgavas Tipogrāfija, Jelgava, Latvia, pp. 1300-1304.
4. Hayes B (2013). 1000 Bull genomes Consortium. The 1000 Bull Genomes project-toward genomic selection from whole genomesequence data in dairy and beef cattle. In: B Hayes, H D Daetwyler. R Fries & B Guldbrandtsen (Eds), Proceedings of Plant and Animal Genome XXI Conference. Wageningen, San Diego, USA, W150.
5. Igna V, Moje A, Mircu C, Roman M, Ghiurca C, Casalean D, & Cernescu H (2010). The influence of some environmental factors and age on semen production of fleckvieh bulls. Lucrari Stiinlifice Medicina Veterinara XLIII (2): 57-63
6. Lawlor T (2012, January 21). Haplotypes impacting fertility. In: Holstein USA 2012. All Breeds Convention, Syracuse, NY, USA, pp. 1-41.
7. Phillips C J C (1993). Cattle Behaviour. Farming Press Books, Ipswich, England.
8. Rodriguez S M, Florins A, Gillet N, de Brogniez A, Sanchez-Alcara M-T., Boxus M, Boulanger F, Gutierrez G, Trono K, Alvarez I, Vagnoni L, & Willems L (2011). Preventive and therapeutic strategies for bovine leukemia virus: Lessons for HTLV. Viruses 3: 1210-1248.
9. Saksa, E. I. (2018). The effectiveness of the use of bulls, evaluated by different methods, in the improvement of highly productive herds. Dairy and Beef Cattle Breeding 1: 5-9.
10.Saragusty J (2011). Current progress in oocyte and embryo cryopreservation by slow freezing and vitrification. Reproduction 141: 1-19.
11.Selex Program, Database of the Dairy Cattle (2018). In: Regional Center for Information Support of Livestock Breeding in the Leningrad Region "PLINOR", Informational and Analytical System "SELEX". Retrieved from
http://plinor.spb.ru/index.php?l=0&p=3
12.Sørensen L P, Bjerring M & Løvensdahl P (2016). Monitoring individual cow udder health in automated milking systems using online somatic cell counts.
Journal of Dairy Science 99 (1): 608-620.
13.Statistical indicators (2012). Breeding value estimation of milk production traits with test-day model. Manual CRV, Chapter E7. Retrieved on February, 2019 from https://www.crv4all- international.com/wp-content/uploads/2016/03/E-7-milk-production.pdf
14.Stelvagen K (2001). Effect of milking frequency on mammary functioning and shape of the lactation curve. Journal of Dairy Science 84: 204-211.
15.Vajta G (2012). Vitrification in human and domestic animal embryology: work in progress. Reproduction, Fertility and Development 25: 719-727.
Figure 1- Variational curve of total fat and protein content in milk, kg. Prepared by the authors on the basis of the Database of the "Dairy Cattle SELEX" Program (2018)
[image:7.595.120.474.412.593.2]Figure 2- Variational curve of the first-calf cows' milk yield for 305 days. Prepared by the authors on the basis of the Database of the "Dairy Cattle SELEX" Program (2018)
Figure 3- Variational curve of the lactation stability coefficient. The figure was prepared by the authors on the basis of the Database of the "Dairy Cattle SELEX" Program (2018)
[image:7.595.63.553.678.841.2]TABLES
Table 1- General characteristics of first-calf cows' milk productivity for 305 days of lactationa
Characteristic Milk yield for the first lactation
Fat, kg Protein, kg
Average, kg 10,130 365 325
Std. error (±) 90 1.8 1.6
σ 1,364 48 43
Scatter, kg 8,428 302 272
Minimum, kg 5,585 202 179.6
0,9 3,1 6,6
9,6 14
16,6
10,5
6,1 5,2
13,5
0 2 4 6 8 10 12 14 16 18
A ni m al s q u a n ti ty , %
80- 84 85- 89
90- 94
95- 99
100- 104
105- 109
110- 114
115- 119
120- 124
125- 129
130- 200 Lactation stability coefficient
Modal class:
Actual interval, kg 8,766-11,494
317-413
282-368
Number of animals in the modal class 161 476 474
Number of animals in the modal class, (%) 70.6 69.3 69.0
Calculated interval (± 10% of the average value), kg 9,117-11,143 329-402
293-356
Number of cows in the calculated modal class, animals 125 389 380 Number of cows in the calculated modal class, (%) 54.8 56.6 55.3
n 228 687 687
2,5a
Prepared and calculated using the Database of the "Dairy Cattle SELEX" Program, 2018
Table 2- Forecast of milk yield of cows with 1-3 finished lactations for the next few years (on average)a
LCL Milk yield for the first lactation (actual) Lactation forecast 2nd 3rd 4th 5th
3rd 8529 - - 10128 10661
2nd 9216 - 10368 10944 11520
1st 10130 10763 11396 12029 12663
a
Prepared and calculated using the Database of the "Dairy Cattle SELEX" Program, 2018
Table 3- General characteristics of age at the 1st inseminationa
Characteristic
Age at the 1st insemination Live weight at the first insemination
Cowsb First-calf
cows Cows
b First-calf
cows
Average, months 14.1 14.0 389 398
Std. error (±) 0.06 0.09 0.9 1.7
σ 1.94 1.59 28 28
Scatter, months 18 10 282 284
Minimum, months 8 11 218 276
Maximum, months 26 21 500 560
n 1,030 343 854 287
Modal class:
Actual interval, months 12-16 12.4-15.6 361-417 370-426
Сows in the actual modal class, animals 620 294 637 232
Сows in the actual modal class, % 60.2 85.7 74.6 80.8
Calculated interval (± 5% of average age), months 13.4-14.7 13.4-14.7 350-428 358-438
Сows in the calculated modal class, animals 507 206 763 251
Сows in the calculated modal class, % 49.2 60.1 89.3 87.5
a
Prepared and calculated using the Database of the "Dairy Cattle SELEX" Program, 2018
b
[image:8.595.71.530.378.616.2]Those that were supplied as heifers
Table 4- Productivity of cows depending on their belonging to the linesa
Lactationes 1st lactation 2nd lactation 3d and above
Lines n
m
il
k
yi
el
d,
k
g
fat
,%
±
to
m
il
k
yi
el
d
in
the
h
e
rd
n
m
il
k
yi
el
d,
k
g
fat
,%
±
to
m
il
k
yi
el
d
in
the
h
e
rd
n
m
il
k
yi
el
d,
kg
fat
[image:8.595.64.554.673.834.2]R.Sovering 198998
78 9,801 3.60 -129 80 11,507 3.61 +179 54 10,967 3.60
Montvik Chiftain 95679
21 9,748 3.58 -182 25 11,390 3.60 -62 10 11,622 3.60
W.B. Ideal 933122 165 10,024 3.60 +94 130 11,286 3.60 -42 75 10,651 3.60 Pabst
Governer-Ned Boy 882933
2 9,859 3.59 -71 - - - -
+, – by lactation 263 9,930 3.60 - 235 11,328 3.60 - 140 10,726 3.60
a
[image:9.595.65.531.248.585.2]Prepared and calculated using the Database of the "Dairy Cattle SELEX" Program, 2018
Table 5- Daughters’ milk productivity and economic traits depending on the seed bulla
n Mi lk y ie ld f or 305 da y s F at P rot ei n Mi lk y ie ld f or day s L CS D ry pe ri od Se rv ic e p e ri od Mi lk ing da y s
Fathers kg % kg % kg 100 200 days
J.L. Winston 12 10,028 3.62 363 3.24 325 3,552 7,016 112 55 123 338 W. Topshot-Et 12 10,867 3.62 393 3.24 352 3,516 7,376 118 53 180 393 Dipenhoek F. 19 10,597 3.61 383 3.22 342 3,376 6,988 112 49 162 349
Dolman 21 9,499 3.62 343 3.23 307 3,164 6,491 106 50 160 333 Californo-M 14 11,198 3.60 403 3.22 360 3,801 7,714 PO 47 224 400 Krull Eden 18 9,922 3.60 357 3.22 320 3,469 6,891 106 55 140 353 Ozon 48 10,199 3.60 367 3.23 329 3,278 6,914 119 55 186 381 Osofain 18 10,476 3.61 378 3.23 338 3,292 6,949 114 45 195 365 Sotti-M 16 9,883 3.58 354 3.21 317 3,421 6,952 108 66 172 378 S-Haven Omar 12 10,131 3.61 366 3.23 327 3,373 6,956 107 50 167 334 Alta Toma 20 10,298 3.62 373 3.23 333 3,390 6,976 103 30 181 360 Baskey Pilot 15 10,005 3.59 359 3.22 322 3,453 6,948 106 59 210 378 Blister-M 12 9,702 3.59 348 3.21 311 3,233 6,700 108 77 275 432 Networth 18 10,099 3.61 364 3.22 326 3,251 6,735 112 55 185 372 H. Ruffian 10 10,237 3.56 365 3.21 329 3,383 7,062 118 55 237 445 Caesar Alta 18 9,969 3.61 360 3.23 322 3,177 6,716 112 50 168 371 Manor 3 Malvo 22 10,045 3.58 360 3.22 324 3,260 6,833 111 57 191 397 Event-M 15 10,748 3.56 383 3.21 345 3,608 7,341 PO 69 224 428 Other 341 9,990 3.64 363 3.22 322 3,426 6,914 108 58 202 408
a
[image:9.595.69.553.636.836.2]Prepared and calculated using the Database of the "Dairy Cattle SELEX" Program, 2018
Table 6- Indicators of the implemented genetic progress through selection in groups of highly productive mothers-cowsa
G roup of m ot he rs b
n S ∆g
E x p e ct e d pr oduc ti vi ty o f daught e rs , k g A c tual pr odu c ti vi ty of d aught e rs , k g A c tual pr odu c ti vi ty ± to e x p e ct e d pr oduc ti vi ty , kg % of t he ge ne ti c pot e n ti a l im pl e m e nt at ion
I 52 +130 +125 6,270 5,766 -504 92
II 40 +603 +579 6,724 6,200 -524 92
V 29 +2,890 +2,774 8,919 6,433 -2,486 72
Average 171 +868 +833 6,978 6,145 -833 88
a
Prepared and calculated using the Database of the "Dairy Cattle SELEX" Program, 2018
b
[image:10.595.68.527.187.412.2]I – a group of cows with a productivity of 6,000-6,500 kg of milk, Group II – 6,501-7,000 kg, III – 7,001-7,500 kg and IV – 7,501 kg of milk and above
Table 7- Prediction of the genetic progress through selection according to the seed bullsa
Nam
e
a
nd
No
.
of
t
h
e
bul
l
n
Mi
lk
y
ie
ld
f
or
t
h
e
1s
t
lac
tat
ion,
k
g
B
B
V
S
E
x
p
e
ct
e
d
pr
oduc
ti
vi
ty
of
d
aught
e
rs
,
k
g
A
c
tual
pr
oduc
ti
vi
ty
o
f
daught
e
rs
,
±
to
th
e
e
x
p
e
ct
e
d
,
k
g
%
g
e
ne
ti
c
pot
e
n
ti
a
l
im
pl
e
m
e
nt
at
ion
Alex 328 17 6,671 -524 -926 5,745 +926 116
Bespechny 477 14 5,844 300 +666 6,510 -666 89
Kater 9602 30 5,861 286 -107 5,754 +107 102
Kitezh 9726 14 6,726 -570 -716 6,010 +716 120
Liberal 229 16 6,291 440 +330 6,621 -330 95
Moliere 5218 21 5,786 506 -467 5,318 +467 108
Platinovy 1368 48 6,304 396 -235 6,069 +235 104
Polonaise 3003 9 5,195 1,056 +627 5,822 -627 89
Poseidon 4003 11 6,252 1,056 -132 6,120 +132 102
Sioks 1984 31 6,377 349 -349 6,028 +349 105
Francisco 1061 12 6,102 276 -379 5,723 +379 106
a