Abstract: Residential buildings are the significant energy consumer of the India which is about 24% of the total energy consumption. Energy efficient buildings are the ideal solution to reduce energy consumption in the building sector. The energy efficient buildings can be achieved by incorporating passive features or renewable energy systems or both. The current work aims to perform a retrofitting analysis of an existing building into an energy efficient building. For performing the energy analysis REVIT 2017 tool is used. Using the REVIT 2017 tool building model is developed, building information are loaded and energy analyses are performed. The building is analyzed as two cases. The first case is to estimate energy performance of the existing building. The second case is to incorporate passive features and renewable energy system to the building and evaluate the energy performance. Existing building Energy Usage Intensity (EUI) was 193 kWh/m2/year. When passive features (Insulation, additional window glazing and efficient air conditioning systems) alone incorporated to the building the building EUI is reduced to 138 kWh/m2/year. Along with Passive features Photovoltaic modules with different efficiencies 16%, 18% and 20% are considered for renewable energy generation. The energy generation for the different PV modules for three different roof area (40%, 60% and 70% of total roof area) is evaluated. The energy usage intensity varies from 11.4 from -150 kWh/m2/year for the combination of different efficiency of PV module and the different % of roof area covered. The negative sign indicates the energy generation after the required energy usage. The payback period for only incorporating passive features is 6.3 years and while incorporating PV system with passive features is 9 years.
Index Terms: Energy efficient building, Energy analysis, Retrofitting, Passive features for thermal comfort, Renewable energy.
I. INTRODUCTION
In total energy consumption of the world, Building sector alone takes about 40% of energy, also produces 30% of greenhouse emission[1]. So to face the constant increasing in energy demand it is required to move for the solution. The Energy efficient technologies and Renewable energy sources are the solutions for the increased energy demand. In the view of Building sector, to face the energy demand both
Revised Manuscript Received on August 05, 2019.
M.Ijasahmed, Mechanical Engineering Department, National Institute of technology Calicut, Kozhikode, India.
Ramesh Krishnan.L, Mechanical Engineering Department, National Institute of technology Calicut, Kozhikode, India.
Gangadhara Kiran Kumar.L, (Corresponding Author), Mechanical
options are applied. Building color, shading system, night ventilation, controlled ventilation, roof coating and eco-evaporative cooling are the most suitable passive methods [2] for warm and dry regions. Self-shading devices, window to wall ratio and proper building orientation can save cooling energy from 5 to 70 % [3] in subtropical regions. Priority has to be given to retrofit envelopes [4] with Insulation, alternate windows etc. Combination of Shading over hangs, with Insulation, alternate windows [5] results into 30% reduction annual energy consumption. Cool painting is one of the option to reduce indoor temperature [6] effectively. Passive strategies have to be chosen carefully for the hot and humid climates [7] to achieve acceptable energy savings. Four main aspects of energy efficient buildings namely, 1.Passive design of the building, 2. Use of Low embodied energy-building materials, 3. Energy conservation using energy efficient techniques, 4. Incorporation of renewable energy systems for electrification of the building, hot water generation etc., are reviewed [8] and discussed the pros and cons of each aspect, also reported that Solar based Passive and renewable technologies are most beneficial to reduce CO2 from the building sector, suggested to utilize locally available building materials to reduce the embodied energy of the building. Feasibility of grid connected solar photovoltaic system [9] in a hostel building is reported. Recently, Thermal performance of different building materials including window glass materials [10] are analyzed. Designing of self-energy sufficient building using building integrated PV is studied , where the State Government Solar policy helped to reduce the payback period [11]. Effect of geometrical factors of the building like
Window-Wall ratio, Window positioning, on
heating/Cooling and lighting energy consumption is studied[12]. Energy efficient based life cycle analysis done in Indian buildings, reported that desired capacity of PV installation can save 54% of energy in the building over the life span of 25 years[13]. Building information modeling (BIM) is developing a building model with its physical and functional characteristics.[14]. BIM is not just a 3D modeling of a building it includes the information such as location, orientation, materials, weather data, energy usage details, topography details
etc., Revit is a one of the
Modeling and Simulation of a Building towards
Energy Efficiency
Modeling and simulation of a building towards energy efficiency
used in Building energy simulation sector. Revit also helps to perform retrofitting analysis for energy performance. REVIT, ARCHI CAD Sketchup, Open Studio are the widely used Building design software tools. REVIT is the most used tool for building design in research works. The ‘green building studio’ which is the web version of REVIT , cloud based energy analysis tool is the one of the most used building energy analysis tools after Energy plus and e-Quest[15]. REVIT tool were used to identify the incident radiation on the building envelope to predict the Solar PV potential of the building in a retrofitting analysis [16]. REVIT tool were used to model a building to predict electricity generation through building integrated photovoltaic (BIPV) cells. Energy analysis was carried out in REVIT and it provided reliable results on BIPV performance[17].To transform an existing university in to zero energy building a complete energy performance assessment is done using REVIT. Sun path analysis, Daylighting analysis, heating and cooling load were predicted using the REVIT tool. The REVIT tool was to helpful to predict the energy performance for both existing and retrofitted case[18].
In the Current work Building is modeled and energy analysis is performed in REVIT 2017. The building is analyzed as two cases, the first case to estimate the energy performance including heating and cooling load for the existing condition. The second case as retrofitting case by incorporating passive and renewable energy measures.
II. MODELINGANDSIMULATONS
The building’s architecture modelling is done using REVIT 2017. The energy model is also developed by including basic material properties and specifying location in REVIT 2017. The deeper energy analysis is done in Insight which is an energy analysis plug in for REVIT software. The Insight plug in provides facilities for energy performance optimization, solar analysis , Heating cooling load analysis. Hence the various analyses performed are as follows. 1. The Solar Analysis, 2.Heatig and Cooling load estimation, 3.Energy performance analysis and 4. Retrofitting analysis.
III. DETAILSOFTHECONSIDEREDLOCATION ANDTHEBUILDING
A. Building location
The Selected building is located in Kattangal situated in Kozhikode city. The location is 11.3182° N, 75.9376° E.
B. Climatic condition
Kozhikode experiences a warm humid climate according to Indian climate classification and tropical monsoon according to Koppen climate classification. A highly humid and high temperature climate features with high temperatures recorded during March to May. In the month of April a short span of pre-monsoon exists in the city sometime. But the
South-west monsoon during the first week of June to September is the primary source of rain. North east monsoon from second half of October to end of the November also gives significant raining to the city. From December to March the climate is milder. The Climate data obtained from the REVIT software for the considered location:
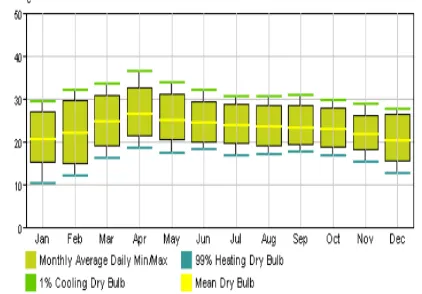
By giving the location of the building in the REVIT software. REVIT utilizes the nearby weather station and provides various annual weather data. Obtained data are shown in figures 1 & 2 and annual range is given in the table 1.
[image:2.595.307.537.179.594.2]Figure 1 monthly temperature range
Figure 2 Monthly Relative humidity data
Table 1 Annual range of weather data
Temperatur e
Maximum-33°C;Minimum-26°C; Average-28.5°C
Relative humidity
Maximum-78%;Minimum-48%; average-59%
Solar Irradiation
Maximum–980W/m2;Minimum–650W
/ W/m2 ; Average – 710 W/m2
The Temperature and relative humdity data were measured in realtime and recorded for a six months in the considered location using Testo 480 instrument. The compared results were shown in figure 3a and 3b respectively.The simulated data the values are closely agreeing with the measured
[image:2.595.320.531.195.342.2]weather data shows a highly reliable values.
C. Descriptions of the building
[image:3.595.313.539.47.222.2]The building is a single storey building with floor area of 88 m2. Other basic descriptions of the building is given in the table 2. The materials of the building components are given in the table 3. The materials are considered as in that of existing case of the building. Following figures (Figures 4 - 6) show different views of the building.
Table 2 Description of the building
Residence type Multi-family Single story, of floor area 88 m2
Orientation North south oriented longer walls, entrance is facing east direction. Two bedrooms located in western direction.
Shape and Volume Volume of the building – 237 m3; Surface of the exposed area – 169 m2;
Compactness – 0.71
Shading devices The roof projection over the verandah act as the shading for the front portion of the house which covers only the hall portion. No Shading is provided for windows in any direction.
Renewable energy sources
The existing building is not facilitated with any renewable energy sources like Solar PV, Wind energy , Bio mass etc.,
Air conditioned portions
Two bedrooms (12 m2 and 13m2) and the living hall 20 m2 are the portions only air conditioned.
Figure 3 (a) Comparison of Simulated and Real time measurement of Dry bulb temperature for a period of six months.
[image:3.595.61.280.180.612.2]Figure 3 (b) Comparison of Simulated and Real time measurement of Relative humidity for a period of six months.
Figure 4 3D view of the building
[image:3.595.316.541.237.697.2]Modeling and simulation of a building towards energy efficiency
Figure 6 Plan of the building
[image:4.595.68.270.325.525.2]The details of the building such as size orientation and energy system details are provided in the Table 2 and the materials details of the wall, roof, window etc., are provided in Table 3.
Table 3 Materials & Building Components (Existing Case)
Roof Uninsulated flat roof (U = 1.5583 W/m2K)
Exterior walls
Un insulated brick (U = 1.4269 W/m2K)
Interior walls
4 in common brick with plaster (U = 1.5662 W/m2K)
Floors Passive floor, no insulation, tile or vinyl (U = 2.9582 W/m2K)
Doors Wooden (U = 2.1944 W/m2K)
Windows Large single glazed windows (U = 5.5617 W/m2K; SHGC = 0.86)
HVAC system
12 SEER/Split/Packaged
The building follows a typical residential schedule for occupancy, lighting and appliances. The house has the more usage of utilities from the evening to entire night. During the day time power consumption is less as the occupancy is also less.
IV. SIMULATIONANDANALYSES(EXISTING CASE)
To evaluate the energy performance of the building and potential energy generation of the building various analyses have been performed in the REVIT software. Each analyses and the respective results have been discussed in this section Solar analyses include following analyses 1. Sun Path for the peak load day 2. Sun path for full year. 3. Solar Radiation
A. Sun path – Shadow effect during the peak load day (April 21)
The shadow analysis (Figure 7) on peak day provide some valuable information. At 9.00 Am, the entire west portion is
shaded , where two bed rooms are situated. But the front portion where the hall is situated is not shaded and gains maximum heat gain. Since the hall and two bed rooms only are air conditioned, it is noted that the hall portion receives the more heat gain and the bedrooms are receiving very less heat gain due to shading effect. At 11.00 A.M the front portion where hall is situated shaded due to the projection over the veranda. This shadow effect will reduce some amount of heat gain. However the roof is exposed to sun, so significant heat gain is received on hall and bed rooms as well. During noon 1.00 P.M the entire roof is fully exposed to the sun and also the northern wall is exposed. But still front portion of the hall (entrance) and the western wall is fully shadowed. It can reduce a part of heat gain through respective walls and windows provided on them. This case continues for another two to three hours. So time period from 12.00 PM to 4.00 PM the roof is fully exposed which is the peak load duration. After 5.00 P.M only the west portion of the house is exposed to the sun and the entire front portion (Hall) is shaded. Only the two bedrooms receive more heat gain. During this time internal heat gains are also higher. So the bedrooms receive maximum heat gain at this time. From the shadow study , the notable point is the roof receives the maximum heat gain since no insulation is provided. So the roof requires passive heat reduction method such as insulation, reflective painting , cool roof etc. Shading devices to be provided to western wall windows also western wall may be insulated to reduce the heat gains.
Figure 7 Sun path – Shadow effect during the peak load day (April 21)
[image:4.595.311.543.444.630.2]Figure 8 Sun path for full year - Top view
Figure 8 shows one year sun path for the building which depicts very important point that the sun always follow the path towards southern portion. This causes less heat gain during the summer on the northern wall (one of the longest wall). The Sun fully covers the southern wall during winter time. It actually benefits the building as building requires some heat during winter period.
C. Solar radiation on the building
[image:5.595.313.546.398.593.2]This analysis shows the range of values of the incident radiation on the surfaces of the building, roof or any other surfaces. The results give the values from minimum to maximum for over a period of a year.
Figure 9.a. Average Insolation on building envelopes
Figure 9.b. Average insolation on building envelopes - western and southern walls
The (solar radiation analysis) results (figures 9a, 9b) prove that roof is the major receiver of the solar radiation, Where the maximum value of radiation reaches (736 Wh/m2). Other parts where more radiation received next to the roof are southern and western walls. Especially the western wall receives more radiation during the evening as it is inferred from the sun path study. So sufficient shading or projection is to be provided for western wall and southern wall to reduce the radiation heat gain. This study infers another information also that the most suitable place for the solar based renewable system is roof. Moreover the southern wall also can be utilized for solar energy utilization (eg- building integrated PV) as it receives significant amount of radiation.
D. Energy analysis of the Building
Energy analysis includes heating/Cooling load and other electric appliances load estimation.
E. Heating and cooling load
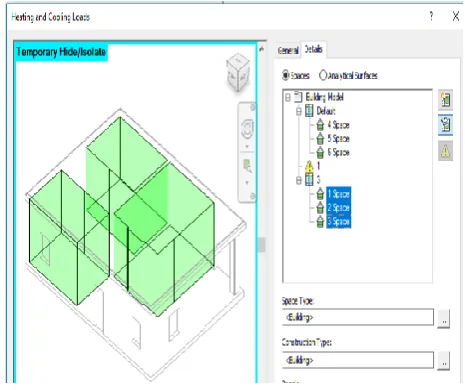
Since the climatic location is a warm humid climate, the building requires air conditioning during summer period. For the building a living hall and two bedrooms are considered to be air conditioned. The higlighted zones in the Figure 10 are the HVAC zones. Cooling load for individual rroms are provided in the table 4
Figure 10 HVAC Zones (highlighted)
Table 4 - Cooling load results
Space Area (m2)
Exposed Wall area (m2)
Occupant (Nos)
Cooling set point
Peak Cooing load (kW)
Living
Modeling and simulation of a building towards energy efficiency
Bed
room 1 13 23 2 2
Bed
room 2 12 23 2 1.8
Total Cooling load 6.1
0 1000 2000 3000
Living room Bedroom 1 Bedroom 2
Cooling load in watts
Wall Window Door Roof
Lighting Equipments People
Figure 11 Cooling load of each components of HVAC zones
The cooling load results show that major heat is gained from the roof and window (figure 11) especially west side window. Walls also play a significant role in heat gain. But the window is very crucial because for its smaller area compare to the wall and roof it receives nearly 30 to 40% of the total gain heat to the room. The cooling load is also evaluated by using unsteady cooling load calculation method. The calculated and simulated cooling load results are compared. The equations (formulas) used for estimating the cooling load are given as follows ( 1 to 8).
Conduction through exterior structure (walls, roof and glass),
1 Solar radiation through glass, ( ),
2 Conduction through interior structure (partition walls, floor and ceilings), ( )
3 Heat gain from lighting ( ),
4 Heat gain from people in sensible load ( ) and latent load
( ),
5 6
Heat gain from equipment and appliances ( )
7
8
Note: CLTD, CLF, ACH, , , BF, SHGF, SC values are taken from HVAC hand book[19]
[image:6.595.50.288.46.336.2]For living room the heat gain values from simulated results are compared with calculated values
Figure 12 – comparison of simulated and calculated heat gain values for living room
The figure 12 shows that Revit simulation results are very closer to the calculated values. Thus the Revit results are providing highly reliable values in cooling load estimation also.
F. Energy analysis results
specifying the details such as materials, HVAC system building type, occupancy time and appliances operating time. Then the model is simulated for the energy analysis. The results are presented below in the table 5.
Table 5 – Energy analysis results
Energy usage intensity Electricity - Energy
usage intensity
193 kWh/m2/year
Fuel – Energy usage intensity
386 MJ/ m2/year
Life Cycle energy use and cost (30 years of Life) Life cycle electricity
use
462353 kWh
Life cycle fuel use 923448 MJ
From the energy performance results the annual electrical energy usage of the building per year is 193 kWh. In the electricity usage nearly 70 % of load is consumed only for HVAC operation. The fuel usage is 168 MJ per year. So the annual electricity cost becomes approximately Rs.1, 16,000 and the fuel (LPG) cost becomes Rs.12000.Figure 13 shows monthly electricity usage, on an average 1200 kW/h is used in a month.
V. RETROFITTINGANALYSIS
Passive features are the primary choice for retrofitting the building. The passive features selected are as follows, insulation for roof and walls, double glazing for windows and energy efficient air conditioning systems. Later renewable energy system is also included. The energy performance by retrofitting with passive features alone discussed in this section. The selected materials for retrofitting are listed in the table 6 and the respective thermal conductance values are also provided.
Table 6 Retrofitting case – Material properties
Roof 4 inch heavy weight concrete with 2 inch insulation
(U = 0.5181 W/m2K) Exterior
walls
Brick work single leaf construction EPS insulation (U = 0.5596 W/m2K) Interior
walls (No change)
4 in common brick with plaster (U = 1.5662 W/m2K)
Doors (No change)
Wooden (U = 2.1944 W/m2K)
Windows Uncoated Double glazing clear glass (U = 1.9873 W/ m2K)(SHGC = 0.49)
HVAC Residential 17 SEER/Split/packaged
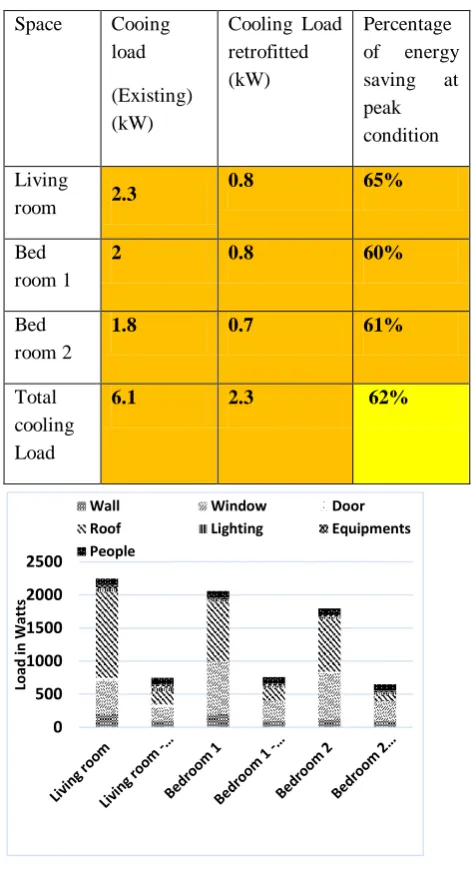
A. Cooling load of the building – Retrofitted case
The table 7 shows the cooling load results after retrofitting with passive features. The cooling load reduces up to 60% of existing load during the peak condition. The overall energy savings in the cooling load is 30% of the existing load. The comparison result shows (Figure 14) that major savings occurred in Roof, window and wall respectively. The Roof load has reduced by 80% from the existing case.
Table7 Cooling Load after Retrofitting (with Passive features)
0 500 1000 1500 2000 2500
Load
in Watt
s
Wall Window Door
Roof Lighting Equipments
People
Figure 14 Cooling load before and after retrofitting (in watts)
B. Energy performance after retrofitting with Passive features
The annual energy consumption is decreased to 10659 kWh from the existing consumption 15410 kWh. So the energy usage intensity becomes 138 kWh/m2/year. Cooling load after retrofitting becomes as 8020 kWh which is 30% lesser than the existing condition. A comparison of monthly
Space Cooing
load
(Existing) (kW)
Cooling Load retrofitted (kW)
Percentage of energy saving at peak condition
Living
room 2.3
0.8 65%
Bed room 1
2 0.8 60%
Bed room 2
1.8 0.7 61%
Total cooling Load
[image:7.595.319.555.193.632.2]Modeling and simulation of a building towards energy efficiency
[image:8.595.46.275.104.271.2]electric load before and after retrofitting with passive features is shown (Figure 15). The monthly load never touches the 1000 units in any month in the retrofitted case
Figure 15 Electricity load pattern comparison before and after Retrofitting.
Table 8 Unit cost of alternate materials for retrofitting
EPS insulation for Walls and Roof
250 INR per m2
Uncoated double
glazing
3500 INR per m2
17 SEER efficient HVAC system
40000 INR
The unit cost of the materials for retrofitting is provided in the table 8. The passive features provide significant energy saving by means of reduced cooling load. The cooling load reduced by 30% from the existing load and reduces from 11515 kWh to 8020 kWh per year. The energy cost saved by this reduced cooling load is about 19570 rupees per year. The expenditure for adding passive features is 123,000 INR approximately. The estimated payback period for retrofitting with passive features alone is 6.3 years.
VI. INCORPORATIONOFRENEWABLEENERGY SYSTEM
The Passive systems can only reduce the existing load , the renewable systems can generate energy within the building by utilizing the wind or solar or bio energy available on the site. Solar PV system is considered to be as renewable energy system for the building to generate energy within the building footprint. Solar PV generation potential and the corresponding savings are identified by the following solar analysis.
A. Solar PV potential
[image:8.595.327.535.109.461.2]For selected PV panel type based on efficiency the potential energy generation per unit roof area is given in the figure 16.
[image:8.595.305.548.518.833.2]Figure 16 Solar Energy generation potential for PV module 16%, 18% and 20% efficiency
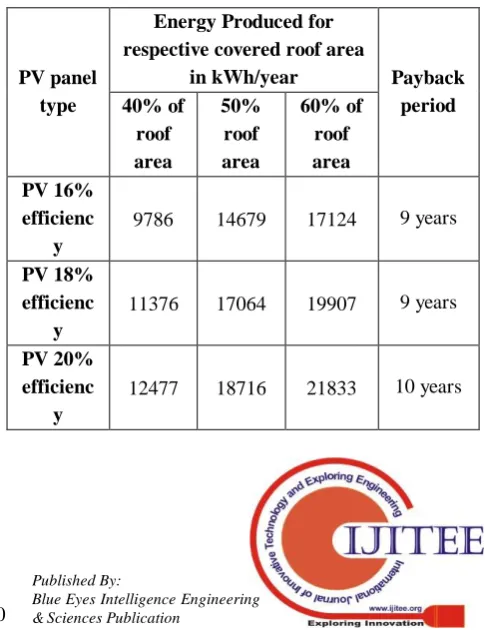
Table 9 Energy generation by PV modules per year
PV panel type
Energy Produced for respective covered roof area
inkWh/year Payback
period 40% of
roof area
50% roof area
60% of roof area PV 16%
efficienc y
9786 14679 17124 9 years
PV 18% efficienc
y
11376 17064 19907 9 years
PV 20% efficienc
y
B.Energy usage and Cost savings after incorporating PV system
From the generated energy the required energy for the building will be used, the surplus energy produced can be stored and used later or it can be exported to the grid. From the above results (table 9) most of the cases the building produces surplus energy only. So the building becomes a plus energy building in these cases. For the case of 16% PV efficiency and 40% roof area the energy produced is 9786 kWh which is lesser than actual building load (10659 kWh). The remaining energy (876 kWh) required will be consumed from the grid which is called as the Net energy consumption. Except this case in all other cases the building produces surplus energy after satisfying the building load. In these cases the excess energy produced may be exported to the grid. The exported energy is also can be called as net energy consumption with negative sign. The energy usage intensity is shown in the figure 17 .The energy usage intensity (EUI) varies from11.3 kWh/m2 to – 140 kWh/m2. The negative sign actually represent the surplus energy produced after the consumption for the building load. For the minimum of 40% roof area and low efficiency PV system itself one can reach EUI 11 kWh/m2 which is 18 times lesser than existing energy usage.
[image:9.595.310.543.48.277.2][image:9.595.51.286.381.565.2]
Figure 17 Energy usage intensity for Different PV modules
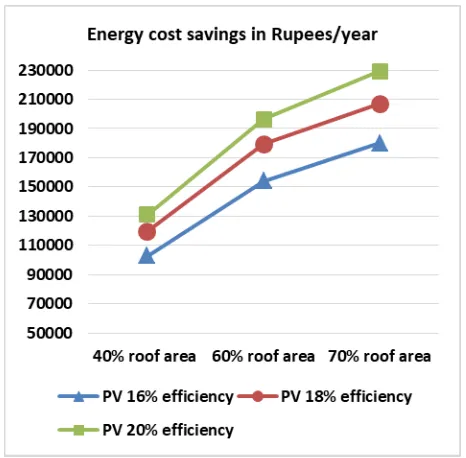
Figure 18 Cost savings for different PV modules and different
The figure 18 shows the respective cost saved for each type of PV system and different Roof area covered. From the graph , one can easily pick the combination of roof area covered and type of PV system based on the energy savings and payback period.
C. Payback period for incorporating the Renewable energy system (Solar PV)
The energy cost savings and the cost of surplus energy produced are the positive income of the building, which can pay back the installed cost of the PV energy system. The payback periods for the different PV system based on efficiency 16%, 18% and 20% are 9 years , 9years and 10 years respectively. Based on the payback period also one can select the PV system to incorporate in the building. These payback periods are estimated after incorporating passive features.
VII. CONCLUSIONS
Modeling and simulation of a building towards energy efficiency
The building is simulated as two cases, 1. Energy performance of the existing building 2.Energy performance of the building by incorporating with passive features and renewable energy system. The building architecture model is developed and the information such as location, building materials are also imported from the database available in the tool. The following analysis were performed in the REVIT software, 1. Solar analysis 2. Cooling load estimation 3. Energy performance estimation. The Solar analysis provides sun path, shadow effect and the incident radiation falling on the building surfaces. The results are helpful to identify the critical portions where more heat is gained and where solar based energy system benefits. The solar analysis results can be very helpful in the design stage of the building to decide the orientation, location of windows and location of solar based energy system such as Photovoltaic modules (PV) or solar heaters. The cooling load is estimated by selecting the HVAC zones and specifying the details of the materials. The peak cooling load is obtained as 6.1 kW in the HVAC zones (Hall, and two bedrooms). From the results, it is observed that roof and windows caused the major heat gain than other components of the building. The annual energy consumption of the building is estimated as 15410 kWh per year and the energy usage intensity (EUI) was 193kWh/m2/year. The energy performance results revealed that 75% of the load is caused by HVAC system only. For the retrofitting analysis, Passive features are chosen for walls, roof, window and HVAC system. The cooling load decreased to 8020 kWh/year which is 30% lesser than existing case. The energy usage intensity becomes as 138 kWh/m2/year for the retrofitted case. This savings obtained by just adding the passive features. The payback period for incorporating the passive features is 6.3 years. The energy performance is again simulated by incorporating the photovoltaic energy system (PV). The PV modules of three different efficiencies (16%, 18% and 20%) are selected for three different roof areas (40% , 50% and 70% of roof area). The energy production, cost savings and payback periods are obtained by the solar PV analysis for different combination of PV type and roof area covered. The energy usage intensity varies from 11.4 kWh/m2/year to -150 kWh/m2/year for the combinations from 16% efficiency PV and 40% roof area to 20% efficiency PV and 70% roof area. The negative signs indicates that the building is generating the surplus energy after satisfying the required load of the building. The payback period after incorporating PV energy system along with the passive system varies from 9 to 10 years. The building owner can choose any combination of the above as per requirement of energy production and payback period. The energy saving benefits are compared with the existing building performance. The model reports that the building becomes not just energy efficient it becomes a positive energy building with the utilization passive features and Renewable energy
system which generates excess energy than the consumed energy in a period of a year. The Revit tool is very helpful in predicting the energy performance of the building and provides very reliable results. So the tool can be used to design energy efficient buildings in the earlier phase of construction or before retrofitting.
APPENDIX
Symbols Subscripts
Q Heat gain in kW E Exterior surface
CLTD
Cooling load temperature Difference
r radiation
CLF Cooling load Factor SL Sensible load
SHGC Solar Heat Gain Co
efficient LL Latent load
SC Shading Co efficient Lt lighting
q Heat gain per
number in kW EA
Equipment and Appliances
BF Ballast factor s sensible
TD Temperature
Difference l latent
A Area in m2
W Wattage in watts
n
Number of component or
people
REFERENCES
1. P. Torcellini, S. Pless, and M. Deru, “Zero Energy Buildings : A Critical Look at the Definition Preprint,” ACEE Summer studay, vol. 2, p. 15, 2006.
2. I. Oropeza-Perez and P. A. Østergaard, “Active and passive cooling methods for dwellings: A review,” Renew. Sustain. Energy Rev., vol. 82, no. September 2017, pp. 531–544, 2018.
3. L. G. Valladares-Rendón, G. Schmid, and S. L. Lo, “Review on energy savings by solar control techniques and optimal building orientation for the strategic placement of façade shading systems,” Energy Build., vol. 140, no. 71, pp. 458–479, 2017.
4. Y. Fan and X. Xia, “A multi-objective optimization model for energy-efficiency building envelope retrofitting plan with rooftop PV system installation and maintenance,” Appl. Energy, vol. 189, pp. 327–335, Mar. 2017.
5. S. Charisi, “The Role of the Building Envelope in Achieving Nearly-zero Energy Buildings (nZEBs),” Procedia Environ. Sci., vol. 38, pp. 115–120, Jan. 2017.
6. P. Samani, V. Leal, A. Mendes, and N. Correia, “Comparison of passive cooling techniques in improving thermal comfort of occupants of a pre-fabricated building,” Energy Build., vol. 120, pp. 30–44, May 2016. 7. X. Sun, Z. Gou, and S. S.-Y. Lau, “Cost-effectiveness of active and passive design strategies for existing building retrofits in tropical climate: Case study of a zero energy building,” J. Clean. Prod., vol. 183, pp. 35–45, May 2018.
8. A. Chel and G. Kaushik, “Renewable energy technologies for sustainable development of energy efficient building,” Alexandria Eng. J., 2017. 9. A. K. Shukla, K. Sudhakar, and P. Baredar, “Simulation and
10. G. K. Kumar, S. Saboor, and T. P. A. Babu, “Experimental and Theoretical Studies of Window Glazing Materials of Green Energy Building in Indian Climatic Zones,” Energy Procedia, vol. 109, no. November 2016, pp. 306–313, 2017.
11. R. Joshi, M. Pathak, and A. K. Singh, “Designing Self-Energy Sufficient Buildings in India,” Energy Procedia, vol. 57, pp. 3110–3119, 2014. 12. A. Ghosh and S. Neogi, “E ff ect of fenestration geometrical factors on
building energy consumption and performance evaluation of a new external solar shading device in warm and humid climatic condition,” Sol. Energy, vol. 169, no. March 2017, pp. 94–104, 2018.
13. N. N. Kale, D. Joshi, and R. Menon, “Life cycle cost analysis of commercial buildings with energy efficient approach,” Perspect. Sci., vol. 8, pp. 452–454, 2016.
14. F.H. Abanda L. Byers, “An investigation of the impact of building orientation on energy consumption in a domestic building using emerging BIM (Building Information Modelling),” Energy, vol. 97, 2016. 15. R. M. S. F. A. Luís Sanhudo, Nuno M.M. Ramos, “Building information
modeling for energy retrofitting – A review,” Renew. Sustain. Energy Rev., vol. 89, pp. 249–260, 2018.
16. P. Fitriaty and Z. Shen, “Predicting energy generation from residential building attached Photovoltaic Cells in a tropical area using 3D modeling analysis,” J. Clean. Prod., vol. 195, pp. 1422–1436, Sep. 2018. 17. C.-C. C. Hang-Jung Kuo, Shang-Hsien Hsieh, Rong-Chin Guo, “A
verification study for energy analysis of BIPV buildings with BIM,” Energy Build., vol. 130, pp. 676–691, 2016.
18. C. K. Mytafides, A. Dimoudi, and S. Zoras, “Transformation of a university building into a zero energy building in Mediterranean climate,” Energy Build., vol. 155, pp. 98–114, Nov. 2017.
19. ASHRAE, “2001 ASHRAE Handbook Fundamentals,” ASHRAE Stand Stand., vol. 53, no. 9, pp. 733–745, 2001.
AUTHORS PROFILE
M.Ijas Ahmed, Research Scholar, Mechanical Engineering Department, National Institute of technology Calicut, Kozhikode, India.
L.Ramesh Krishnan, Research Schola,r Mechanical Engineering Department, National Institute of technology Calicut, Kozhikode, India.
Dr.Gangadhara Kiran Kumar.L, Assistant Professor, Mechanical Engineering Department, National Institute of technology Calicut, Kozhikode, India.