International Journal of Innovative Technology and Exploring Engineering (IJITEE) ISSN: 2278-3075, Volume-8 Issue-10 August, 2019
Abstract: In the field of microarray gene expression research, the high dimension of the features with a comparatively small sample size of these data became necessary for the development of a robust and efficient feature selection method in order to perform classification task more precisely on gene expression data. We propose the hybrid feature selection (mRMRAGA) approach in this paper, which combines the minimum redundancy and maximum relevance (mRMR) with the adaptive genetic algorithm (AGA). The mRMR method is frequently used to identify the characteristics more accurately for gene and its phenotypes. Then their relevance is narrowed down which is described in pairing with its relevant feature selection. This approach is known as Minimum Redundancy and Maximum Relevance. The Genetic Algorithm (GA) has been propelled with the procedure of natural selection and it is based on heuristic search method. And the adaptive genetic algorithm is improvised one which gives better performance. We have conducted an experiment on four benchmarked dataset using our proposed approach and then classified using four well-known classification approaches. The accuracy was measured and observed that it gives better performance compared to the other conventional feature selection methods.
Index Terms: Feature selection, classification, mRMR, AGA, hybrid feature selection
I. INTRODUCTION
The microarray technology has become a benchmark technique for prognosis and diagnosis of cancer. Prognosis and diagnosis of cancer is nothing but a classification of microarray dataset [1, 2]. The microarray dataset (gene expression dataset) contains information about the way genes are expressed. It has become possible to locate altered genes by means of analyzing these data. Hence better diagnosis and classification can be facilitated to medical science for the gene-related disease. Accordingly, cost-effective and efficient analysis can be performed by a biologist on the altered genes with few selected genes [3]. Still, the prediction and classification for the types of cancer remain a great challenge for medical science.
Profiles of gene expression data become very important for this purpose. However, due to the presence of small sample size in comparison to a large number of features (genes), many computational approaches used to fail in order toidentify small important subset from microarray data. This eventually makes more challenging for microarray data analysis [4]. Moreover, normally microarray data contain irrelevant features (genes) and redundant data. Hence, there will be a considerable increase in computational complexity
Revised Manuscript Received on August 02, 2019.
Rabindra Kumar Singh, School of Computer Science and Engineering, VIT Chennai Campus, Chennai, India.
Dr. M. Sivabalakrishnan, School of Computer Science and Engineering, VIT Chennai Campus, Chennai, India.
.
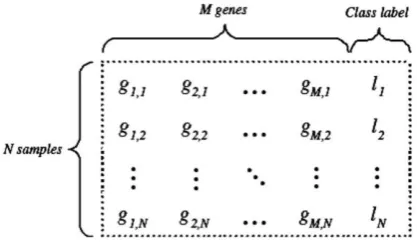
[image:1.595.326.535.258.382.2][5]. Actually, when we build a better predictor model then these redundant features do not contribute since this information is basically already available with other feature(s) [6]. N × M matrix shown in Figure 1 is an example of microarray dataset. Where N represents the samples number, M represents the genes number and {li | i = 1, 2, · · ·, N} is the class labels.
Figure 1: N × M microarray dataset
It is a well-known fact that redundant feature will have an adverse effect on the performance of the classification model therefore, it is necessary to reduce feature in order to get good performance using feature selection approach. The main aim of the feature selection is to identify the subset of important features. This is very essential and has been recognized as one of the focused areas in bioinformatics and machine learning [7]. There are three main methods have been used in the area of feature selection, which is categorized as filter-based, wrapper-based and hybrid-based [8]. All these mentioned approaches have been classified depending on their used criterion in the learning algorithm. The filter selection approach used to select features irrespective of the classifier model used. In this method, the feature(s) used to be selected which are of least interest and suppressed. The remaining feature(s) will be used for the classification by classification or regression model [9]. Since the filter method is not used in order to build classifier [10], the performance of the predictor will not be up to mark, if the learning algorithm considers the results of the filter directly. Taking into the consideration data are distributed and filters are categorized in two namely parametric and non-parametric approaches [11]. A parametric filter is based on the identical distribution of samples among different classes, such as chi-squared, Bayesian and ANOVA [12]. However, the assumption made in parametric cannot be assured in all datasets. Hence, a non-parametric approach may be a suitable option when dataset distribution is uncertain.
Microarray Gene Expression Data Classification
using a Hybrid Algorithm: MRMRAGA
Information gain, Relief-F, Gain ratio, and Pearson Correlation coefficient is the examples of non-parametric filters. Correlation Coefficient (PCC) is used to determine the relationships among the features in order to find the relation among classes. The evaluation on the subset of features is performed in a wrapper-based approach, by doing so the possible relation between the features can be detected. Wrapper method used to choose the subset of variables which gives the best accuracy for the model. Less number of variables is selected with the discriminative approach in this method [13]. We also know that the wrapper-based methods are classifier dependent and therefore the same performance may not be obtained if another classifier is used [10, 14]. Moreover, the overall performance of this approach is not upto the mark and also if they are directly utilized then there is a chance of overfitting on the data without pre-processing is performed [15].
Maximum Relevance and Minimum Redundancy
(mRMR) has been designed for microarray dataset feature selection [16]. It is a special type of feature selection method which works based on filter approach tends to select uncorrelated high predictive features. In this approach subset of features are selected having a high correlation with a class (relevance) with the minimum correlation among themselves (redundancy). Here, the features used to get ranked as per the maximum-relevance-minimum-redundancy criteria in this algorithm. The relevance of the features is calculated with the use of F-statistic and mutual information for continuous and discrete features simultaneously. The feature’s redundancy is computed with the use of the Pearson correlation coefficient (PCC) and mutual information for continuous and discrete features simultaneously. MIFS-ND algorithm has been proposed in [17], wherein features are selected based on the maximum-relevance-minimum-redundancy criteria. Here an optimization algorithm has been utilized which is known as No-dominated Sorting Genetic Algorithm-II [18]. Here authors have used domination count for the rank of calculated relevance and dominant count for the rank of calculated redundancy, and then both of them have been arranged in the sorted form [19], then one representative gene was selected from each group in such a way that selected genes are jointly distinct. Before using this approach, features have to be clustered on the basis of domain knowledge or correlation (e.g., gene ontology, molecular function, etc.). Redundant feature selection can be prevented by the clustering of genes by this algorithm.
Genetic Algorithm (GA) has been known as a stochastic optimization technique which works based on population. This is propelled with the procedure of natural selection and basic genetic concepts [20]. There are operations has been carried out i.e. crossover and mutation in genetic algorithm. Here the crossover and mutation probability is represented by Pc and Pm respectively. This algorithm has two common problems i.e. premature convergence or non-convergent. This may result because of inappropriate fixing the value of Pc and Pm. The Crossover probability (Pc) and mutation probability (Pm) values can be adjusted to improve the conventional GA, which is known as the Adaptive Genetic Algorithm (AGA). The robustness of the AGP is proven because of the adaptability capacity and hence, improves the likelihood in order to find the global optima solution. Combing two or more well-proven algorithm is known as a hybrid approach in order to design a new method to solve a problem. The hybrid algorithm is normally built on the
benefits of the existing approaches and hence becomes more robust than the traditional approach. Hybrid feature selection approach has been proposed here combing the mRMR and AGP in order to achieve minimum redundancy and maximum relevance among the features of the microarray dataset. We have demonstrated the efficiency of the proposed
mRMRAGA feature selection approach using the
comparison of the classification accuracy with other existing methods. We have applied three well-known classifiers on the four benchmarked datasets in order to test the accuracy of the proposed method. And we have found that our classification accuracy is comparable with the existing one.
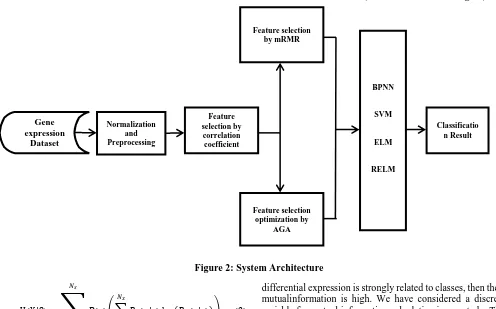
II. MATERIALSANDMETHODS A. System Architecture
The system architecture is illustrated in Figure 2. In our system input data are microarray gene expression data. First data are normalized and preprocessed in order to take care of noise and inconsistency. After that feature selection is performed using correlation coefficient methods are used in order to find the dependency of features i.e. genes. Then we mRMR feature selection method for considering the important features, subsequently, we used AGA algorithm to optimize the result. Finally, different classifiers are used and efficiency and effectiveness are measured.
We divided the system into three parts Feature selection by mRMR
Optimization by AGA Classification
The detailed explanation will follow in below subsection B. Relevance and redundancy for mutual information
In gene expression data analysis finding the features which are most relevant is very important.Identification of features (genes) w. r. t. the class labels that contain maximum information is the main goal of the feature selection procedure.
Feature entropy is an ideal metric in order to identify these features (genes). The entropy is nothing but the early improbability of the resulting class [21]. Equation 1 describes the entropy as below:
International Journal of Innovative Technology and Exploring Engineering (IJITEE) ISSN: 2278-3075, Volume-8 Issue-10 August, 2019
Gene expression
Dataset
Normalization and Preprocessing
Feature selection by
correlation coefficient (10-folds)
Feature selection by mRMR
Feature selection optimization by
AGA
BPNN
SVM
ELM
RELM
[image:3.595.43.539.31.340.2]Classificatio n Result
Figure 2: System Architecture
Here, s is known as input feature vector with Ns samples number. Px(x|x) is known as the conditional probability of class x. Normally, the value of conditional entropy should be <= initial entropy. If conditional entropy value becomes equal to initial entropy then we can conclude that features are independent of the classes. Therefore, the amount of uncertainty reduced is known as mutual information [21, 22]. I(X; S) the mutual information varies among x and s which is described as below:
Equation 3 can be re-written as:
Since the mutual information function is symmetric w. r. t. S and X, therefore I(S; X) = I(X; S).
C. mRMR method:
A well-known feature selection method minimum redundancy and maximum relevance (mRMR) with MID (mutual information difference) and MIQ (mutual information quotient) [23] are defined in this section. The genes have different expression in two or more classes significantly are known as differentially expressed genes. The levels of differential expression of genes are termed as the relevance of genes. With the help of mutual expression, the relevance of genes can be determined. When the expression of the genes has a uniform distribution of the subset among the different classes then their mutual information is zero with these classes. But when genes
differential expression is strongly related to classes, then their mutualinformation is high. We have considered a discrete variable for mutual information calculation in our study. The mutual information (I) for discrete data having 2 variables S and X is shown in Equation (4). Principle of minimizing the redundancy is nothing but to select features (genes) in such a way that their mutual information is having maximum dissimilarity w. r. t. other genes. Here, s is referred to as the subset of genes which we like to find. In Equation (5) the average minimum redundancy is described:
Where,
Mutual information is represented as I(i, j) between the ith and jth feature (gene) and a number of features (genes) in subset S is |s|. Mutual information technique is used in order to select the gene which is differentially expressed. The discriminant controls of genes are computed with the help of mutual information I(h, gi) as described in Equation (6). The relevance of gene is measured as the mutual information between target class (h1, h2, · · ·, hk) and gene expression (gi). Hence, maximizing the average relevance is nothing but the maximum relevance for all genes in subset s that is defined in Equation (6) as below:
At this moment mRMR has been described for discrete data which is in the form of mRMRMID and mRMRMIQ. The mRMRMID (mutual information difference) and mRMRMIQ (mutual information quotient) are formulated as shown in equation (7) and (8) respectively.
Algorithm for mRMR is defined as follows:
Algorithm 1: Feature selection with mRMR
Input: n – number of features to be selected, d - discretized data, g - number of features in d, c - class,.
Output: F - feature set.
Step1: idle ft ←[1 :g] Step 2: repeat fori ←1 to g
Step 3: relevance(i) ←mutualinfo(d(:, i), c); Step 4: [R, id] ←Max(relevance);
Step 5: F[1]←id;
Step 6: idle ft ←idle ft− F; Step 7: repeat fori←2 to ndo Step 8: obj1 ←relevance(idle ft); Step 9: repeat forj←1 to |idle f t| do
Step 10:
Step 11: redun(j)←sum / |F|; Step 12: end for (step 9)
Step 13: obj2 ←relevance(idle ft)/(redun+ 0.0001); Step 14: [newid, obj2]
←Nondominated-FeatureSelection(obj1, obj2, idle ft); Step 15: [R, id] ←Max(obj2);
Step 16: F[i]←id;
Step 17: idle ft ←idle ft− F; Step 18: end for (step 7)
D. Adaptive genetic algorithm
Normally, the Genetic Algorithm (GA) has two critical operations which are known as crossover and mutation. The new individuals are generated with the help of crossover globally and the new individuals are generated with the help of mutation locally. The GA has been granted with global and local search because of these two operations. The GA convergence in order to determine the optimal solution is determined by the probability of crossover (Pc) and the probability of mutation (Pm). Pc and Pm are predefined fixed variables in any standard GA. If Pc is too high then the optimal solution will miss out because of the granular global search. And if Pc happens to be very small, then searching will be lost with local minima. But if Pm happens to be very large, then there is no difference between GA and random search. And if Pm is very small, then the exploratory ability of searching will be suppressed. Therefore, multiple cross-validations are necessary in order to achieve an appropriate value of Pc and Pm. If GA is allowed to adjust Pc
and Pm value throughout the searching space, that can be a more suitable approach. This approach is known as AGA (adaptive genetic algorithm). Pc and Pm values are adjusted as per the given formula 9 and 10.
(9)
Where,
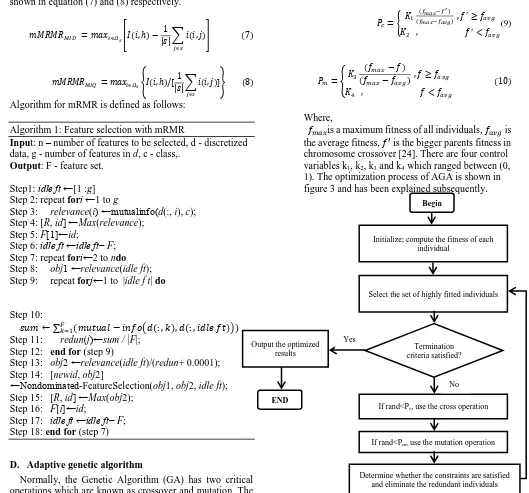
[image:4.595.37.566.100.593.2]is a maximum fitness of all individuals, is the average fitness, is the bigger parents fitness in chromosome crossover [24]. There are four control variables k1, k2, k3 and k4 which ranged between (0, 1). The optimization process of AGA is shown in figure 3 and has been explained subsequently.
Figure 3: AGA Optimization Process
E. mRMRAGA selection
We propose a gene selection approach with after mRMR and AGA, named as mRMRAGA – selection. The AGA fitness has been set to ELM’s classification accuracy with the use of ELM (extreme learning machine) as a classifier. We have set the value of K1, K2, K3, and K4 as 0.9, 0.6, 0.1 and 0.001respectively, and the number of maximum iteration =600 in formula (9) and (10).
Begin
Initialize; compute the fitness of each individual
Select the set of highly fitted individuals
Termination criteria satisfied?
If rand<Pc, use the cross operation
If rand<Pm, use the mutation operation
Determine whether the constraints are satisfied and eliminate the redundant individuals Output the optimized
results
END
Yes
International Journal of Innovative Technology and Exploring Engineering (IJITEE) ISSN: 2278-3075, Volume-8 Issue-10 August, 2019
Assume that A is gene expression dataset that contains samples a1 and genes a2.
The mRMRAGA-selection approach is elaborated as below:
i. Mutual information is computed for all genes of dataset A. The subset B of A is obtained by applying mRMR multiple times. Let the B feature number is 300.
ii. AGA population is initialized, and for all individuals, fitness is computed. As per the problem space, the population size is determined. If the size is large, the AGA search will be easier for an optimal solution but will consume a long time. Here, the population size M=30. Each individual contains many features of B, and the sample size of each gene is equal to a1. iii. 30 individuals are encoded in a population by using
binary coding. After that, each individual resembles a chromosome having a length of 300.
iv. All fitness values are computed for favg,fmax, f’ . v. By setting a threshold, chose a set of individuals who
are highly fitted.
vi. In step (5) the individuals are paired randomly, with the use of cross over operation as per the Pc value for generating a new population.
vii. In order to generate a new population, mutation operation is used as per the Pm value.
viii. Check if the value of current optimal fitness or termination criteria is met. When true, go to step (9); else, go to step (4).
ix. The gene’s optimal subsets are obtained as per the decoding rules.
III. EXPERIMENTS
In this section we emphasis on the experimental verification of the proposed methods. We have chosen the four most frequently used benchmarked datasets. The descriptions of datasets are presented in section 3.1. Experimental settings and other items are described inthe subsequent section.
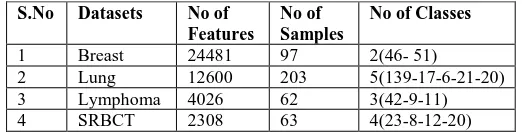
A. Datasets
We have selected four benchmarked gene expression microarray datasets, in order to conduct extensive experiments. All of them are widely used by many researchers in this field and available online. They are Breast
cancer, Lung cancer, Lymphoma cancer and
Small-round-blue-cell tumor (SRBCT) which are shown in table 1. Breast and Lung datasets have been achieved from [25]. Breast cancer dataset contains samples of 97 patients. In this dataset, there are 24481 features and two class labels (46 – normal and 51-tumour). Lung cancer datasets contain samples of 181 patients. In this dataset, there are 12533 features and 5 class labels (139-AD, 17-NL, 6-SMCL, 21- SQ and 20- COID). Where AD represents adenocarcinoma, NL represents normal lung, SMCL represents small cell lung cancer, SQ represents squamous cell carcinoma and COID represents pulmonary carcinoid. Lymphoma microarray dataset has been obtained from [26]. This dataset contains 4026 features and 62 samples. These samples are from 3 different adult lymphoid malignancies (42- DLBCL, 9-FL, and 11-CLL). Where DLBCL represents the diffuse large
[image:5.595.296.557.137.206.2]B-cell lymphoma, FL represents Follicular Lymphoma and CLL represents Chronic Lymphocytic Leukemia. SRBCT dataset was obtained from [27]. This dataset contains 2308 features and 63 samples. These samples belong to 4 classes ( 23 - EWS, 8- NHL, 12- NB and 20- RMS).
Table 1: The characteristics of the four utilized datasets S.No Datasets No of
Features No of Samples
No of Classes
1 Breast 24481 97 2(46- 51)
2 Lung 12600 203 5(139-17-6-21-20)
3 Lymphoma 4026 62 3(42-9-11)
4 SRBCT 2308 63 4(23-8-12-20)
B. Classifiers
In this paper, well-known four classifiers are deployed. The reason for choosing these classifiers is because any specific approach does not work perfectly on all datasets and at the same time, all the classifiers do not work on the same way on a dataset. Here, the deployed classifiers are support vector machine (SVM), back propagation neural network (BPNN), regularized extreme learning machine (RELM) and extreme learning machine (ELM).
IV. RESULTS
Use either SI (MKS) or CGS as primary units. (SI units are strongly encouraged.) English units may be used as secondary units (in parentheses). This applies to papers in data storage. For example, write “15 Gb/cm2 (100 Gb/in2).” An exception is when English units are used as identifiers in trade, such as “3½ in a disk drive.” Avoid combining SI and CGS units, such as current in amperes and magnetic field in oersteds. This often leads to confusion because equations do not balance dimensionally. If you must use mixed units, clearly state the units for each quantity in an equation.
The SI unit for magnetic field strength H is A/m. However, if you wish to use units of T, either refer to magnetic flux density B or magnetic field strength symbolized as µ0H. Use the center dot to separate compound units, e.g., “A·m2.”
We have performed mRMRAGA-selection 10 times for each of the four chosen microarray datasets with a number of selected genes (different target genes). Table 2 demonstrates the results.
Table 2 The number of genes with the application of mRMRAGA selection to the four microarray datasets
Dataset Number of genes
1 2 3 4 5 6 7 8 9 10
Breast 6 23 59 80 125 140 158 168 216 220 Lung 3 42 74 89 122 151 170 186 216 220 Lymphoma 22 28 90 105 120 150 175 203 210 215 SRBCT 27 31 77 96 114 146 168 195 208 215
50 55 60 65 70 75 80 85 90 95 100
0 1 2 3 4 5 6 7 8 9 10
Cl assi fi cation A cc u rac y rate (% )
Gene Expression Data Subset
mRMRAGA ReliefF SFS mRMR 50 55 60 65 70 75 80 85 90 95
0 1 2 3 4 5 6 7 8 9 10
Cl assi fi cation ac cu rac y rate (% )
Gene Expression Data Subset
mRMRAGA
ReliefF
SFS
[image:6.595.313.561.50.199.2]mRMR
Table 3 mRMRAGA-Selection and ELM classification accuracy rates.
Dataset Classification accuracy rates %
1 2 3 4 5 6 7 8 9 10 Breast 82 .47 84 .32 87 .19 85 .12 84 .39 86 .73 92 .31 94 .37 95
.21 95.5 5 Lung 97 .80 92 .00 93 .57 92 .78 94 .43 94 .89 93 .22 93 .33 94
.67 95.0 0 Lympho
ma
95.34 94.80 94.00 92.88 92.00 91.50 90.00 89.32 88. 50
88.2 4 SRBCT 94 .66 95 .80 90 .11 89 .09 86 .36 87 .16 88 .07 88 .98 88
.64 88.5 2
[image:6.595.44.293.93.194.2]We have used three existing feature selection approach in order to demonstrate the effectiveness of the mRMRAGA-Selection approach. These algorithms are mRMR, SFS (sequential forward selection) and ReliefF for the targeted gene on the same datasets. The ELM is applied with the same setting of the three algorithms to the selected feature subsets. Tables 4-6 demonstrate the classification accuracy rate for the same.
Table 4 ReliefF and ELM classification accuracy rates. Dataset Classification accuracy rates %
1 2 3 4 5 6 7 8 9 10 Breast 50 .71 51 .67 52 .33 54
.33
53 .44 52 .81 51 .25
50 .94 50 .31
50.21
Lung 50 .54 51 .54 53 .08 54 .23
59.25 58 .57 57 .50
54 .29 50 .71
50.24
Lymph oma
52.34 53.12 55.30 56.0 0
57.40 56.70 55.3 2
54.38 52.8 6
51.76
SRBCT 58 .32 59.87 68.04 62.5 1
65.39 64.24 63.4 4
60.39 59.6 3
[image:6.595.317.563.216.582.2]58.61
Table 5 SFS and ELM classification accuracy rates.
Dataset Classification accuracy rates %
1 2 3 4 5 6 7 8 9 10 Breast 70 .22 73 .58 74 .48 76
.38
77 .28 78 .59 78 .94 70 .29 74 .22 74.6 7 Lung 83 .27 84 .21 81 .77 83
.27
86 .90 87 .27 82 .38 84 .29 89 .57 90.7 6 Lymph oma
82.65 84.32 83.21 85.1 2
84.73 83.45 84.0 0 86.8 8 85.3 5 85.1 2 SRBCT 81.48 86.77 85.28 86.6
8
82.08 79.27 80.2 6 83.4 3 80.3 3 79.1 2
Table 6 mRMR and ELM classification accuracy rates.
Dataset Classification accuracy rates %
1 2 3 4 5 6 7 8 9 10 Breast 80 .00 70 .59 73 .56 72
.31
75 .65 73 .21
76 .33
73 .89
73 .43 72.8 9 Lung 79 .52 77 .94 77 .22 77
.14
78 .33 77 .22
78 .50
77 .61
77 .62 77.6 1 Lymph
oma
75.64 78.22 77.43 75.2 3
79.88 78.7 0
77.1 2
76.2 1
76.00 75.8 9 SRBCT 86 .82 87 .30 77 .78 79.3
7
85 .71 80 .95
79 .36
79 .68
78 .73 78.7 6
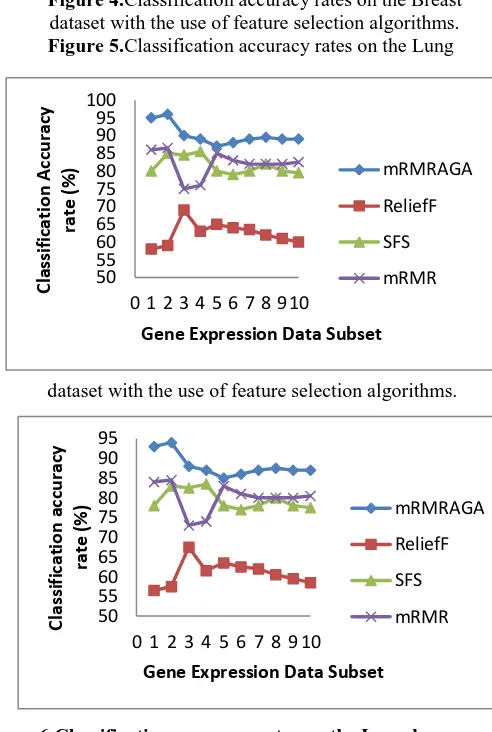
[image:6.595.46.293.312.420.2]Therefore we can say that the classification accuracy rate is higher by mRMRAGA selection compared to the existing algorithm. The classification accuracy comparison is demonstrated for Breast, Lung, Lymphoma and SRBCT datasets in Figure 4-7 accordingly.
Figure 4.Classification accuracy rates on the Breast dataset with the use of feature selection algorithms. Figure 5.Classification accuracy rates on the Lung
dataset with the use of feature selection algorithms.
Figure 6.Classification accuracy rates on the Lymphoma dataset with the use of feature selection algorithms.
50 55 60 65 70 75 80 85 90 95
0 1 2 3 4 5 6 7 8 9 10
Cl assi fi cation A cc u rac y rate(% )
Gene Expression Data Subset
mRMRAGA
ReliefF
SFS
[image:6.595.44.281.451.552.2] [image:6.595.44.280.580.682.2]International Journal of Innovative Technology and Exploring Engineering (IJITEE) ISSN: 2278-3075, Volume-8 Issue-10 August, 2019
Figure 7.Classification accuracy rates on the SRBCT dataset with the use of feature selection algorithms.
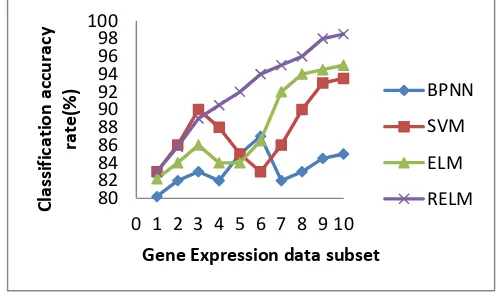
The selected genes effectiveness with the use of mRMRAGA-selection approach, it has demonstrated further. The four well-known classifiers have been used to classify the selected genes by mRMRAG- selection approach. These four well-known classifiers are support vector machine
(SVM), back propagation neural network
[image:7.595.305.552.239.388.2](BPNN),regularized extreme learning machine (RELM) and extreme learning machine (ELM). The classification accuracy for Breast, Lung, Lymphoma, and SRBCT are demonstrated in Figure 8, 9, 10 and 11 respectively.
Figure 8.Classification accuracy rates on Breast dataset using different classifiers.
Figure 9. Classification accuracy rates on the Lung dataset using different classifiers.
[image:7.595.43.293.379.527.2]Figure 10.Classification accuracy rates on the Lymphoma dataset using different classifiers.
Figure 12.Classification accuracy rates on the SRBCT dataset using different classifiers.
It has been observed that the accuracy of the classification may not increase all the time with the increase in gene numbers. The only advantage may be, mapping of genes to class labels will be easier if the numbers of genes are less. The classification rate does not depend on the number of genes. The classification rate depends on the correlation complexity among the genes. The accuracy curve of classification will be more stable if the feature selection approach has a close agreement with the classifier in order to correlation identification. We have observed the RELM is more ideal classifier in this experiment for mRMRAGA-selection approach.
V. CONCLUSION
We propose the hybrid feature selection (mRMRAGA) approach in this paper, which combines mRMR and AGA and named as mRMRAGA-selection. This approach is successfully tested with four well-known classifiers on four
benchmarked gene expression dataset. The
mRMRAGA-selection approach is able to reduce the dimension effectively and reduce the redundancy of the dataset, hence improve the classification accuracy. For example, the dataset having the genes approximately 20000, the mRMRAGA – selection has the capability to reduce the number of genes less than 300 with high classification accuracy.
50 55 60 65 70 75 80 85 90 95 100
0 1 2 3 4 5 6 7 8 9 10
Cl
assi
fi
cation
ac
cu
rac
y
rate
(%
)
Gene Expression Data Subset
mRMRAGA
ReliefF
SFS
mRMR
80 82 84 86 88 90 92 94 96 98 100
0 1 2 3 4 5 6 7 8 9 10
Cl
assi
fi
cation
ac
cu
rac
y
rate(%
)
Gene Expression data subset
BPNN
SVM
ELM
RELM
85 87 89 91 93 95 97 99
0 1 2 3 4 5 6 7 8 9 10
Cl
assi
fi
cation
r
ate
(%
)
Gene Expression data subset
BPNN
SVM
ELM
RELM
85 87 89 91 93 95 97 99
0 1 2 3 4 5 6 7 8 9 10
Cl
as
si
fi
cat
ion
acc
u
racy
rate
(%
)
Gene Expression data subset
BPNN
SVM
ELM
RELM
85 87 89 91 93 95 97 99
0 1 2 3 4 5 6 7 8 9 10
Cl
as
si
fi
cat
ion
acc
u
racy
rate
(%
)
Gene Expression data subset
BPNN
SVM
ELM
[image:7.595.45.291.573.722.2]The classification accuracy rate was compared with four classifiers as shown in the previous section.
REFERENCES
1. Heller, Michael J. "DNA microarray technology: devices, systems, and applications." Annual review of biomedical engineering 4.1 (2002): 129-153.
2. Li, Shaoguang, and Dongguang Li. DNA microarray technology and data analysis in cancer research. World Scientific, 2008.
3. Cosma, Georgina, et al. "A survey on computational intelligence approaches for predictive modeling in prostate cancer." Expert systems with applications 70 (2017): 1-19.
4. Rabindra Kumar Singh, and M. Sivabalakrishnan. "Feature selection of gene expression data for cancer classification: a review." Procedia Computer Science 50 (2015): 52-57.
5. Wang, Lipo. "Feature selection in bioinformatics." Independent Component Analyses, Compressive Sampling, Wavelets, Neural Net, Biosystems, and Nanoengineering X. Vol. 8401. International Society for Optics and Photonics, 2012.
6. Song, Qinbao, Jingjie Ni, and Guangtao Wang. "A fast clustering-based feature subset selection algorithm for high-dimensional data." IEEE transactions on knowledge and data engineering 25.1 (2011): 1-14. 7. Liu, Shenghui, et al. "Feature selection of gene expression data for
Cancer classification using double RBF-kernels." BMC bioinformatics 19.1 (2018): 396.
8. Saeys, Yvan, IñakiInza, and Pedro Larrañaga. "A review of feature selection techniques in bioinformatics." bioinformatics23.19 (2007): 2507-2517.
9. Hira, Zena M., and Duncan F. Gillies. "A review of feature selection and feature extraction methods applied on microarray data." Advances in bioinformatics 2015 (2015).
10. Lazar, Cosmin, et al. "A survey on filter techniques for feature selection in gene expression microarray analysis." IEEE/ACM Transactions on Computational Biology and Bioinformatics (TCBB) 9.4 (2012): 1106-1119.
11. Hameed, Shilan S., et al. "Filter-Wrapper Combination and Embedded Feature Selection for Gene Expression Data." Int. J. Advance Soft Compu. Appl 10.1 (2018).
12. Saeys, Yvan, IñakiInza, and Pedro Larrañaga. "A review of feature selection techniques in bioinformatics." bioinformatics23.19 (2007): 2507-2517.
13. Xiong, Momiao, Xiangzhong Fang, and Jinying Zhao. "Biomarker identification by feature wrappers." Genome Research 11.11 (2001): 1878-1887.
14. Santana, Laura Emmanuella A. dos S., and Anne M. de Paula Canuto. "Filter-based optimization techniques for selection of feature subsets in ensemble systems." Expert Systems with Applications 41.4 (2014): 1622-1631.
15. Bolón-Canedo, Verónica, et al. "A review of microarray datasets and applied feature selection methods." Information Sciences 282 (2014): 111-135.
16. Ding, Chris, and Hanchuan Peng. "Minimum redundancy feature selection from microarray gene expression data." Journal of bioinformatics and computational biology 3.02 (2005): 185-205. 17. Hoque, Nazrul, Dhruba K. Bhattacharyya, and Jugal K. Kalita.
"MIFS-ND: A mutual information-based feature selection method." Expert Systems with Applications 41.14 (2014): 6371-6385. 18. Deb, Kalyanmoy, et al. "A fast elitist non-dominated sorting genetic
algorithm for multi-objective optimization: NSGA-II." International conference on parallel problem solving from nature. Springer, Berlin, Heidelberg, 2000.
19. Ghalwash, Mohamed F., et al. "Structured feature selection using coordinate descent optimization." BMC bioinformatics17.1 (2016): 158. 20. Jakobović, Domagoj, and Marin Golub. "Adaptive genetic algorithm." Journal of computing and information technology7.3 (1999): 229-235.
21. Cover, Thomas M., and Joy A. Thomas. "Entropy, relative entropy and mutual information." Elements of information theory 2 (1991): 1-55. 22. Battiti, Roberto. "Using mutual information for selecting features in
supervised neural net learning." IEEE Transactions on neural networks 5.4 (1994): 537-550.
23. Paul, Topon Kumar, and Hitoshi Iba. "Extraction of informative genes from microarray data." Proceedings of the 7th annual conference on Genetic and evolutionary computation. ACM, 2005.
24. Montana, David J., and Lawrence Davis. "Training Feedforward Neural Networks Using Genetic Algorithms." IJCAI. Vol. 89. 1989.
25. Zhu, Zexuan, Yew-Soon Ong, and Manoranjan Dash. "Markov blanket-embedded genetic algorithm for gene selection." Pattern Recognition 40.11 (2007): 3236-3248.
26. Dettling, Marcel, and Peter Bühlmann. "Supervised clustering of genes." Genome biology 3.12 (2002): research0069-1.
27. Díaz-Uriarte, Ramón, and Sara Alvarez De Andres. "Gene selection and classification of microarray data using random forest." BMC bioinformatics 7.1 (2006): 3.
AUTHORSPROFILE
Prof. Rabindra Kumar SinghWorking as Assistant Professor (Selection Grade ) in School of Computing Science and Engineering at VIT Chennai Campus since 2013. He has 20 years of Teaching Experience and 4 years of Industry experience. He has completed M.E. in Computer Science and Engineering from Anna University Chennai. He is interested in teaching the subject like Operating System, Computer Network, Data Mining, Software Project Management, Distributed Computing, Python Programming, R Tools, etc. His area of research is Machine Learning, Data Mining, and Bioinformatics.