International Journal of Innovative Technology and Exploring Engineering (IJITEE) ISSN: 2278-3075,Volume-8, Issue-8, June 2019
Abstract: Nowadays Ethiopian Market is carried out in a customary way & market drivers are as yet not utilized for a forecast of price of the long run value. In spite of the fact that a lot of market information has been collected all through years by each governmental and non-governmental organizations, nonetheless very little has been done to analyze the data for future value prediction. Moreover, the analysismethods were often manual creating inefficiency in time and quality of market prediction.Analyzing valuable data will show us what the future holds and accelerate the development goalsof the country in the sector. The study examines features of current Ethiopian market attributesto find out the most valuable features for predicting the market price. Eighteen technical indicators aretaken and tested for their individual ability of prediction and redundancy. From the featureselection of commodity market, we have found that features like Stochastic %K, Stochastic %D,Close gain/loss, High, close price, Opening Price, Low, RSI, Ton and Moving AverageConvergence/ divergence (MACD) founded to be in the top ten of individual performanceevaluation. Moreover features namely Stochastic %K, Relative Strength Index (RSI), BollingerBands-Upper, Highest-High, close gain/loss, Simple Moving Average (SMA), Closing price,MACD-Fast, Exponential Moving Average (EMA), MACD-Slow and Low founded to be lessredundant. The study also compares four machine learning frameworks or models for their prediction ability ofEthiopian commodity market price. The outcomes of feature selection were used to compare themodels. Two experiments were conducted; the first was a comparison of the models with 10 fold cross-validation using the feature of high individual predictive ability and less redundancy. Thesecond one was a comparison of models with separate train and test data using features of highindividual predictive ability and less redundancy. From the models (Support Vector Machine(SVM), Artificial Neural Network (ANN), K-Nearest Neighbor (K-NN) and Ensemble Learning)the performance of ANN and Ensemble Learning algorithms are shown to be accurate than SVMand K-NN.
Index Terms: Attribute; Feature selection; Machine Learning Algorithms; Price prediction; Technical Indicators;
I. INTRODUCTION
Market prediction using different analysis techniques is regularly practiced in modern marketing systems by collecting and analyzing different market information [1]. Traders in any part of the world are interested in a market that is profitable and uses different Technical indicators, macroeconomic factor, and stock market indexes to study the market [9]. These numerous market drivers’ information
Revised Manuscript Received on June 14, 2019
Amanuel Getachew Bulti,Electrical and Computer Engineering Department, College of Engineering, Mizan Tepi University/ Tepi, Ethiopia.
Dr. Abhishek Ray, School of Computer Engineering, Kalinga Institute of Industrial Technology Deemed to be University/ Bhubaneswar, India.
which reflects the existing market price characteristics and facilitates prediction of future market price characteristics [2]. As a result, we can prevent anticipated negative changes in the market due to new information about the market. However, market analysis is not a common practice in Ethiopia and is often carried out using traditional tools and manual practices making the processing time taking and prone to errors.
In the context of Ethiopia, to our knowledge market data has not been analyzed in an automated manner and no structured market conceptual framework exists. As a result, traders are forced to take a huge business risk and are scared to invest because of business uncertainty. Recently, Ethiopian commodity exchange (ECX) started hosting a commodity market. Every day Ethiopian Commodity Exchange (ECX) disseminates market information on coffee, beans, sesame and grains in real-time bases and offering contracts for further delivery. Although, such systems can be appreciated to a certain extent sufficient data analytical activities are not employed to predict future market price scenarios resulting in market uncertainty [7].
Traders are still seeking market analysis which indicates future opportunities and reduces business risk. To explore the information inaccurate way we can encode the data into technical indicators and be classified using known classification techniques. Learning from other countries experience using the advantage of computational algorithms is one way to solve the problem. Computational algorithms can be used to find patterns in data. The output of computational algorithms then can be used to predict the future market price of goods in Ethiopian. The study aims to identify market features which influence the prediction of Ethiopian market price. Besides, it explores different computational algorithms that are more efficient in predicting market price in Ethiopia.
II. PROBLEMSTATEMENT
The current goods market in the political capital of African nation known as Ethiopia is organized and carry out in the manual (customary) way & likewise, the market information is as yet not utilized for the forecast of future commodity exchange value.
In spite of the fact that an outsized quantity of market information is assembled during the time by each government and non-government organizations, however very little has been done to analyze the data and use it for future market price prediction.
Commodity Market Price Analysis and
Prediction using Machine Learning Framework
Traders start a business without appropriate current and future market information. Even in governmental sectors, the data collected on goods price is just left as it is without further treatment or analysis for future development or action. The analyses performed so far are in small size and manually, which is time taking and prone to human errors. In most cases, the approach followed fails to do the work effectively and are affected by different human factors. In this study, we particularly investigate,
Which Ethiopian market features are most useful in
predicting future market price?
We selected four machine learning models namely:
SVM, ANN, K-NN and Ensemble Learning. Which model is more accurate for predicting future market price of Ethiopian?
III. PURPOSE
The purpose of this study, in general, is to analyze existing market data and predict Ethiopian market price for key marketed commodities. The data gathered from different governmental and non-governmental sectors will be analyzed to come up with a more accurate prediction of the commodity market price in Ethiopia. Identify the most valuable market features for predicting future market price in Ethiopia.From the selected machine learning models we identify which model better suits the market situation and prediction of Ethiopian market price.
IV. PROPOSEDTECHNIQUES
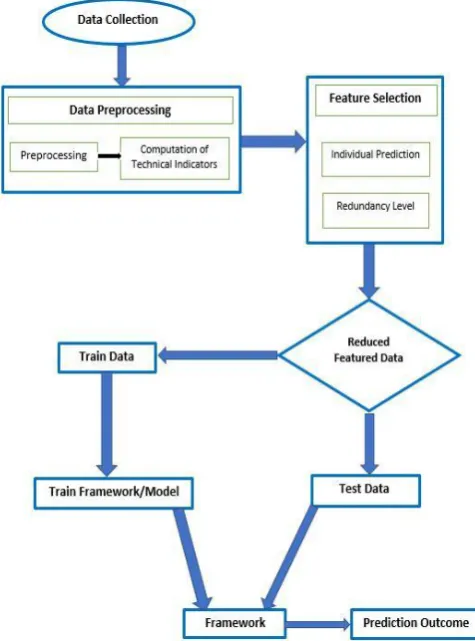
The proposed methodology showed in Fig. 1 starts with data
collection and the data were preprocessed and technical indicators were computed and included in the original dataset from Ethiopia Commodity Exchange organization. The newly formed dataset was used as an input for feature selection.
The features were selected based on their high predictive abilities of individual features and for a lower level of redundancy. Then the selected features were used to train and test the four machine learning models. Lastly, the models were compared and best performing predictive machine learning models were used to predict commodity prices. All the data for these work is collected from ECX contains daily opening and closing price of pea bean, coffee, and sesame. Historical price of the three commodities from 2008 up to 2016 is used for the experiment. The datasets were checked for completeness and correctness of the required attributes and integrity before analysis and prediction. The data contained 94,993 rows in which the majority of the records are of coffee, which were around 72,160. Sesame and pea beans have 18,021 and 4,812 rows respectively. Form the data we can understand that the coffee trade is conducted throughout the year but the other two crops are seasonal and the trade of these commodities takes place only in a few months of the year. The data from ECX contains 6 columns and in addition to those attribute, the computed attributes are included. The attributes explored for the study are described in Table 1.
The principal goal of this research is to analyze existing market data of Ethiopia and predict market price using computational algorithms. With this in mind, the study
[image:2.595.308.546.102.423.2]objective was to discover which machine learning technique is better in predicting future Ethiopian stock market opportunity and price. The machine learning techniques selected for this research were SVM, K-NN, ANN and
Figure 1: Architecture of Proposed Techniques
Ensemble Learning. Each was selected based on their advantages and past performance seen in other research.
Table 1: The initial 24 potential features that may be used for the feature selection
Attribute Description 1 Trade Date Date of trade
2 Closing Price The final price the commodity is sold with
3 High The highest price is given by bidders
4 Low The lowest price is given by bidders
5 Ton The volume of the commodity provided for bid
6 Opening Price Opening price stated by the bidder
7 EMA Exponential Moving Average
8 Close Gain/Loss The Gain or Loss from the previous day market
9 RSI Relative Strength Index
10 SMA_20 Simple Moving Average of 20 days
11 SMA Simple Moving Average
12 BB-Upper Upper Bollinger Bands
13 BB-Lower Lower Bollinger Bands
14 MACD Fast Fast Moving Average Convergence/Divergence
15 MACD Slow Slow Moving Average Convergence/Divergence
16 MACD Moving Average Convergence/Divergence
17 MACD Signal Moving Average Convergence/Divergence
18 Highest High The highest high over the lookup period
[image:2.595.305.553.489.828.2]International Journal of Innovative Technology and Exploring Engineering (IJITEE) ISSN: 2278-3075,Volume-8, Issue-8, June 2019
20 Stochastic %K Calculated with other quantity %D
21 Stochastic %D Sample moving average of %K
22 20-Days Mean Deviation 20 days mean deviation
Support vector machine is selected due to the following reasons; (1) Data classification could be performed without making strong assumptions; (2) SVM is established on the structural risk minimization principle, which seeks to minimize an upper bound of generalization error, and is shown to be very resistant to the over-fitting problem [10] and (3) SVM model is a linearly constrained quadratic program so that the solution of SVM is always globally optimal, while other models may tend to fall into a locally optimal solution [10][11]. Artificial neural network is included in these work because; (1) A neural network can be used to solve linear as well as non-linear programming tasks [5], (2) As a component of an ANN fails, the net continues to operate (based on its highly parallel nature) [5] [11], (3) A neural network learns and does not have to be re-programmed [3] [4] [12] and (4) An ANN can be used to solve classification, clustering, and regression related problems [6] [11]. Ensemble Learning is included in these work because [7]; (1) Ensemble learning is combined predictions from multiple models so the results are more diversified and (2) More robust estimate of a statistical quantity with a low bias and a high variance. K-nearest Neighbor is selected because; (1) The cost of the learning process is zero, (2) Learning does not require making any assumption about the characteristics of the concepts [8] and (3) Complex concepts can be learned by local approximation using simple procedures [8].
To compare the outcome or result we used 10 fold cross validation method provided in weka (this means that the dataset is split into 10 parts, the first 9 are used to train the algorithm, and the 10th is used to assess the algorithm. And also this process was repeated giving each of the 10 parts of the split dataset a chance to be the held-out test set) and Separate training and testing set was prepare will contain a data of different year (2008-2015) that is not used for training.
To see the applicability and performance of the above Machine learning techniques different metrics will be used. The effectiveness of classification algorithms may depend on a number of factors like quality of information the attributes provide, the class distribution of the dataset and the number of instances. Such factors were addressed in the feature selection stage and have less impact on the performance of the machine learning techniques. The following performance metrics are provided by Weka 3.9.3 and were used for measuring the performance of machine learning techniques.
(1) Correlation coefficient:measures how strong a
relationship is between two variables. (2) Mean absolute
error:measure the average magnitude of the errors in a set of prediction, without considering the direction. It expresses the average model prediction error in units of the variable of
interest. (3) Root Mean Squared error: is a quadratic
scoring rule that also measures the average magnitude of the error. It is the square root of the average of squared
differences between predicted and actual value.(4)
RelativeAbsolute error:itisrelativetoasimplepredictor,wh ichisjusttheaverageofactual values. It takes the total absolute
error and normalizes it by dividing by the total absolute error of the simplepredictor.
For this paper, we plan to use weka 3.9.3 with explorer GUI which is a data mining tool. The tool is enriched with different classifiers, clustering, and attributes selection methods. For feature individual predictive ability evaluation purpose we will use ReliefFAttributeEval (Can operate on evaluations of an attribute by repeatedly sampling instance on both discrete and continuous class data) and for redundancy check we use CfsSubsetEval (Evaluates the worth of a subset attributes by considering the individual predictive ability of each feature along with the degree of redundancy between them). Subsets of features that are highly correlated with the class while having low inter-correlation are preferred.
V. EXPERIMENTALRESULTSANDDISCUSSION
Market prices of goods in Ethiopia have been collected formally and informally by different authorities. An accumulated data of the market can give us most of the information to formulate and direct future market and enables us to see different market opportunities. The traditional way of analyzing the market is time taking and labor intensive. In most cases, this approach fails to do the work effectively and affected by human factors. To address the indicated problems, we proposed to encode the data into technical indicators and use Machine learning algorithms. To see if the proposed methodology holds, we conducted an investigation using the Ethiopian commodity market data. In particular, we investigated the following research questions (RQ).
RQ 1 [Feature Selection] Does every market features have
equal significance in predicting Ethiopian
commoditymarket? In this RQ, we investigated if every market feature has significance in predicting Ethiopian commodity market. The two activities were done separately and they are not sequential. 1) Checking for individual feature predictionability and 2) Redundancy within thefeatures.
RQ 2 [Machine Learning comparison] which machine learning algorithms give a better prediction? In this RQ, we investigated if every machine learning algorithms has equal performance in predicting the future market price. Using the results from feature selection we check for the performance of some selected prediction algorithm.
i. Future Selection (RQ1 demonstration):
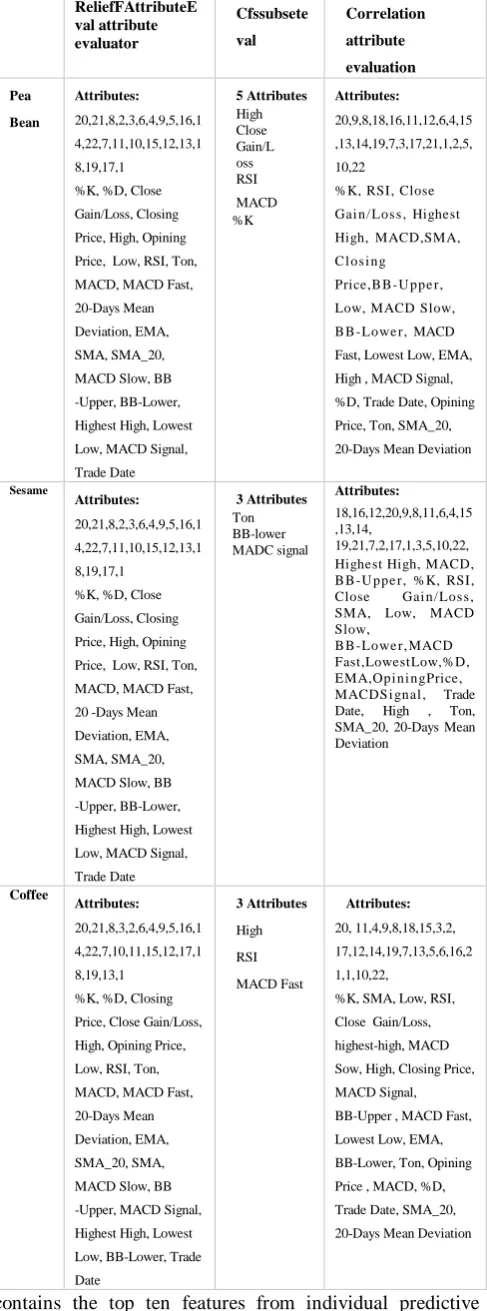
The result from ReliefFAttributeEval and correlation attribute selection included 22 attributes which were ranked based on their predictive ability and redundancy level in
ascending order respectively see Table 2. The results from
We limit the number of features to 10 because of the computational cost and processing time needed for prediction using the entire feature is high. The first group
contains the top ten features from individual predictive ability and the second group contains the top ten features which were found less redundant.
ii. Machine Learning Models Comparison (RQ2):
[image:4.595.50.294.92.748.2]The four Machine learning models (SVM, ANN, K-NN and ensemble Learning) were used to predict the data on the three selected commodities (coffee, sesame, pee bean). For modeling the machine learning algorithms we used 10 fold cross-validation and a separate training and test set. These evaluations are done using the features from the feature selection stage.
Table 2: Features in order of importance, from higher to lower and Features in order of redundancy, from lower to higher
respectively
10 fold crossvalidation: Group 1: the first group contains the top ten attributes from the results of individual prediction ability. (%K, %D, Close gain/loss, High, close price, Opening Price, Low, RSI, Ton, and MACD). The 10 fold cross validation result indicated that Ensemble Learning prediction recorded the lowest MAE Value of 5.8243, followed by ANN (6.1945) and SVM (6.5017).
Contrastingly, machine learning algorithm K-NN recorded an extremely higher MAE (20.8365) indicating the least predictive ability of the model to predict the price of the
studied Ethiopian market commodities (Table 3). The
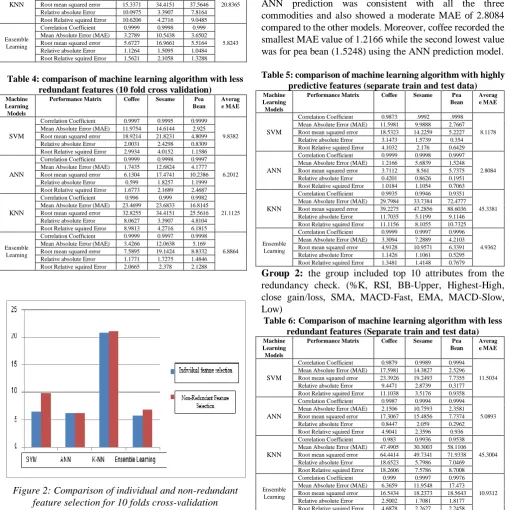
results for the Ensemble Learning prediction was consistent with all the three commodities and also showed a moderated MAE compared to the other models while MAE values were not consistent across the commodities. Pea bean price prediction using SVM recorded the smallest MAE of 1.3197 followed by MAE value 1.7435 for coffee using ANN. The prediction for commodity sesame has recorded the highest
MAE for all prediction models except for K_NN (Table3).
Group 2: the group includes comparing prediction models using the selected top ten attributes from a redundancy check. (%K, RSI, BB-Upper, Highest-High, close gain/loss, SMA, Closing price, MACD-Fast, EMA, MACD-Slow, Low) From Table 4 we computed the average MAE for the four models across the three commodities. We found that the average MAE to be 9.3383 for SVM, 6.2012for ANN, 21.1125 for K-NN and 6.8864 for Ensemble Learning. Based on the average value ANN takes the first place.
Ensemble learning prediction showed a closer result to the ANN model, while SVM and K-NN showed relatively increased average MAE rate. The smallest MAE (1.7435) was recorded for ANN prediction model in coffee which is similar to the result obtained using top ten predictive features shown in Table 4 followed by MAE of 2.925 recorded for pea bean using SVM.
In Fig. 2 below showed that the performance of the top 10 features from individual feature selection has exceeded over the non-redundant features for the SVM and Ensemble Learning. For the model K-NN, the difference was marginal and for the case of ANN, it was found insignificant. On average we can say that the features from Individual feature selection have superiority over the non-redundant features.
ReliefFAttributeE val attribute evaluator Cfssubsete val Correlation attribute evaluation Pea Bean Attributes: 20,21,8,2,3,6,4,9,5,16,1 4,22,7,11,10,15,12,13,1 8,19,17,1
%K, %D, Close Gain/Loss, Closing Price, High, Opining Price, Low, RSI, Ton, MACD, MACD Fast, 20-Days Mean Deviation, EMA, SMA, SMA_20, MACD Slow, BB -Upper, BB-Lower, Highest High, Lowest Low, MACD Signal, Trade Date 5 Attributes High Close Gain/L oss RSI MACD %K Attributes: 20,9,8,18,16,11,12,6,4,15 ,13,14,19,7,3,17,21,1,2,5, 10,22
%K, RSI, Close Gai n/ Los s , Highest High, MACD,SMA, C l os i ng
Price,B B -U ppe r, Low, MACD Slow, B B -Lowe r, MACD Fast, Lowest Low, EMA, High , MACD Signal, %D, Trade Date, Opining Price, Ton, SMA_20, 20-Days Mean Deviation
Sesame
Attributes:
20,21,8,2,3,6,4,9,5,16,1 4,22,7,11,10,15,12,13,1 8,19,17,1
%K, %D, Close Gain/Loss, Closing Price, High, Opining Price, Low, RSI, Ton, MACD, MACD Fast, 20 -Days Mean Deviation, EMA, SMA, SMA_20, MACD Slow, BB -Upper, BB-Lower, Highest High, Lowest Low, MACD Signal, Trade Date 3 Attributes Ton BB-lower MADC signal Attributes: 18,16,12,20,9,8,11,6,4,15 ,13,14, 19,21,7,2,17,1,3,5,10,22, Highest High, MACD, B B -U ppe r, %K, RSI, Close Gai n/ Los s , SMA, Low, MACD Slow,
B B -Lowe r, MACD Fast,LowestLow,%D, EMA,Opi ni ngPrice, MACDS i gnal , Trade Date, High , Ton, SMA_20, 20-Days Mean Deviation Coffee Attributes: 20,21,8,3,2,6,4,9,5,16,1 4,22,7,10,11,15,12,17,1 8,19,13,1
%K, %D, Closing Price, Close Gain/Loss, High, Opining Price, Low, RSI, Ton, MACD, MACD Fast, 20-Days Mean Deviation, EMA, SMA_20, SMA, MACD Slow, BB -Upper, MACD Signal, Highest High, Lowest Low, BB-Lower, Trade Date 3 Attributes High RSI MACD Fast Attributes: 20, 11,4,9,8,18,15,3,2, 17,12,14,19,7,13,5,6,16,2 1,1,10,22,
International Journal of Innovative Technology and Exploring Engineering (IJITEE) ISSN: 2278-3075,Volume-8, Issue-8, June 2019
Table 3: Comparison of machine learning algorithm with highly predictive features (10 fold cross validation) Machine
Learning Models
Performance Matrix Coffee Sesame Pea Bean
Averag e MAE
SVM
Correlation Coefficient 0.9989 0.9997 1
6.5017 Mean Absolute Error (MAE) 7.4722 10.7132 1.3197 Root mean squared error 11.4213 17.1327 3.399 Relative absolute Error 1.1123 1.8337 0.379 Root Relative squired Error 2.3219 2.5259 0.8186
ANN
Correlation Coefficient 0.9999 0.9997 0.999
6.1945 Mean Absolute Error (MAE) 1.7435 13.6394 3.2007 Root mean squared error 6.1304 20.6303 5.9318 Relative absolute Error 0.599 1.9527 0.9193 Root Relative squired Error 1.6773 2.5609 1.4288
KNN
Correlation Coefficient 0.9943 0.9991 0.9959
20.8365 Mean Absolute Error (MAE) 11.6119 23.6833 27.2145 Root mean squared error 15.3371 34.4151 37.5646 Relative absolute Error 10.0975 3.3907 7.8164 Root Relative squired Error 10.6206 4.2716 9.0485
Ensemble Learning
Correlation Coefficient 0.9999 0.9998 0.999
5.8243 Mean Absolute Error (MAE) 3.2789 10.5438 3.6502 Root mean squared error 5.6727 16.9661 5.5164 Relative absolute Error 1.1264 1.5095 1.0484 Root Relative squired Error 1.5621 2.1058 1.3288
Table 4: comparison of machine learning algorithm with less redundant features (10 fold cross validation) Machine
Learning Models
Performance Matrix Coffee Sesame Pea Bean
Averag e MAE
SVM
Correlation Coefficient 0.9997 0.9995 0.9999
9.8382 Mean Absolute Error (MAE) 11.9754 14.6144 2.925 Root mean squared error 18.9214 21.8231 4.8099 Relative absolute Error 2.0031 2.4298 0.8309 Root Relative squired Error 2.9934 4.0152 1.1586
ANN
Correlation Coefficient 0.9999 0.9998 0.9997
6.2012 Mean Absolute Error (MAE) 1.7435 12.6824 4.1777 Root mean squared error 6.1304 17.4741 10.2386 Relative absolute Error 0.599 1.8257 1.1999 Root Relative squired Error 1.6773 2.1689 2.4687
KNN
Correlation Coefficient 0.996 0.999 0.9982
21.1125 Mean Absolute Error (MAE) 23.4699 23.6833 16.8145 Root mean squared error 32.8255 34.4151 25.5616 Relative absolute Error 8.0627 3.3907 4.8104 Root Relative squired Error 8.9813 4.2716 6.1815
Ensemble Learning
Correlation Coefficient 0.9999 0.9997 0.9998
6.8864 Mean Absolute Error (MAE) 3.4266 12.0638 5.169 Root mean squared error 7.5895 19.1424 8.8332 Relative absolute Error 1.1771 1.7275 1.4846 Root Relative squired Error 2.0665 2.378 2.1288
Figure 2: Comparison of individual and non-redundant feature selection for 10 folds cross-validation
Experiments with Separate Training and Testdata: In this section separate train and test set were prepared for the experiment to test the prediction models. The test set contained data of different year that was not used for training. Prediction model comparison for coffee and pea bean were made using 84 % of the data for training and the other 16% for testing purpose, while the proportion for
sesame was 74% for training and 26% for testing. The proportion differs for the three data set because of the difference in the amount of the collected data.
Group 1: the first group contained the top ten attributes from the results of individual prediction ability. (%K, %D, Close gain/loss, High, close price, Opening Price, Low, RSI, Ton, and MACD)
From Table 5 computed the average MAE for the four
[image:5.595.43.555.186.696.2]models across the three commodities. We found the average MAE to be 8.1178 for SVM, 2.8084 for ANN, 45.3381 for K-NN and 4.9362 for Ensemble Learning. The results for the ANN prediction was consistent with all the three commodities and also showed a moderate MAE of 2.8084 compared to the other models. Moreover, coffee recorded the smallest MAE value of 1.2166 while the second lowest value was for pea bean (1.5248) using the ANN prediction model.
Table 5: comparison of machine learning algorithm with highly predictive features (separate train and test data) Machine
Learning Models
Performance Matrix Coffee Sesame Pea Bean
Averag e MAE
SVM
Correlation Coefficient 0.9873 .9992 .9998
8.1178 Mean Absolute Error (MAE) 11.5981 9.9888 2.7667 Root mean squared error 18.5323 14.2259 5.2227 Relative absolute Error 3.1473 1.5739 0.354 Root Relative squired Error 4.1032 2.176 0.6429
ANN
Correlation Coefficient 0.9999 0.9998 0.9997
2.8084 Mean Absolute Error (MAE) 1.2166 5.6839 1.5248 Root mean squared error 3.7112 8.561 5.7375 Relative absolute Error 0.4201 0.8626 0.1951 Root Relative squired Error 1.0184 1.1054 0.7063
KNN
Correlation Coefficient 0.9935 0.9946 0.9351
45.3381 Mean Absolute Error (MAE) 29.7984 33.7384 72.4777 Root mean squared error 39.2275 47.2856 88.6036 Relative absolute Error 11.7035 5.1199 9.1146 Root Relative squired Error 11.1156 8.1055 10.7325
Ensemble Learning
Correlation Coefficient 0.9999 0.9997 0.9996
4.9362 Mean Absolute Error (MAE) 3.3094 7.2889 4.2103 Root mean squared error 4.9128 10.9571 6.3391 Relative absolute Error 1.1426 1.1061 0.5295 Root Relative squired Error 1.3481 1.4148 0.7679
Group 2: the group included top 10 attributes from the redundancy check. (%K, RSI, BB-Upper, Highest-High, close gain/loss, SMA, MACD-Fast, EMA, MACD-Slow, Low)
Table 6: Comparison of machine learning algorithm with less redundant features (Separate train and test data) Machine
Learning Models
Performance Matrix Coffee Sesame Pea Bean
Averag e MAE
SVM
Correlation Coefficient 0.9879 0.9989 0.9994
11.5034 Mean Absolute Error (MAE) 17.5981 14.3827 2.5296 Root mean squared error 23.3926 19.2493 7.7355 Relative absolute Error 9.4471 2.8739 0.3177 Root Relative squired Error 11.1038 3.5176 0.9358
ANN
Correlation Coefficient 0.9987 0.9994 0.9994
5.0893 Mean Absolute Error (MAE) 2.1506 10.7593 2.3581 Root mean squared error 17.3067 15.4856 7.7374 Relative absolute Error 0.8447 2.059 0.2962 Root Relative squired Error 4.9041 2.3596 0.936
KNN
Correlation Coefficient 0.983 0.9936 0.9538
45.3004 Mean Absolute Error (MAE) 47.4905 30.3003 58.1106 Root mean squared error 64.4414 49.7341 71.9338 Relative absolute Error 18.6523 5.7986 7.0469 Root Relative squired Error 18.2606 7.5786 8.7008
Ensemble Learning
Correlation Coefficient 0.999 0.9997 0.9976
10.9312 Mean Absolute Error (MAE) 6.3659 11.9548 17.473 Root mean squared error 16.5434 18.2373 18.5643 Relative absolute Error 2.5002 1.7081 1.8177 Root Relative squired Error 4.6878 2.2627 2.2458
The results for the ANN prediction recorded the lowest MAE of for all commodities studied as well as the overall smallest of MAE (2.1506) for coffee. Moreover, the result of coffee and Pea bean which is recorded small was seen for the model. ANN. Ensemble learning, SVM and K-NN were rankedrespectively.
In belowFig. 3 shows the performance of the top 10 features
from individual feature selection has exceeded over the non-redundant features for the SVM, ANN and Ensemble Learning. For the model K-NN, the difference was insignificant. On average we can say that the features from Individual feature selection have superiority over the non-redundant features.
[image:6.595.298.549.72.277.2]In this work, the four machine learning models have been analyzed and applied to the commodity price data. The best performance was achieved by ANN, while K-NN model had the worst performance on the commodity market data.
Figure 3: Comparison of individual and non-redundant feature selection for separate train test set
Ensemble Learning and SVM show comparable
performance. The models ANN, Ensemble Learning and SVM achieve an average MAE of 5.0733, 7.1445 and 8.9902 respectively. A direct comparison of our work with other literature may be difficult. Most of the works of literature ware done using a combination Stock market Index’s, macroeconomic inputs and technical indicators. Our work was limited to technical indicators due to the unavailability of macroeconomic inputs and un-introduction of Stock market.
Prediction Values for ANN and Ensemble Learning: The experiments results showed in the above section separate the three models (ANN, Ensemble learning and SVM) with minimum MAE difference. The analysis of variance showed that these prediction models were significantly different (p=0.05) MAE values. Prediction models (ANN, Ensemble learning and SVM) recorded significantly lower MAE as compared to K_NN indicating that the model has the lowest prediction performance for the studied commodities. Meanwhile, ANN, Ensemble Learning and SVM can be used for predicting the price of the commodities as the MAE value difference among them was insignificant. In the current study market price for 5 days ahead was predicted using the top two modelsANN and Ensemble Learning. The prediction used highly predictive features as they are shown a better performance when compared to less redundant features (see
Fig. 2 and Fig. 3). Following are the price prediction results for the three commodities namely; coffee, sesame, and pea bean. The predictive prices for the selected models showed in
Table7.
Table 7: Prediction values for ANN and Ensemble Learning
Days Actual Predicted for
ANN
Predicted for Ensemble Learning
Pea Bean
Day 1 825 824.89 829.39 Day 2 760 759.91 756.08 Day 3 885 885.09 880.45 Day 4 858 854.23 854.42 Day 5 945 944.99 945.44
Seasame Day 1 2700 2676.98 2680.5
Day 2 227 225183 2275.79 Day 3 3370 3376.89 3370.45 Day 4 3320 3314.24 3310.7 Day 5 2670 2631.93 2645.49
Coffee Day 1 1030 1024 1021
Day 2 796 795 802 Day 3 1400 1406 1402 Day 4 1178 1178 1177 Day 5 760 756 757
VI. CONCLUSION
The paper raised two research questions and performs the research activity. The first question is to examinethe features of current Ethiopian market attributes to find out the most valuable features for predicting the market price. We have considered and computed 18 technical indicators. The computed indicators are taken as a feature. Then we have evaluated for features of individual predictive ability and the redundancy level. From the feature selection of commodity market, we have found that features like (%K, %D, Close gain/loss, High, close price, Opening Price, Low, RSI, Ton and MACD founded in the top ten of individual performance evaluation. Moreover features namely %K, RSI, BB-Upper, Highest-High, close gain/loss, SMA, Closing price, MACD-Fast, EMA, MACD-Slow and Low founded less redundant from the given dataset. These results are categorized into two groups and used as an input for the machine learningalgorithms.
The second question was a comparison of machine learning models that better predict the market price. The outcomes of feature selection were used to compare the models. We conduct two experiments; the first was a comparison of the models with 10 fold cross-validation using a feature of individual predictive ability and less redundancy. The second one was a comparison of models with separate train and test data using a feature of individual predictive ability and less redundancy. From the models (SVM, ANN, K-NN and Ensemble Learning) the performance of ANN and Ensemble Learning algorithms were showed superior on SVM and K-NN. The average MAE rate of the ANN was found to be 5.0733. Ensemble Learning and SVM follows with MAE rate 7.1445 and 8.9902 respectively. The K-NN model was the least performer with the MAE rate of 33.2964.
ACKNOWLEDGMENT
[image:6.595.50.288.259.430.2]International Journal of Innovative Technology and Exploring Engineering (IJITEE) ISSN: 2278-3075,Volume-8, Issue-8, June 2019
Thus, I am enormously elated and appreciative to my consultant Dr. Abhishek Ray, who had upheld. By him, I need to be grateful for my co-advisor Dr. Prachet Bhuyan. And furthermore, I am appreciative my family GM-ASD, Addisu Raga (Ph.D.) and friends.
REFERENCES
1. Subha, M.V., and S. ThirupparkadalNambi. "Classification of Stock Index movement using k-Nearest Neighbours (k-NN) algorithm."WSEAS transactions information science andapplication, Issue 9 (2012). 2. Caley, Jeffrey Allan. A Survey of Systems for Predicting Stock Market
Movements, Combining Market Indicators and Machine Learning Classifiers.Diss. Portland StateUniversity, 2013.
3. “NASDAQ”. https://www.nasdaq.com/markets/indices 4. “NIFTY50”. https://quotes.wsj.com/index/IN/NIFTY50
5. Focus-economics.com,“/industrial-pro”.
https://www.focus-economics.com/economic-indicator/industrial-pro
6. nber.org, “Interest Rate”: http://www.nber.org/papers/ w234
7. Pring, Martin J. Technical analysis explained. McGraw-Hill Companies,2002.
8. “Private-consumption”.https://www.focus-economics. com/economic-indicator/Private-consumption
9. Tsai, C. F., and S. P. Wang. "Stock price forecasting by hybrid machine learning techniques. “Proceedings of the International Multi-Conference of Engineers andComputer Scientists.Vol.1.No. 755.2009.
10. Das, Shom Prasad, and SudarsanPadhy. "Support vector machines for prediction offutures prices in Indian stock market." International Journal of Computer Applications 41.3(2012).
11. Haider Khan, Zabir, TasnimSharminAlin, and AkterHussain."Price Prediction of Share Market Using Artificial Neural Network'ANN'."International Journal of ComputerApplications 22.2 (2011):42-47.
12. Adebiyi, A. A., et al. "Stock price prediction using a neural network with hybridized market indicators." Journal of Emerging Trends in Computing and Information Sciences 3.1 (2012):1-9.
AUTHORS PROFILE
Mr. Amanuel Getachew Bulti received his Bachelor of Science in Electrical and Computer Engineering with specialization in Computer Engineering from DDIT, Dire Dawa University, Dire Dawa, Ethiopia. And also completed his M.Tech with specialization in Computer Engineering from Kalinga Institute of Industrial technology deemed to be university, Bhubaneswar, Odisha. He had 2 years of experience of teaching at UG level. He serving as a Lecturer at faculty of the Department of Computer Engineering in Mizan Tepi University, Mizan Teferi, Ethiopia. He has various publications to his credit in a leading journal indexed in Scopus listing and international conferences. His areas of research interest are Embedded System, Artificial Intelligence, IoE/IoT, Cloud Computing, Data Mining, Grid Computing, Data Analytics, Big Data, and Machine Learning.
Dr. Abhishek Ray received his B.E (CS&E) from Utkal University, Odisha. M.Tech with specialization in CS from REC, Rourkela, Odisha. Completed his Ph. D. in Computer Science & Engineering from KIIT University, Bhubaneswar, Odisha. He had more than 20 years of the vast experience of teaching at UG and PG level. He served as a faculty of the Department of Computer Science and Engineering at Gandhi Institute of Engineering & Technology, Gunupur, Odisha, from 1998 to 2005. He joined KIIT University from July 2005 and has risen from Sr. Lecturer to Associate Professor. He is also a member of the Industry Engagement Cell (IEC) of KIIT University.He has various publications to his credit in leading Journals indexed in Scopus listing and International