0022-538X/96/$04.0010
Copyrightq1996, American Society for Microbiology
The M1 Gene Is Associated with Differences in the
Temperature Optimum of the Transcriptase
Activity in Reovirus Core Particles†
PENG YIN,1MARY CHEANG,2
ANDKEVIN M. COOMBS1*
Department of Medical Microbiology and Infectious Diseases,1and Biostatistical Consulting Unit, Department of
Community Health Sciences,2University of Manitoba, Winnipeg, Manitoba, Canada R3E 0W3
Received 26 June 1995/Accepted 1 November 1995
The reovirus core is a multienzyme complex that contains five different structural proteins and 10 segments of double-stranded RNA. The core is responsible for transcribing mRNA from the enclosed double-stranded RNA. The reovirus transcriptase has an unusual temperature profile, with optimum transcription occurring at approximately 50&C and little activity occurring below 30 or above 60&C. Purified reovirus serotype 1 Lang (T1L) cores transcribed most efficiently at 48&C. The transcriptase temperature optimum of purified reovirus serotype 3 Dearing (T3D) cores was 52&C. In addition, T1L cores produced more mRNA per particle than did T3D cores at their respective temperature optima. Core particles were purified from T1L3T3D reassortants and were used to map these differences. The M1 gene, which encodes minor core proteinm2, was uniquely associated with the difference in temperature optimum of transcription (P 5 0.0003). The L1 gene, which encodes minor core protein l3 (previously implicated as the RNA polymerase), and the M1 gene were associated with the difference in absolute amounts of transcript produced (P 5 0.01 and P 5 0.0002, respectively). These data suggest that minor core proteinm2 also plays a role in reovirus transcription.
Syntheses of progeny proteins and nucleic acid are necessary steps in the replication of viruses that precedes assembly and release. Most DNA viruses utilize host cell enzymes to accom-plish both functions. RNA viruses require RNA-dependent RNA polymerases to make copies of their genomes. In addi-tion, except for viruses whose genomes can serve directly as message (i.e., members of the family Picornaviridae), many RNA viruses also must use RNA-dependent RNA poly-merases (transcriptases) to convert their genomic information into mRNA.
The mammalian reoviruses have a genome consisting of 10 segments of double-stranded RNA. The RNA is enclosed by nonequivalent amounts of eight different structural proteins organized as a double capsid (for reviews, see references 24 and 27). The inner capsid (core) is the transcriptionally active form of the virus and is composed of three major proteins (l1, encoded by the L3 gene;l2, encoded by the L2 gene; ands2, encoded by the S2 gene) and two minor proteins (l3, encoded by the L1 gene; andm2, encoded by the M1 gene). The mented nature of the viral genome, knowledge that most seg-ments encode single proteins, and serotype-dependent mobil-ity differences of the genes allow the identification of intertypic reassortant viruses which have been used to assign particular functions to each of the three viral outer capsid proteins (10, 34) and to some of the five core proteins (3, 9, 16, 20).
After entry into a host cell, the outer capsid of the virus is removed to yield the core. This inner capsid has a diameter of about 60 nm. Proteinl2 is organized as pentameric spikes at each icosahedral vertex (17, 25). The spikes extend from the core capsid for an additional 9.5 nm and undergo significant conformational rearrangement during the uncoating process (11). However, the precise locations of l1, l3, m2, and s2 remain unknown. The core is a multienzyme complex that
contains all necessary components for transcription, methyl-ation, and capping of progeny mRNA (5, 12, 29). Little is known about details of core structure and how this particle transcribes mRNA from the enclosed genomic RNA. Thel2 spikes possess guanylyltransferase activity (6, 18). Proteinsl1 andl2 have been labelled with pyridoxal phosphate in actively transcribing particles (21). Minor core protein l3 has been associated with the pH optimum of transcription (9). In addi-tion, regions of proteinl3 share sequence homology with some other RNA polymerases (22), and recombinantl3 has some polymerase activity (33). However, the polymerase activity of the recombinantl3 lacks specificity and processivity, suggest-ing that ancillary proteins and/or other components of the core are required for accurate and efficient genomic transcription. To identify these other components, we have examined the abilities of purified core particles to transcribe under a variety of conditions.
The in vitro transcriptase reaction conditions that allow re-ovirus to generate acid-insoluble nucleic acid have been de-scribed elsewhere (9, 32). Stocks of reovirus serotype 1 Lang (T1L), reovirus serotype 3 Dearing (T3D), and T1L3 T3D reassortant viruses (originally isolated as described elsewhere [4, 7, 10]) were grown in mouse L929 cell monolayers in Joklik modified minimal essential medium (GIBCO, Grand Island, N.Y.) supplemented to contain 2.5% fetal calf serum (Inter-gen, Purchase, N.Y.), 2.5% VSP neonate bovine serum (Bio-cell, Carson, Calif.), 2 mM glutamine, 100 U of penicillin per ml, 100mg of streptomycin sulfate per ml, and 1mg of ampho-tericin B per ml, essentially as previously described (8). The gene patterns of all reassortants used were verified by electro-pherotyping as described elsewhere (15, 28). Reovirus core particles were purified as described elsewhere (7). Briefly, virus was grown in suspension cultures at 348C for 65 h, harvested by freon extraction, and banded in cesium chloride gradients. Gradient-purified virus was dialyzed and digested with chymot-rypsin, and core particles were purified in cesium chloride gradients. The core bands were harvested and dialyzed against * Corresponding author. Phone: (204) 789-3309. Fax: (204)
783-5255. Electronic mail address: [email protected]. † This study is dedicated to the memory of Bernard N. Fields.
1223
on November 9, 2019 by guest
http://jvi.asm.org/
core buffer (1 M NaCl, 100 mM MgCl2, 25 mM
N-[2-hydroxy-ethyl]piperazine-N9-[2-ethanesulfonic acid] [HEPES]; pH 8.0). The concentration of purified cores was measured (with the relationship 1 optical density unit at 260 nm 5 4.2 3 1012
particles per milliliter), glycerol was added to a final concen-tration of 25%, and core aliquots were frozen at2808C. This treatment had no detectable effect on core structure or func-tion compared with nontreated, nonfrozen cores. Core purity was monitored by characteristic protein profiles in sodium do-decyl sulfate-polyacrylamide gels and by electron microscopy. Aliquots of cores were thawed and diluted into core buffer, diethylpyrocarbonate-treated distilled H2O, and transcription
reaction buffer such that the final reaction components were 2 mM each ATP, CTP, GTP, and UTP; 3.3 mM phosphoenol-pyruvate; 100 ng of pyruvate kinase, 0.8 U of RNAsin (Boehr-inger Mannheim, Laval, Que´bec, Canada), and 0.1 mCi of [a-32P]UTP (New England Nuclear, Mississauga, Ontario,
Canada) perml; 9.5 mM MgCl2; and 100 mM HEPES [pH 8.0].
To reduce pipeting errors, a single reaction mixture was pre-pared for each type of core tested and divided into aliquots, and each aliquot was incubated at various temperatures for appropriate periods of time. Transcriptase reactions were ter-minated by placing the reaction tubes on ice and adding 8 volumes of ice-cold 5% trichloroacetic acid (TCA) to precip-itate macromolecules. Precipprecip-itates were collected onto filters and washed with 5% TCA and ethanol, and radioactivity was measured in a Beckman model 5000LS scintillation counter.
Previous investigators have shown that when purified virus is digested with chymotrypsin, the digestion is stopped by the addition of phenylmethylsulfonyl fluoride, and the mixture of cores, digested outer capsid proteins, and phenylmethylsulfo-nyl fluoride-stopped chymotrypsin is used, reovirus transcribes most efficiently between pH values of 8.0 and 9.0 (9, 32). In addition, Drayna and Fields showed that there were subtle strain-specific differences in the pH optimum within this range (9). Thus, our initial reactions with purified cores were con-ducted at multiple temperatures and at several pH values be-tween 8.0 and 9.0. Purified T1L and T3D cores had little detectable transcriptase activity at temperatures of#308C, and both strains showed transcriptase activity at higher tempera-tures, with the peak of activity at about 45 to 508C at all tested pH values, in agreement with previous reports (9, 32).
However, at pH 8.0, purified T1L cores transcribed most efficiently at 488C and purified T3D cores transcribed most efficiently at 528C (Fig. 1). At higher pH values, the activity peaks of cores derived from both strains were lower and broader, and strain-specific differences were less obvious (Fig. 1). These results differ slightly from those in previous reports, possibly because we used purified cores, smaller changes in temperature near the peaks, or both. Neither type of core produced significant amounts of product at temperatures of $628C at any tested pH. Additional studies indicated that at core concentrations of .7.5 3 109/ml, cores produced less
TCA-precipitable material per particle than at lower concen-trations (data not shown). Therefore, in subsequent experi-ments, core concentrations were kept at about 73109/ml, and
transcriptase reactions were performed at pH 8.0.
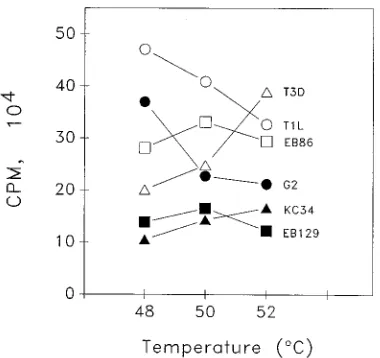
The different transcriptase temperature optima of cores de-rived from the two different virus strains (Fig. 1) suggested that reassortants could be used to determine which gene(s) was responsible for the phenotypic differences. Some reassortants (i.e., G2) behaved like T1L; cores derived from such clones possessed more transcriptase activity at 48 than they did at 508C and more activity at 50 than at 528C (Fig. 2). Other reassortants (i.e., KC34) behaved like T3D; they had more activity at 52 than at 508C and more activity at 50 than at 488C. A few reassortants (i.e., EB86 and EB129) behaved like nei-ther parent; they had virtually the same activity at 48 as at
FIG. 1. Transcriptase activities of purified reovirus cores at different temper-atures and pH values. Aliquots of 3.531011
total core particles in 50-ml volumes were incubated with 0.1mCi of [a-32
[image:2.612.341.531.71.250.2]P]UTP perml at the indicated temperatures and pH values for 1 h and precipitated with 5% TCA, and precipitates were collected on filters and counted. Results are the averages of duplicate experi-ments.E, T1L;Ç, T3D. Error bars indicate variability between experiments.
FIG. 2. Transcriptase activities of T1L, T3D, and selected T1L3T3D reas-sortant cores at 48, 50, and 528C (pH 8.0). Purified cores from the indicated clones were assayed for transcriptase activities at the indicated temperatures as described in the legend to Fig. 1. Results are the averages of three experiments (except for results for T1L and T3D, which are from five experiments).
on November 9, 2019 by guest
http://jvi.asm.org/
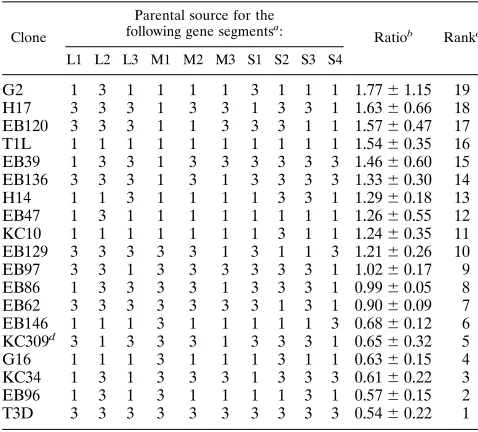
528C, with a minor peak of activity at 508C. The different reassortant behaviors prevented all clones from easily being placed into only two distinct groups (because some of the reassortants had intermediate behaviors). Therefore, the rela-tive transcriptase activities at various temperatures were de-termined in order to facilitate reassortant mapping analyses. This relative activity could be represented as a ratio of the transcriptase activity at 488C to the transcriptase activity of the same clone at 528C. The average ratio values obtained for each reassortant clone from three or more experiments generated a continuum from approximately 1.8 to approximately 0.5 (Table 1). Many of the reassortants near the top of the table (i.e., G2, H17, and EB120) behaved like T1L; the 48/528C ratio from every experiment was.1.0. (The relatively large errors asso-ciated with G2 and H17 resulted from single experiments in which the activity ratios were significantly higher.) Many reas-sortants near the bottom of the table (i.e., EB62, G16, and KC34) behaved like T3D; the 48/528C ratio was always less than 1.0. A few reassortants (i.e., EB47, EB97, and KC309) gave variable results, with 48/528C ratios of less than 1.0 in some experiments and greater than 1.0 in other experiments. However, the average ratio obtained for these reassortants placed them within the continuum. The reassortants were ranked according to the average activity ratio values obtained. The relative contribution of each of the genes was determined, with SAS (1), by both nonparametric and parametric statistical methods to ensure that the conclusions derived were indepen-dent of the method used. A nonparametric Wilcoxon rank sum analysis (a distribution-free univariate method which can be used when the test population does not follow normal distri-bution [14]) of the ranked reassortants shown in Table 1 indi-cated that the M1 gene was strongly associated (P50.0003) and that no other genes were associated with the difference in temperature optimum (Table 2). A linear regression analysis (which assumes a normal distribution) of each of the 10 genes
indicated that the M1 gene accounted for 74% of the variance (r250.74), the S3 gene accounted for 9% of the variance (r2 50.09), and each of the other genes accounted for 5% or less of variance. To examine the possible role of multiple genes, all subset multiple regression analysis (which provides a multiva-riate tool to examine independent sets of genes) showed that 90% of the variance (r2 50.9) could be attributed to the 10
gene segments and that 74% of the total variance (r250.74)
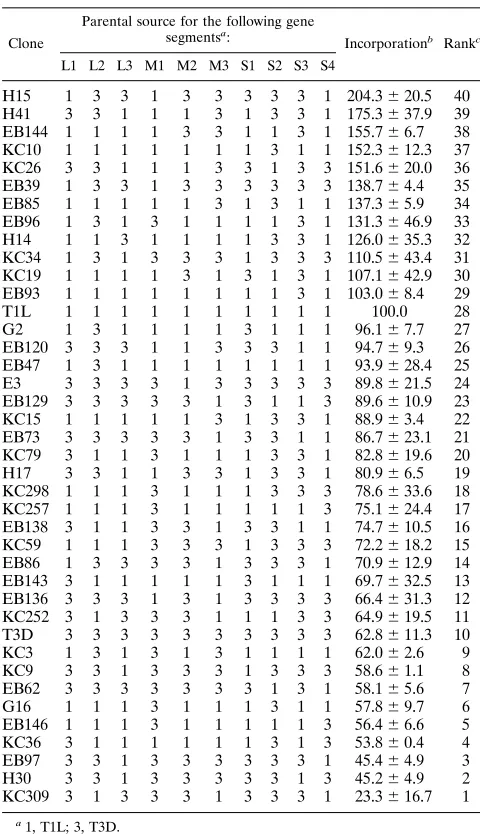
could be attributed solely to the viral M1 gene. The viral S1 gene added a contribution of 6% to the explained variance (r2 50.06), whereas each of the other genes added less than 4% to the explained variance. When the entire data set of individ-ual experimental results was examined by each of the above tests, the significance of the M1 gene was increased and no other viral genes were found to be associated (data not shown). The cumulative transcriptase activity of T1L cores was con-sistently higher than the cumulative activity of T3D cores near their respective optima (Fig. 1 and 2). To identify the viral gene(s) responsible for this difference, we examined the cumu-lative activity of various reassortants in this temperature range. Preliminary analyses that involved summing and ranking the activities of each clone in Table 1 at each tested temperature failed to implicate any single gene as a determinant of tran-scriptase efficiency but did suggest that multiple genes are involved (data not shown). Therefore, additional reassortant cores were prepared. In addition, to determine the cumulative transcriptase activity of each clone at multiple temperatures between 42 and 578C, reactions were carried out in a program-mable thermal controller (MJ Research model PTC-100) that had been programmed to increase temperature from 42 to 578C over a 2-h incubation (0.18C increase every 48 s). T3D cores generated about 60% of the amount of product that T1L cores generated (Table 3). Reassortants generated various amounts of product, from about twice the amount produced by T1L (clones H15 and H41) to about 25% of the amount pro-duced by T1L (KC309). A Wilcoxon rank sum analysis of the relative contributions of each of the genes of all ranked reas-TABLE 1. Genotypes of T1L3T3D intertypic reassortants tested
for transcriptase temperature optimum
Clone
Parental source for the following gene segmentsa:
Ratiob Rankc
L1 L2 L3 M1 M2 M3 S1 S2 S3 S4
G2 1 3 1 1 1 1 3 1 1 1 1.7761.15 19
H17 3 3 3 1 3 3 1 3 3 1 1.6360.66 18 EB120 3 3 3 1 1 3 3 3 1 1 1.5760.47 17 T1L 1 1 1 1 1 1 1 1 1 1 1.5460.35 16 EB39 1 3 3 1 3 3 3 3 3 3 1.4660.60 15 EB136 3 3 3 1 3 1 3 3 3 3 1.3360.30 14 H14 1 1 3 1 1 1 1 3 3 1 1.2960.18 13 EB47 1 3 1 1 1 1 1 1 1 1 1.2660.55 12 KC10 1 1 1 1 1 1 1 3 1 1 1.2460.35 11 EB129 3 3 3 3 3 1 3 1 1 3 1.2160.26 10 EB97 3 3 1 3 3 3 3 3 3 1 1.0260.17 9 EB86 1 3 3 3 3 1 3 3 3 1 0.9960.05 8 EB62 3 3 3 3 3 3 3 1 3 1 0.9060.09 7 EB146 1 1 1 3 1 1 1 1 1 3 0.6860.12 6 KC309d 3 1 3 3 3 1 3 3 3 1 0.6560.32 5
G16 1 1 1 3 1 1 1 3 1 1 0.6360.15 4
KC34 1 3 1 3 3 3 1 3 3 3 0.6160.22 3 EB96 1 3 1 3 1 1 1 1 3 1 0.5760.15 2
T3D 3 3 3 3 3 3 3 3 3 3 0.5460.22 1
a
Numbers indicate parental sources of gene. 1, T1L; 3, T3D.
b
Ratios were derived by dividing activity at 488C by activity at 528C (averages
6standard deviations for three or more experiments).
c
Ranking used for statistical analyses (Table 2).
d
[image:3.612.57.296.92.308.2]Clone was derived from a T3D3H14 cross (7).
TABLE 2. Nonparametric and parametric analyses of the 10 reovirus gene segments involved in transcriptase
temperature optimum
Gene
Mean transcriptase optimuma
Univariateb
Multivariate (r2)c
Wilcoxon rank sum (P value)
Linear regression
(r2)
L1 0.97 0.0001
L2 0.69 0.03
L3 0.6 0.01
M1 0.0003 0.74 0.74
M2 0.44 0.03
M3 0.1 0.0002
S1 0.71 0.01 0.06
S2 0.9 0.004
S3 0.23 0.09
S4 0.36 0.05
All 10 genes 0.90
aDetermined from gene rankings of averaged clones shown in Table 1. b
Univariate tests of each individual gene were the nonparametric Wilcoxon rank sum analysis and the parametric linear regression analysis.
c
Multivariate test used was the all-subset multiple regression analysis. Num-bers shown are the r2
values of genes adjusted for all other genes in the selected model. A blank position means r2
of,0.04, not statistically significant, and not included in the model.
on November 9, 2019 by guest
http://jvi.asm.org/
[image:3.612.314.554.97.276.2]sortants shown in Table 3 indicated that the L1 gene was significantly associated (P 5 0.01), that the M1 gene was strongly associated (P50.0002), and that no other genes were associated with the difference in transcriptase efficiency (Table 4). Linear regression analysis of each of the 10 genes indicated that the M1 gene accounted for 33% of the variance (r2 5
0.33), the L1 gene accounted for 13% of the variance (r2 5
0.13), the S1 gene accounted for 6% of the variance (r250.06),
and each of the other genes accounted for 5% or less of variance. All subset multiple regression analysis of the average transcriptase efficiencies showed that 51% of the variance (r25
0.51) could be attributed to the 10 gene segments and that 33% of the total variance (r250.33) could be attributed solely to
the viral M1 gene. The viral L1 gene added a contribution of 6% to the explained variance, and the S3 gene added an ad-ditional contribution of 5% to the variance, whereas each of
the other genes added less than 4% to the explained variance. When the entire data set of individual experimental results was examined by each of the above tests, the significance of both the L1 and M1 genes was increased and no other viral genes were found to be associated (data not shown).
These results indicate that, in addition to the known role of
[image:4.612.57.297.89.506.2]l3 as the polymerase (9, 22, 33), the viral M1 gene also is involved in transcription. The M1 gene is 2,304 bp long (35, 36) and encodes minor reovirus core proteinm2. Depending on where translation of this gene’s mRNA initiates, m2 is pre-dicted to be either 687 or 736 amino acids in length (26, 35, 36). There is about 98% amino acid identity between the T1L and T3D m2 proteins (36). However, the protein shares no simi-larity with other proteins in GenBank (35). Little is known about the function(s) of this minor protein. Reassortant map-ping experiments suggest thatm2 plays a role in determining the level of virus growth in cardiac cells (20) and in endothelial cells (19). It is also involved in myocarditis (31) and in organ-specific virulence in SCID mice (13). Such observations led to the speculation thatm2 may play a role in RNA metabolism (19, 20, 31). The protein is present within the reovirus particle at a rate of approximately 12 copies per particle, as is the other minor core proteinl3 (27). Because of the small copy number, which corresponds with the number of vertices on an icosahe-dral structure such as the core, it seems likely that both minor proteins may reside at or near the core vertices. Such a location would place these proteins near thel2 spikes, which are known to possess guanylyltransferase activity (6, 18). The l2 spikes possess channels (11), and electron microscopy of transcribing particles has suggested that nascent mRNA may be extruded through the spikes (2). Recent detailed reassortant analyses of reovirus strains capable of inducing acute myocarditis (30), as well as of reassortants capable of inducing organ-specific vir-ulence in SCID mice (13), suggest that proteinsl2,l3, andm2 may interact. The concept that these three proteins may form a structural and/or functional unit within the core particle also is supported by recent cryoelectron microscopy and image re-construction of T1L top-component particles (23) and by the observation that both l3 and m2 are associated with strain-dependent differences in transcription efficiency (Table 4). TABLE 3. Genotypes of T1L3T3D intertypic reassortants used to
measure transcriptase efficiency
Clone
Parental source for the following gene segmentsa:
Incorporationb Rankc
L1 L2 L3 M1 M2 M3 S1 S2 S3 S4
H15 1 3 3 1 3 3 3 3 3 1 204.3620.5 40 H41 3 3 1 1 1 3 1 3 3 1 175.3637.9 39 EB144 1 1 1 1 3 3 1 1 3 1 155.766.7 38 KC10 1 1 1 1 1 1 1 3 1 1 152.3612.3 37 KC26 3 3 1 1 1 3 3 1 3 3 151.6620.0 36 EB39 1 3 3 1 3 3 3 3 3 3 138.764.4 35 EB85 1 1 1 1 1 3 1 3 1 1 137.365.9 34 EB96 1 3 1 3 1 1 1 1 3 1 131.3646.9 33 H14 1 1 3 1 1 1 1 3 3 1 126.0635.3 32 KC34 1 3 1 3 3 3 1 3 3 3 110.5643.4 31 KC19 1 1 1 1 3 1 3 1 3 1 107.1642.9 30 EB93 1 1 1 1 1 1 1 1 3 1 103.068.4 29
T1L 1 1 1 1 1 1 1 1 1 1 100.0 28
G2 1 3 1 1 1 1 3 1 1 1 96.167.7 27
EB120 3 3 3 1 1 3 3 3 1 1 94.769.3 26 EB47 1 3 1 1 1 1 1 1 1 1 93.9628.4 25
E3 3 3 3 3 1 3 3 3 3 3 89.8621.5 24
EB129 3 3 3 3 3 1 3 1 1 3 89.6610.9 23 KC15 1 1 1 1 1 3 1 3 3 1 88.963.4 22 EB73 3 3 3 3 3 1 3 3 1 1 86.7623.1 21 KC79 3 1 1 3 1 1 1 3 3 1 82.8619.6 20
H17 3 3 1 1 3 3 1 3 3 1 80.966.5 19
KC298 1 1 1 3 1 1 1 3 3 3 78.6633.6 18 KC257 1 1 1 3 1 1 1 1 1 3 75.1624.4 17 EB138 3 1 1 3 3 1 3 3 1 1 74.7610.5 16 KC59 1 1 1 3 3 3 1 3 3 3 72.2618.2 15 EB86 1 3 3 3 3 1 3 3 3 1 70.9612.9 14 EB143 3 1 1 1 1 1 3 1 1 1 69.7632.5 13 EB136 3 3 3 1 3 1 3 3 3 3 66.4631.3 12 KC252 3 1 3 3 3 1 1 1 3 3 64.9619.5 11 T3D 3 3 3 3 3 3 3 3 3 3 62.8611.3 10
KC3 1 3 1 3 1 3 1 1 1 1 62.062.6 9
KC9 3 3 1 3 3 3 1 3 3 3 58.661.1 8
EB62 3 3 3 3 3 3 3 1 3 1 58.165.6 7
G16 1 1 1 3 1 1 1 3 1 1 57.869.7 6
EB146 1 1 1 3 1 1 1 1 1 3 56.466.6 5
KC36 3 1 1 1 1 1 1 3 1 3 53.860.4 4
EB97 3 3 1 3 3 3 3 3 3 1 45.464.9 3
H30 3 3 1 3 3 3 3 3 1 3 45.264.9 2
KC309 3 1 3 3 3 1 3 3 3 1 23.3616.7 1 a
1, T1L; 3, T3D.
b
Incorporation was determined by incubating each clone (42 to 578C [0.18C increase every 48 s] over a 2-h period) in a programmable thermal controller as detailed in the text. Data are averages expressed as percentages of T1L activity
6standard deviations for three experiments.
cRanking used for statistical analyses (Table 4).
TABLE 4. Nonparametric and parametric analyses of the 10 reovirus gene segments involved in transcriptase efficiency
Gene
Mean transcriptase optimuma
Univariateb
Multivariate (r2
)b
Wilcoxon rank sum (P value)
Linear regression
(r2
)
L1 0.01 0.13 0.06
L2 0.72 0.01
L3 0.77 0.0005
M1 0.0002 0.33 0.33
M2 0.44 0.01
M3 0.15 0.03
S1 0.12 0.06
S2 0.52 0.001
S3 0.44 0.05 0.05
S4 0.34 0.03
Total for 10 genes
0.51
aDetermined from gene rankings of averaged clones shown in Table 3. b
Univariate and multivariate tests used as described in footnotes b and c of Table 2.
on November 9, 2019 by guest
http://jvi.asm.org/
[image:4.612.313.555.91.277.2]Collectively, these observations suggest that proteins l2, l3, andm2 may represent the structural and functional enzymatic complex that directs the transcription and capping of mRNA from the double-stranded RNA genome. More detailed struc-tural and functional analyses may determine the precise loca-tions of these minor core proteins and elucidate the roles played by these proteins in converting the genomic information of reovirus into mRNA.
We thank Earl Brown, Barbara Sherry, and Neil Simonson for critical reviews of this study; Lydia Petrycky-Cox for maintenance of cultured cells and technical assistance; Max Nibert and Kelly Dryden for sharing data prior to publication; and Paul Hazelton, Molly Shing, and Mark Makarovsky for helpful discussions.
This research was supported by the Manitoba Health Research Council and grant MT-11630 from the Medical Research Council of Canada. K.M.C. was an MHRC Scholar.
REFERENCES
1. Anonymous. 1990. SAS/STAT users guide, version 6, 4th ed., vol. 1 and 2. SAS Institute, Inc., Cary, N.C.
2. Bartlett, N. M., S. C. Gillies, S. Bullivant, and A. R. Bellamy. 1974. Electron microscope study of reovirus reaction cores. J. Virol. 14:315–326. 3. Bodkin, D. K., and B. N. Fields. 1989. Growth and survival of reovirus in
intestinal tissue: role of the L2 and S1 genes. J. Virol. 63:1188–1193. 4. Brown, E. G., M. L. Nibert, and B. N. Fields. 1983. The L2 gene of reovirus
serotype 3 controls the capacity to interfere, accumulate deletions and es-tablish persistent infection, p. 275–287. In R. W. Compans and D. H. L. Bishop (ed.), Double-stranded RNA viruses. Elsevier, New York. 5. Chang, C.-T., and H. J. Zweerink. 1971. Fate of parental reovirus in infected
cell. Virology 46:544–555.
6. Cleveland, D. R., H. Zarbl, and S. Millward. 1986. Reovirus guanylyltrans-ferase is L2 gene product lambda 2. J. Virol. 60:307–311.
7. Coombs, K. M., B. N. Fields, and S. C. Harrison. 1990. Crystallization of the reovirus type 3 Dearing core. Crystal packing is determined by the lambda 2 protein. J. Mol. Biol. 215:1–5.
8. Coombs, K. M., S.-C. Mak, and L. D. Petrycky-Cox. 1994. Studies of the major reovirus core proteins2: reversion of the assembly-defective mutant
tsC447 is an intragenic process and involves back mutation of Asp-383 to
Asn. J. Virol. 68:177–186.
9. Drayna, D., and B. N. Fields. 1982. Activation and characterization of the reovirus transcriptase: genetic analysis. J. Virol. 41:110–118.
10. Drayna, D., and B. N. Fields. 1982. Genetic studies on the mechanism of chemical and physical inactivation of reovirus. J. Gen. Virol. 63:149–159. 11. Dryden, K. A., G. Wang, M. Yeager, M. L. Nibert, K. M. Coombs, D. B.
Furlong, B. N. Fields, and T. S. Baker.1993. Early steps in reovirus infection are associated with dramatic changes in supramolecular structure and pro-tein conformation: analysis of virions and subviral particles by cryoelectron microscopy and image reconstruction. J. Cell Biol. 122:1023–1041. 12. Furuichi, Y., M. Morgan, S. Muthukrishnan, and A. J. Shatkin. 1975.
Re-ovirus messenger RNA contains a methylated blocked 59-terminal structure M7G(59)ppp(59)GmpCp-. Proc. Natl. Acad. Sci. USA 72:362–366. 13. Haller, B. L., M. L. Barkon, G. P. Vogler, and H. W. Virgin IV. 1995. Genetic
mapping of reovirus virulence and organ tropism in severe combined immu-nodeficient mice: organ-specific virulence genes. J. Virol. 69:357–364. 14. Hassard, T. H. 1991. Understanding biostatistics. Mosby, St. Louis, Mo.
15. Hazelton, P. R., and K. M. Coombs. 1995. The reovirus mutant tsA279 has temperature-sensitive lesions in the M2 and L2 genes: the M2 gene is associated with decreased viral protein production and blockade in trans-membrane transport. Virology 207:46–58.
16. Keroack, M., and B. N. Fields. 1986. Viral shedding and transmission be-tween hosts determined by reovirus L2 gene. Science 232:1635–1638. 17. Luftig, R. B., S. S. Kilham, A. J. Hay, H. J. Zweerink, and W. K. Joklik. 1972.
An ultrastructure study of virions and cores of reovirus type 3. Virology 48:170–181.
18. Mao, Z. X., and W. K. Joklik. 1991. Isolation and enzymatic characterization of protein lambda 2, the reovirus guanylyltransferase. Virology 185:377–386. 19. Matoba, Y., W. S. Colucci, B. N. Fields, and T. W. Smith. 1994. The reovirus M1 gene determines the relative capacity of growth of reovirus in cultured bovine aortic endothelial cells. J. Clin. Invest. 92:2883–2888.
20. Matoba, Y., B. Sherry, B. N. Fields, and T. W. Smith. 1991. Identification of the viral genes responsible for growth of strains of reovirus in cultured mouse heart cells. J. Clin. Invest. 87:1628–1633.
21. Morgan, E. M., and D. W. Kingsbury. 1980. Pyridoxal phosphate as a probe of reovirus transcriptase. Biochemistry 19:484–489.
22. Morozov, S. Y. 1989. A possible relationship of reovirus putative RNA polymerase to polymerases of positive-strand RNA viruses. Nucleic Acids Res. 17:5394.
23. Nibert, M. L., and K. L. Dryden. Personal communication.
24. Nibert, M. L., D. B. Furlong, and B. N. Fields. 1991. Mechanisms of viral pathogenesis. Distinct forms of reoviruses and their roles during replication in cells and host. J. Clin. Invest. 88:727–734.
25. Ralph, S. J., J. D. Harvey, and A. R. Bellamy. 1980. Subunit structure of the reovirus spike. J. Virol. 36:894–896.
26. Roner, M. R., L. A. Roner, and W. K. Joklik. 1993. Translation of reovirus RNA species m1 can initiate at either of the first two in-frame initiation codons. Proc. Natl. Acad. Sci. USA 90:8947–8951.
27. Schiff, L. A., and B. N. Fields. 1990. Reoviruses and their replication, p. 1275–1306. In B. N. Fields and D. M. Knipe (ed.), Virology, 2nd ed. Raven Press, New York.
28. Sharpe, A. H., R. F. Ramig, T. A. Mustoe, and B. N. Fields. 1978. A genetic map of reovirus. I. Correlation of genome RNAs between serotypes 1, 2 and 3. Virology 84:63–74.
29. Shatkin, A. J. 1974. Methylated messenger RNA synthesis in vitro by puri-fied reovirus. Proc. Natl. Acad. Sci. USA 71:3204–3207.
30. Sherry, B., and M. A. Blum. 1994. Multiple viral core proteins are determi-nants of reovirus-induced acute myocarditis. J. Virol. 68:8461–8465. 31. Sherry, B., and B. N. Fields. 1989. The reovirus M1 gene, encoding a viral
core protein, is associated with the myocarditic phenotype of a reovirus variant. J. Virol. 63:4850–4856.
32. Skehel, J. J., and W. K. Joklik. 1969. Studies on the in vitro transcription of reovirus RNA catalyzed by reovirus cores. Virology 39:822–831. 33. Starnes, M. C., and W. K. Joklik. 1993. Reovirus proteinl3 is a poly(C)
dependent poly(G) polymerase. Virology 193:356–366.
34. Weiner, H. L., M. L. Powers, and B. N. Fields. 1980. Absolute linkage of virulence and central nervous system tropism of reovirus to viral hemagglu-tinin. J. Infect. Dis. 141:609–616.
35. Wiener, J. R., J. A. Bartlett, and W. K. Joklik. 1989. The sequences of reovirus serotype 3 genome segments M1 and M3 encoding the minor pro-teinm2 and the major nonstructural protein mNSrespectively. Virology 169:293–304.
36. Zou, S., and E. G. Brown. 1992. Nucleotide sequence comparisons of the M1 genome segment of reovirus type 1 Lang and type 3 Dearing. Virus Res. 22:159–164.