INTRODUCTION
Environmental pollution is a growing problem globally and tremendous investments and resources have been put into it to protect the environment. Diesel engines produce millions of tons of air pollutants such as nitrogen oxides, particulate matter, carbon monoxide and volatile organic compounds, which are harmful to the environment. The oxides of nitrogen in the exhaust emissions contain nitric oxide (NO) and nitrogen dioxide (NO2). The formation of NOx is highly dependent on cylinder temperatures, the oxygen concentration and residence time for the reaction to take place. CO emission is toxic and must be controlled. It is an intermediate product in the com-bustion of a HC fuel, so its emission results from incomplete combustion. Emission of CO is therefore greatly dependent on the air-fuel ratio relative to the stoichiometric proportions. Rich combustion invariably produces CO and emissions increase nearly linearly with the deviation from the stoichi-ometry. Unburned HC emissions consist of fuel that is incom-pletely burned. The term HC means organic compounds in the gaseous state; solid HCs are part of the particulate matter. Unburned HCs are because of poor fuel distribution, large amounts of excess air and low exhaust temperature, lean fuel-air mixture regions may survive to escape into the exhaust.
Increasing public awareness about the pollution caused by diesel emissions urges diesel manufacturers to consider
Studying on the Emission Characteristic of a Diesel Engine by Simulation†
YOUHONG XIAO1,*, XINNA TIAN1 and PEILIN ZHOU2
1College of Power and Energy Engineering, Harbin Engineering University, Harbin, Heilongjiang, P.R. China 2
Department of Naval Architecture and Marine Engineering, Universities of Glasgow and Strathclyde, Scotland, UK
*Corresponding author: E-mail: [email protected]
AJC-11788
At present, the problem of environment pollution draws people's attention increasingly. The international communities and organizations established relevant laws to restrict the emission and reduce the harm to human being and environment. In this paper, a numerical simulation model for diesel engine was established by GT-POWER in order to study the NO, CO and HC emissions characteristic of the diesel engine and the model was validated by experimental data. Based on the model, the variable parameters including injection timing, intake air temperature, compression ratio and EGR ratio were carried out. The simulation results showed that with the decrease of CA BTDC, intake air temperature, compression ratio and EGR ratio respectively, the NO emission decreased. However, the CO and hydrocarbon emissions increased.
Key Words: Emission characteristic, GT-POWER software, compression ratio, Exhaust gas recirculation ratio.
†Presented at International Conference on Global Trends in Pure and Applied Chemical Sciences, 3-4 March, 2012; Udaipur, India diesel exhaust emissions during the design choice. Due to overall complexity and increased costs for the experiments of the diesel design, modeling and simulating continue to be pursued as a method of obtaining valuable information and parameters supporting the engine design and development process. In modern engine research and study, although less precise in predicting the outcome of a specific test, modeling and simulating could effectively isolate one variable at a time and conduct parametric studies on it.
Therefore a validated diesel engine model for the simu-lation could be a useful tool to study new type of engines. In this paper, the diesel engine model which is corresponding to the real engine was built by using the engine simulation software GT-POWER, which is one of the leading quasi-dimensional engine simulation software. The model has sub-models which reflect all the features in the real engine, including direct injection, exhaust gas recirculation, turbo-charging, exhaust gas recirculation inter-cooling, etc. (Fig. 1). The effect of injection timing, intake air temperature, compre-ssion ratio, exhaust gas recirculation, turbo-charging and intercooler on the NO, CO and HC emissions are simulated by the software of GT-POWER.
EXPERIMENTAL
Engine experimental test bed: The diesel engine used for the experiment is a four cylinders, direct injection high
speed engine. Table-1 presents the detailed specifications of the engine. The eddy current dynamometer, model: PDWC375, produces braking torque using the principle of eddy current induced on a rotating metallic disk immersed in a magnetic field. The dynamometer is able to measure engines power up to 375 kW.
TABLE-1
EXPERIMENTAL ENGINE SPECIFICATIONS
Engine model CY4102BG
Engine type 4 stroke, water cooled, direct injection
No. of cylinders 4
Bore × stroke (mm) 102 × 118
Total piston displacement (l) 3.856
Compression ratio 17.5:1
Injection advance angle 16
Rated speed (rpm) 2300
Rated power (kW) 49
Idle speed (rpm) 630
Max torque (Nm) 235 at 1600 rpm
Firing order 1-3-4-2
Modeling of diesel engine and validation simulation: The diesel engine computational model is developed by using GT-POWER software. The model is started from intake environ-ment and finished in exhaust environenviron-ment. There are three sub-system in the computational model of the diesel engine. The first is design and development of intake system, the second is design and development of engine cylinder and engine crank train and the third is design and development of exhaust system. Then all of the diesel engine components are input for the three sub-system engine and all of the engine components are connect to develop the diesel model. After the computational modeling is completed, then running the model is run to simulate the engine model performance and exhaust emissions. As shown in Fig. 1, the work process model
of the diesel engine was mainly composed of input, output and cylinder three systems.
RESULTS AND DISCUSSION
[image:2.595.46.556.67.336.2]The exhaust emissions between the engine test and simu-lation results data were compared to verify the reliability and accuracy of the work process model. Fig. 2 shows the com-parison of NO, CO and HC emissions concentration between the engine test results and simulation data as a function of the exhaust flow at four operating points which is based on the propulsion characteristics of marine diesel engines required by IMO MARPOL is shown in Table-2. It can be seen from the figure that the results of the exhaust emissions from computer simulation are in a good agreement with the results obtained from the diesel tests. Thus it can be conclude that the model provides a reasonable prediction of the exhaust emission of the diesel engine and were suitable for the research of the exhaust emissions characteristic of diesel engine based on the satisfying agreement of the simulation and experimental results of exhaust emissions.
[image:2.595.328.529.608.746.2]Fig. 2. Comparison of exhaust emission between model prediction and experimental measurements at steady state conditions
TABLE-2
ENGINE OPERATING POINTS FOR TEST CYCLE AND SIMULATION
Testing and simulating points 1 2 3 4
100 % 75 % 50 % 25 %
Power (kW)
49 36.75 24.5 12.25
100 % 91 % 80 % 63 %
Speed (rpm)
2300 2093 1840 1449
Mode E3
Weighting coefficient 0.2 0.5 0.15 0.15
Where: 1, 2, 3, 4 are the four working condition points as shown in Table 2
Effect of injection timing on exhaust emissions: For a diesel engine, fuel injection timing is a major parameter that affects the combustion and exhaust emissions and the studies showed that the injection timing affects the level of exhaust emissions1,2. Injection timing variation has a strong effect on the exhaust emissions, especially on the NOx emissions, because of the changing of the maximum temperature in the engine cylinder3,4.
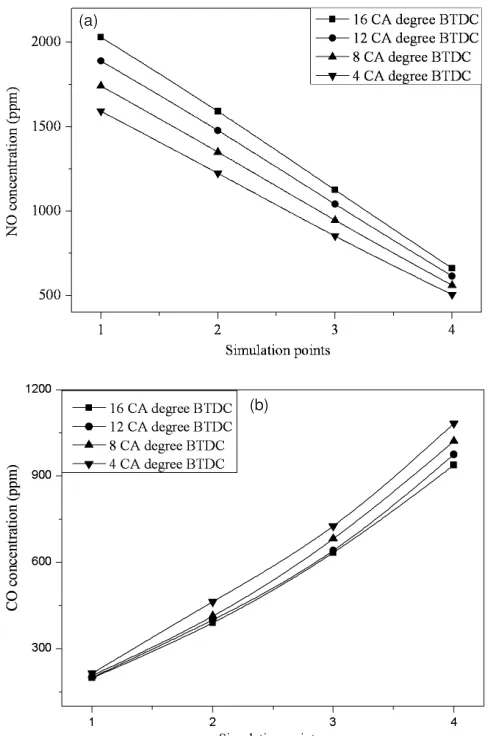
The effect of injection timing on exhaust emissions is given in Fig. 3, which shows the exhaust emissions results at four different injection timings, i.e. 16º, 12º, 8º and 4º CA BTDC at four working conditions as introduced in Table-2.
Fig. 3(a) indicates the variations of NO emission under different injection timings at four working conditions points. Retarding the injection timing decreases the peak cylinder pres-sure because more fuel burns after TDC. Lower peak cylinder
(a)
(b)
[image:3.595.44.293.66.170.2] [image:3.595.45.289.398.766.2](c)
Fig. 3. Exhaust emissions results at different injection timings and loads (a: NO emission, b: CO emission, c: HC emission)
pressures results in lower peak temperatures, as a consequence, the NOx concentration starts to diminish5. When the injection timing is retarded, a decrease in the NOx emissions for all working conditions points was observed. When the injection timing was retarded by 16º CA BTDC in comparison to 4º CA BTDC, NOx emissions decreased by 21.6 % at full load.
Fig. 3(b) shows the effect of injection timing on CO emission. The advanced injection timing produced a higher cylinder temperature, which caused an increase in the chemical reaction speed of combustion region. Also, the advanced injection timing increased the oxidation process between carbon and oxygen molecules. These cause reduction of the CO emissions6
. At 25 % load, retarding the injection timing from 16º to 4º CA BTDC, caused a increase of 200 ppm in the CO emission. But at full load, changing the injection timing only has a small effect on CO emission.
Fig. 3(c) shows the variations of the unburned HC at diffe-rent injection timings at four working conditions. It can be seen that advancing the injection timing reduces unburned HC emissions. Advancing the injection timing from 4 º to 16º CA BTDC caused the emission of unburned HC to decrease by 17.6 % at full load. And at 75, 50 and 25 % loads, unburned HC has a decrease of 18.5, 22.1 and 25.2 % respectively. When the injection timing was advanced, HC emission decreased due to improved reaction between fuel and oxygen. Advancing the injection timing caused an earlier start of combustion relative to the TDC. Because of this, the cylinder charge, being compressed as the piston moves to the TDC, had relatively higher temperatures and thus, lowered the unburned HC emissions.
(a)
(b)
[image:4.595.47.289.61.631.2](c)
Fig. 4. Exhaust emissions results at different intake air temperature and loads; (a: NO emission, b: CO emission, c: HC emission)
Fig. 4(b) and (c) show the CO and unburned HC emissions decreasing with the increasing of intake air temperature. Increasing the intake air temperature can improve the reaction rates of the mixture, widen its flammability limits and sustain flame propagation within relatively linear mixtures. Thus, increasing the intake air temperature will produce higher charge temperature which leads to propagating the flame successfully through the fuel air mixture and.
Effect of compression ratio on emission: The compression ratio of diesel engine can affect the in-cylinder temperatures, hence flame temperatures during the combustion. Fig. 5 illus-trates the NO, CO and HC emissions concentrations with diffe-rent compression ratio at four working condition points.
(a)
(b)
[image:4.595.307.548.139.713.2](c)
Fig. 5. Exhaust emissions results with different compression ratio and loads (a: NO emission, b: CO emission, c: HC emission)
that, there is a low NO emission concentration at 25 % load and the decreasing of compression ratio affects the NO emission concentration slightly. This is due to the thin fuel-air mixture and the low temperature in the cylinder which causes a low NO emission concentration. Therefore, changing compression ratio only has a littler effect on the NO emission. However, at high loads the fuel-air mixture is thick and the combustion temperature is high. With the increasing of compression ratio and the turbulence of the mixture become intense cause the increase of NO emission concentration.
It was found that CO emission increases with the increasing of compression ratio as shown in Fig. 5(b). With the increasing of compression ratio, the charging coefficient increases and cased a lean mixture. Meanwhile, Increasing the compression ratio could cause the increase of the temperature during the combustion and thus CO emission7
. Therefore, CO emission increases with the increasing of compression ratio.
Fig. 5(c) shows HC concentration with 17.5, 16.5, 15.5 and 14.5 compression ratios. As shown in the figure, the impact of the change of compression ratio on HC emissions was largest at the low load condition. It is believed that the conditions for HC formation are more prevalent at light loads with lower in-cylinder pressures and temperatures leading to over-leaning and quenching of the flame and thus to increase HC emissions. A lower compression ratio engine offers a reduced pressure.
Effect of exhaust gas recirculation on emission:Exhaust gas recirculation is used to reduce the oxygen concentration and to control the rate of combustion. The exhaust gas, added to the fuel, oxygen and combustion products, increases the specific heat capacity of the cylinder contents, which lowers the adiabatic flame temperature. The effect of exhaust gas recirculation ratio on NO, CO and HC emissions at various engine load conditions is illustrated in Fig. 6.
Fig. 6(a) presents the variation of NO as function of load for various exhaust gas recirculation rates. The figure shows that the NO emission reduces with increase in exhaust gas recirculation ratio for all load conditions. This is due to the presence of inert gas (CO2 and H2O) in the combustion chamber, which reduces the peak combustion temperature and also it replaces the oxygen in the combustion chamber8,9
. At 25 % load, the NO emission concentration is 661 ppm without exhaust gas recirculation. While with 10 % exhaust gas recirculation
(a)
(b)
[image:5.595.307.550.68.440.2] [image:5.595.47.289.587.764.2](c)
Fig. 6. Exhaust emissions results at exhaust gas recirculation ratio and loads (a: NO, b: CO, c: HC)
rate the value is observed to be 410 ppm and with 30 % exhaust gas recirculation rate it is only 265 ppm. At 75 % load the NO emission concentration for diesel is 1591 ppm without exhaust gas recirculation. It is 1432, 1114, 955 ppm, with 5, 20 and 30 % exhaust gas recirculation ratio respectively. At full load the NO emission decreases from 2030 ppm to 1726 ppm with exhaust gas recirculation ratio from none to 10 %. With 20 % exhaust gas recirculation ratio the NO value is only 1584 ppm and it further reduces to 1421 ppm with 30 % exhaust gas recirculation ratio.
As far as CO and HC emissions are concerned an increase of their value is observed when increasing exhaust gas recircu-lation temperature, as demonstrated in Fig. 6(b) and (c). This results mainly from the reduction of oxygen concentration. The variation of CO with load is shown in Fig. 6(b) and with increase in exhaust gas recirculation ratio at full load it does not have dramatic effect on CO variation. The increase in CO concentration is due to the partial replacement of oxygen in inlet air by inert gas, which results in deficiency in oxygen concentration, thus increasing the concentration.
the HC emission is observed as 161 and 200 ppm respectively. At full load the HC is found to be 75 ppm without exhaust gas recirculation. With the exhaust gas recirculation ratio increasing to 20 % and 30 %, the HC concentration rises to be 100 and 120 ppm respectively. The increase in HC is due to the effect of flame quenching at part load and reduction in oxygen in the inlet charge by the exhaust gas recirculation admitted into the cylinder10
. Conclusion
In this study, the effect of injection timing, intake air temperature, compression ratio and exhaust gas recirculation on the exhaust emissions of a diesel engine has been investi-gated using the simulation software GT-Power and the model has been verified through the experiment data.
The results show that these technologies can change the exhaust emissions of diesel engine. Generally, adjusting the factor to decrease one emission will cause an increase of other emission. As studied in the paper, with the decrease of CA BTDC, intake air temperature, compression ratio and exhaust gas recirculation ratio respectively, the NO emissions decreased. On the contrary, the CO and HC emissions increased. And in some tend, it will affect the power and economy of the engine.
Therefore, reducing the exhaust emissions by improving combustion is a synthetical technology.
ACKNOWLEDGEMENTS
This study was supported by China postdoctoral Science Foundation (Grant No: 2011M500641).
REFERENCES
1. A. Parlak, H. Yasar and A. Kolip, Appl. Therm. Eng., 25, 3042 (2005). 2. O.M.I. Nwafor, Sadhana, 27, 375 (2002).
3. J.B. Heywood, Internal Combustion Engines. USA: McGraw-Hill, (1984).
4. O. Borat, M. Balc and A. Surmen, Internal Combustion Engines. Tur-key: Gazi University Publishing (2000).
5. BOSCH, Automotive Handbook, edn. 5, Germany (2000).
6. C. Sayina, K. Uslub and M. Canakcic, Renewable Energy,33, 1314 (2008).
7. J.J. Zheng, J.H. Wang, B. Wand and Z.H. Huang, Trans. CSICE, 28 (2010).
8. R. Egnell, The Influence of Exhaust Gas Recirculation on Heat Release rate and NO Formation in a DI Diesel Engine, Inc. SAE Transactions Special Publication (2000).