Malinowski, P. and Wandowski, T. and Trendafilova, I. and Ostachowicz, W.M. (2009) A phased array-based method for damage detection and localization in thin plates. Structural Health Monitoring, 8 (1). pp. 5-15. ISSN 1475-9217 , http://dx.doi.org/10.1177/1475921708090569
This version is available at https://strathprints.strath.ac.uk/19312/
Strathprints is designed to allow users to access the research output of the University of Strathclyde. Unless otherwise explicitly stated on the manuscript, Copyright © and Moral Rights for the papers on this site are retained by the individual authors and/or other copyright owners. Please check the manuscript for details of any other licences that may have been applied. You may not engage in further distribution of the material for any profitmaking activities or any commercial gain. You may freely distribute both the url (https://strathprints.strath.ac.uk/) and the content of this paper for research or private study, educational, or not-for-profit purposes without prior permission or charge.
Any correspondence concerning this service should be sent to the Strathprints administrator:
The Strathprints institutional repository (https://strathprints.strath.ac.uk) is a digital archive of University of Strathclyde research outputs. It has been developed to disseminate open access research outputs, expose data about those outputs, and enable the
Malinowski, P. and Wandowski, T. and Trendafilova, I.* and Ostachowicz, W.M. (2008) A phased-array-based method for damage detection and localization in thin plates. Structural Health Monitoring. ISSN 1475-9217
http://eprints.cdlr.strath.ac.uk/6981/
This is an author-produced version of a paper published in Structural Health Monitoring. ISSN 1475-9217. This version has been peer-reviewed, but does not include the final publisher proof corrections, published layout, or pagination.
Strathprints is designed to allow users to access the research output of the University of Strathclyde. Copyright © and Moral Rights for the papers on this site are retained by the individual authors and/or other copyright owners. You may not engage in further distribution of the material for any profitmaking activities or any commercial gain. You may freely distribute both the url (http://eprints.cdlr.strath.ac.uk) and the content of this paper for research or study, educational, or not-for-profit purposes without prior permission or charge. You may freely distribute the url
(http://eprints.cdlr.strath.ac.uk) of the Strathprints website.
1
A phased-array-based method for damage detection and localization in thin plates
Damage detection and localization in thin plates based on a phased array idea
Pawel Malinowski1), Tomasz Wandowski1), Irina Trendafilova3), Wieslaw Ostachowicz1,2)
1)
Institute of Fluid-Flow Machinery of Polish Academy of Sciences Fiszera 14, 80-952, Gdansk, Poland
Tel.: +48(58) 341 1271 Fax: +48(58) 341 6144
2)
Gdynia Maritime University, Faculty of Navigation Al. Jana Pawła II 3, 81-345, Gdynia, Poland
Tel.: +48 (58) 620 1301
3)
University of Strathclyde Department of Mechanical Engineering
Glasgow, UK Tel.: +44 (0) 141 548 2322 Fax: +44 (0) 141 552 5105
E-mail: [email protected], [email protected], [email protected], [email protected]
Keywords: Phased array, damage localisation, structural health monitoring, elastic waves
Abstract
A method for damage localisation has been developed, which is based on the phased array idea. Four arrays of transducers, instead of only one, are used to perform a beam-forming procedure. Each array consists of nine transducers placed along a line, which are able to excite and register elastic waves. The arrays are placed in such a way that the angular difference between them is 45º and the rotation point is the middle transducer, which is common for all the arrays. The idea has been tested on a square aluminium plate modelled by the Spectral Finite Element Method. Two types of damage were considered, namely distributed damage, which was modelled as stiffness reduction, and cracks, modelled as separation of nodes in selected finite elements. The plate is excited by a wave packet (5-cycle sine modulated by the Hanning window). The whole array system is placed in the middle of the plate. Each phase array in the system acts independently and produces maps of a scanned field based on the beam-forming procedure. These maps are made of signals that represent the difference between the damaged plate signals and those from the intact plate. An algorithm was developed to join all four maps. This procedure eliminates the necessity to analyse each map individually and also gives the possibility to extract common features only. It allows to remove ambiguity and helps to localise damage more precisely than in the case of a single map. The problem for damage localisation was investigated and exemplary maps confirming the effectiveness of the system proposed were obtained. The investigation is based exclusively on numerical data.
Introduction
are extensively used as structural parts of an aircraft. It is essential to monitor aircrafts and their parts regularly to prevent the development of defects, which if left to develop unnoticed may cause an accident. There is a recent trend, which suggests to use permanently attached piezoelectric transducers (PZTs) (lead zirconium titanate) that are able to excite and register waves in various materials. They can be small and light and this makes them ideal for integration with structures and for building sensor networks. A very important issue is the correct placement (location) of the sensors and the actuators on the analysed structures. The method of data processing is also crucial. The simplest health monitoring system may consist of only one transducer, which is able to excite and detect elastic waves. Excited waves propagate in the analysed structure and are reflected from its boundaries and, which is more important, from damage. Unfortunately the amplitude of the damage reflected waves returning to the sensor are often too weak to be detected and one transducer is not enough. One can simply use more transducers on the analysed surface. In effect it will reduce the area, from which one sensor takes signals and the damage induced reflection may then have sufficient amplitude to be detected. In this work a phased array concept is used to perform a beam-forming procedure. This technique uses an array of transducers placed close to each other instead of covering the whole area to be inspected with transducers. It allows to amplify the signal to such an extend that reflection from damage may be easily identified. The concept has been used by many authors [4-11] with promising results. In this paper the idea is modified so that it removes ambiguity in damage localisation. Four arrays have been used, which are placed in such a manner that the angular difference between them is 45º.
The simulated test case
[image:4.595.179.403.466.642.2]The proposed configuration was used to analyse an aluminium plate of dimensions 1 m x 1 m x 0.01 m modelled by the Spectral Finite Element Method [1,2] (40 x 40 elements, 36 nodes per element). Excitation and registration of waves in the specimen is realised in nodes. The applied excitation is in the form of a wave packet (5-cycle sine modulated by the Hanning window). The main frequency of this packet is 100 kHz (Fig. 1).
Fig. 1: Excitation signal – 5-cycle 100 kHz Hanning window modulated sine
Generally, when piezoelectric transducers are used to generate waves in plates both symmetric (S0, S1, S2, …) and anti-symmetric (A0, A1, A2, …) modes exist and the number of
these modes depends on the product of the excitation frequency and the plate thickness. There
are only two fundamental modes, A0 and S0 , that propagate up to almost 2 MHz·mm. In the
test case investigated (100 kHz·1 cm) there are only two Lamb wave modes- a symmetric one and an anti-symmetric one. However, the computer program used to model the aluminium
plate allows to investigate the propagation of fundamental anti-symmetric A0 Lamb waves
only and this is the mode with a rather significant amplitude. So we shall concentrate on the anti-symmetric mode only. This simplifies the wave propagation phenomenon but it also makes the registered signals easier to interpret. One should also bear in mind that the group and the phase velocities of the fundamental symmetric and anti-symmetric modes for the frequency of excitation and plate thickness considered (100 kHz·1 cm) differ significantly [12,13]. Therefore, the fact that for the algorithm presented here the wave group velocity is essential, justifies the restriction of the investigation to one mode only.
Phased array theory
Linear phased arrays are made of a number of piezoelectric transducers placed along a line at the same distance between each other. Waves generated by the transducers have an omni-directional character and create a pattern, which is a result of the superposition of the waves generated by each transducer individually. A sweep beam, which can be steered, is created if each transducer from the set excites waves with an individually adjusted time delay. By changing the steering angle from 0 to 360º and calculating the time delay for each transducer, an area of the structure around the array of transducers can be interrogated. This concept is known from radars, where the dish sweeps the space with a focused ray for target searching. When the waves from the radar find an object, they (the waves) are reflected from it and they return with some time delay. If the velocity of the wave generated by the radar and the angle of turn of the radar dish are known, then the position of the object can be determined by simple calculations. This technique is also used in damage detection but instead of a rotating radar dish, phased arrays are used for the beam-forming procedure. The principle of work of a phased array is explained below.
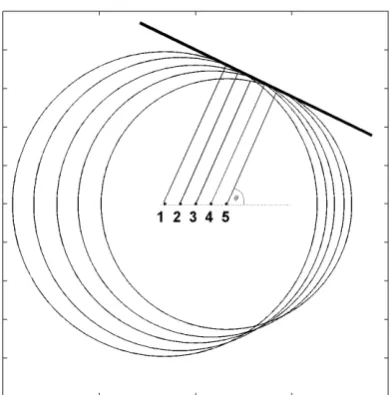
Let us consider a set of n transducers that can generate and receive elastic waves. It is assumed: 1) that all transducers are omni-directional sources of waves and 2) that the rays from the transducers are parallel. The second assumption is justified only if the transducers are placed close to each other and the discontinuity causing wave reflection is far enough from the array. The greater the distance between the transducers the farther the discontinuity should be to make the idea of beam-forming useful. The beam-forming procedure is based on the signal interference principle. The procedure of producing a wave front can be divided in two cases: for a signal transmitted and for a signal received [5]. In order to focus the total signal in the direction indicated by the angle θ (Fig. 2), the i-th array element should excite a wave with an individual time delay ti relative to the 1-st PZT (Fig. 2) given by the formula:
( )
, cos l t i i c θ ⋅= ( 1 )
where li is the distance between the i-th and the 1-st transducer and c is the wave group
velocity. The same procedure must be repeated for the signals arriving to the sensors, which
are backscattered from any obstacles situated at an angle θ because the ninth transducer is
closer than the first one to discontinuities at an angle θ. Focusing may be realised in two
ways: electronically (electronic system can excite waves with individual time delays) or by a computer algorithm (all transducer excite waves individually and signal processing procedures based on time shifting are applied to the gathered signals). The angleθ is changed from 0 to 360º and as a result the wave is amplified at angles corresponding to obstacles and faded for the rest. The backscattered wave amplitudes are shown in Fig. 3.
Fig. 2: Illustration of the beam-forming procedure based on five transducers. thin lines indicate propagating wave fronts, thick line represents created wave front at the direction of angle
a) b)
Fig. 3: Polar plot showing amplification of amplitude in the case of: a) one crack for array placed horizontally , b) two cracks for the array at the angle of 135º; maximal value of amplitude for every angle
is plotted
The phased array algorithm
In this paper results from numerical simulations only are discussed and the focusing of the beams is performed by a computer program as explained above. In this numerical simulation waves are generated and registered by each transducer of the phased array. The process of waves generation and sensing is conducted in n steps. At each step one transducer generates waves, which are registered by all transducers. For an n element phased array this makes a total of n2 signals. Then a signal processing procedure is applied, which relies on the time shifting for each collected signal with a time delay related to the spacing of transducers and the angle, at which the beam is created. Signals registered in all sensors when the excitation comes from the first transducer are shifted in time to this transducer and then summed. In the next step the same procedure is repeated for the second transducer. This procedure is repeated for each sensor of the array. As a result n signals are obtained. This is how the beam-forming procedure for generating waves is carried out.
[image:6.595.106.500.344.523.2]Similar operations are performed for the beam-forming procedure for the arriving signals. This can be achieved by shifting all the n signals to the chosen transducer and summing them. This transducer is the point of origin for a virtual sweep beam.
Due to the discrete character of all signals, two time shifting algorithms are used. In the first algorithm the calculated time delay is divided by a time step resulting from the simulation and rounded (integer number is needed) to obtain a number of points for the discrete time shift. In the second approach an interpolation procedure is used (a cubic spline interpolation was used in this study). Both shifting methods have been tested and they give compatible results. The time delays are calculated for beam angles from 0 to 360º with a chosen step. Then the signals are shifted in time and focused. Amplification of the reflected wave occurs in the direction indicating damage (Fig. 3) and in the symmetrically opposite direction relative to the array.
The signals are then transformed from the time domain into the physical domain of the structure. The used MATLAB plot procedures interpolate the signals for the rest of the angles. As a result a three dimensional damage map covering the area of the investigated structure is created [5] (Fig. 6). The x and y axes indicate the coordinates of the investigated surface area. Values on the z axis represent the amplitude of the interrogating signal at the point (x, y) of the structure. In order to facilitate the map analysis, the squared signals are plotted. The distance from the point of origin of the virtual sweep beam to the damage can be calculated if one knows the time of flight (TOF) of the amplified backscattered wave from the damage and the velocity of wave propagation in the material investigated.
The multi-phased array
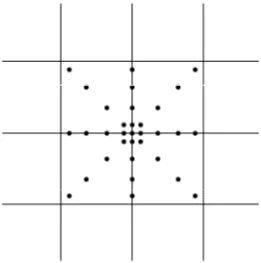
[image:7.595.236.367.479.611.2]In this work a phased array of transducers is replaced by four phased arrays (9 transducers each) forming a star configuration (Fig. 4). The transducers from each array are arranged on a line. As can be seen (Fig. 4) the distances between the transducers within one array are not constant. The transducer spacing for the horizontal and the vertical arrays is the same. The remaining two arrays are made of equally spaced transducers, but the distances between the transducers are different from those for the horizontal and the vertical arrays.
Fig. 4: Proposed transducer configuration
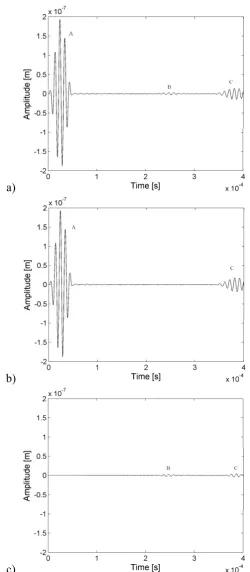
The beam-forming algorithm is applied independently to each array. As a consequence four maps of the scanned area are obtained. These maps are made of signals, which represent the difference between the damaged and the intact plate signals (Fig. 5a and Fig. 5b). It can be seen (Fig. 5c) that the influence of damage on the obtained signals begins at the moment when the damage reflected wave arrives at the sensor.
a)
b)
[image:8.595.172.423.68.642.2]c)
Fig. 5: Signal difference calculation, a) – damage plate signal, b) – intact plate signal, c) – difference signal; A – an excitation, B – refelection from damage, C – reflection from boundary
As can be noticed, the line on which the transducers from one array lie, is a symmetry line of a map (Fig. 6). Therefore, a single map may indicate two damage areas (ghost damage) even if there is only one (Fig. 6a). In order to remove this ambiguity an algorithm have been proposed joining the four component maps into one (Fig. 7). This final map is simply a product of the four component maps. It sharpens the image of damage more than the sum of
the maps and allows a more precise localisation of a defect than in the case of one component map.
a) b)
[image:9.595.70.494.104.448.2]c) d)
Fig. 6: Four component maps – stripe in the middle represents an array for which the map was generated, black box indicates the simulated damage (90% stiffness reduction in one spectral element)
Fig. 7: Result map – all four maps joined for damage as 90% stiffness reduction
The above results (Fig. 6, Fig. 7) show the localisation of damage modelled as a 90% stiffness reduction in one spectral element. The scale of colours is linear from white (indicating minimum level of signal amplitude) to black (maximum level of signal amplitude).
[image:9.595.202.382.493.671.2]Damage detection and localisation
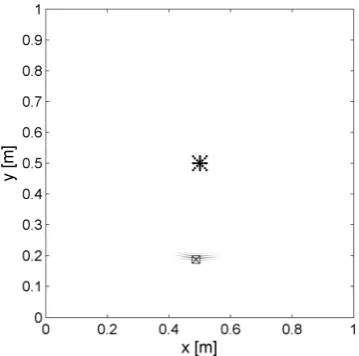
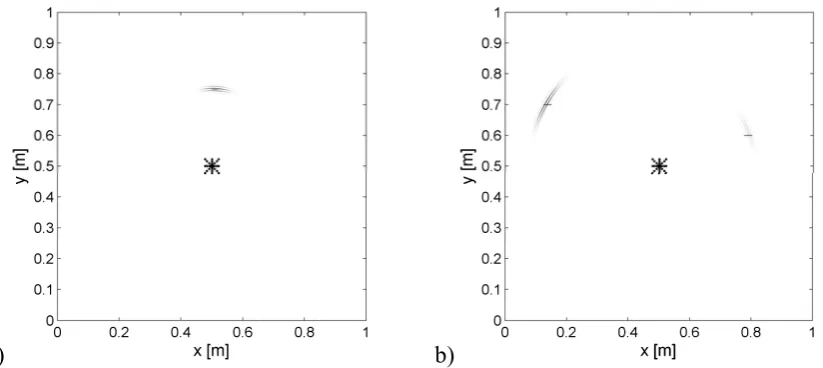
A few damage examples are considered to test the efficiency of the proposed configuration. Firstly, damage as 90% stiffness reduction in one spectral element was considered (Fig. 7). This represents a square of the size 2,5 cm x 2,5 cm which is 6% of the total plate surface. It can be clearly seen that for this case the defect is precisely localised. The signature of the damage is only present near the true defect position and nowhere else. No ghost damage is visible because the joining procedure removed this problem. The results for stiffness reduction damage look promising, and so a second test was done for a 2,5 cm long crack simulated by node separation. Fig. 8a) depicts the map resulting from such a damage scenario. It can be appreciated that in this case again the generated map indicates very clearly the crack position on the analysed aluminium plate.
a) b)
Fig. 8: a) Damage map for 2,5 cm long crack, b) Damage map for two 2,5 cm long cracks
These results suggest that the proposed star configuration of the beam-forming procedure is able to detect two types of damage, namely cracks and distributed damage, modelled by stiffness reduction. We should however point out that just one single example for each damage type is not enough in order to verify the algorithm and more tests need to be done for different locations and extents of the damage.
When monitoring a plane structure or structural part one should keep in mind that there might be more than one defect. This is why our next task was to examine how the algorithm copes with two cracks. Fig. 8b) depicts a damage map of the plate with two 2,5 cm long cracks. Both defects are successfully indicated although one of them (the left one) gives a stronger signal.
8
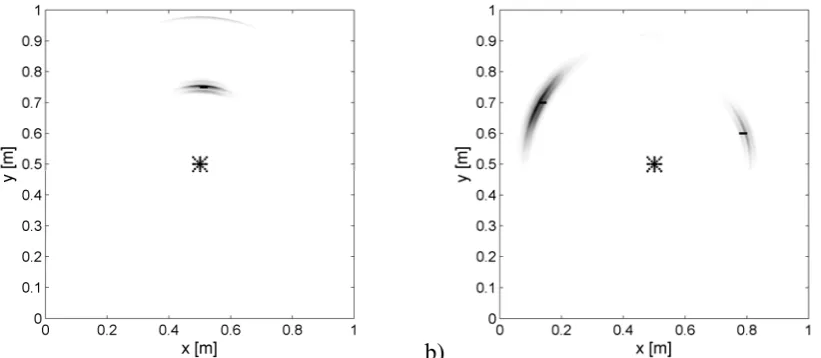
[image:10.595.92.504.270.454.2]investigation. Points of the structure, which lie on the damage will have a high value of similarity measure. For comparison Fig. 10a) and Fig. 10b) present maps plotted using the described technique for the same damage scenario as in the case of Fig. 8a) and Fig. 8b), respectively. It can be noticed that the similarity measure modifies the maps in such way that the defect image is more apparent but not so well localised on the structure.
Fig. 9: Illustration of building a similarity measure for signal processing
a) b)
Fig. 10: Damage maps plotted using introduced similarity measure a) for 2,5 cm long crack, b) for two 2,5 cm long cracks,
Conclusions
In this paper a damage localisation procedure based on a star configuration of transducers has been successfully developed. An algorithm for generation of the damage map is presented. Using this technique it was shown that local stiffness reduction as well as cracks (one and two cracks) can be easily detected.
Two methods for obtaining a damage map have been presented, both giving satisfying results.
Future analysis should concentrate on detection of more than two defects. It is also important to investigate the influence of the number of transducers on the generated maps. The reduction in their number will lead to reduction in the cost of the detection system. Nevertheless transducer prices are so high to restrict the implementation of the proposed configuration. In the future the proposed detection procedures will be verified based on measured signals coming from real objects.
[image:11.595.98.509.360.539.2]10 Acknowledgements
The authors of this work would like to gratefully acknowledge the support for this research provided by the Smart Structural System Technologies (S3T) EUROCORES Programme via Smart sensing for Structural Health Monitoring (S3HM) project and the NATO project?.
References
[1] A. Zak, M. Krawczuk, W. Ostachowicz, Propagation of in-plane waves in an isotropic panel with a crack, Finite Elements in Analysis and Design 42 (2006), 929-941.
[2] A. Zak, M. Krawczuk, W. Ostachowicz, P. Kudela, M. Palacz, Elastic wave propagation
in a cracked isotropic plate, Structural Health Monitoring (2006), 316-323.
[3] U. Peil, S. Loppe, Detection of structural changes by means of piezo disc, Structural Health Monitoring (2006), 133-140.
[4] L. Yu, V. Giurgiutiu, Advanced signal processing for enhanced damage detection with piezoelectric wafer active sensors, Smart Structures and Systems (2005), 185-215. [5] V. Giurgiutiu, J. Bao, Embedded-ultrasonic structural radar for in-situ structural health
monitoring of thin-wall structures, Structural Health Monitoring (2004), 121-140.
[6] J. Pena, C.P. Melguizo, R. Martinez-Ona, Y.G. Ullate, F.M de Espinosa Freijo, G. Kawiecki, Advanced phased array System for structural damage detection, Structural Health Monitoring (2006), 244-250.
[7] W. Shi-Chang, S. Yijun, Optimum beam steering of linear phased arrays, Wave Motion
29 (1999), 245-265.
[8] S. Sundararaman, D. E. Adams, E. J. Rigas, Biologically inspired structural diagnostics through beamforming with phased transducers arrays, International Journal of Engineering Science 43 (2005), 756-778.
[9] P. Fomme, P. Wilcox, M. Lowe, P. Cawley, Development of a permanently attached guided ultrasonic waves array for structural integrity monitoring.
[10] W.A.K. Deutsch, A. Cheng, J.D. Achenbach, Self-focusing of Rayleigh waves and Lamb waves with a linear phased array, Research in Nondestructive Evaluation (1997), 81-95.
[11] A.S. Purekar, D.J. Pines, Interrogation of beam and plate structures using phased array concept, International Conference on Adaptive Structures and Technology.
[12] D. W. Greve, J. J. Neumann, J. H. Nieuwenhuis, I. J. Oppenheim, N. L. Tyson, Use of Lamb Waves to Monitor Plates: Experiments and Simulations.