Mater. Res. Soc. Symp. Proc. Vol. 1 © 2012 Materials Research Society DOI: 10.1557/opl.2012.216
Characterization of InGaN and InAlN Epilayers by Microdiffraction X-Ray Reciprocal Space Mapping
V. Kachkanov1, I.P. Dolbnya1, K.P. O’Donnell2, K. Lorenz3, S. Pereira4, R.W. Martin2, P.R. Edwards2, I.M. Watson5
1Diamond Light Source Ltd, Didcot, United Kingdom
2Department of Physics, SUPA, University of Strathclyde, Glasgow, Scotland, United
Kingdom
3Instituto Tecnologico e Nuclear, Sacavem, Portugal.
4CICECO, Departamento de Fisica and I3N, Universidade de Aveiro, Aveiro, Portugal 5Institute of Photonics, SUPA, University of Strathclyde, Glasgow, Scotland, United
Kingdom
ABSTRACT
We report a study of InGaN and InAlN epilayers grown on GaN/Sapphire substrates by microfocused three-dimensional X-ray Reciprocal Space Mapping (RSM). The analysis of the full volume of reciprocal space, while probing samples on the microscale with a focused X-ray beam, allows us to gain uniquely valuable information about the microstructure of III-N alloy epilayers. It is found that “seed” InGaN mosaic nanocrystallites are twisted with respect to the ensemble average and strain free. This indicates that the growth of InGaN epilayers follows the Volmer-Weber mechanism with nucleation of “seeds” on strain fields generated by the a-type dislocations which are responsible for the twist of underlying GaN mosaic blocks. In the case of InAlN epilayer formation of composition gradient was observed at the beginning of the epitaxial growth.
INTRODUCTION
The III-nitride semiconductors (GaN, InN, AlN and their alloys) have become a subject of intense research in the past fifteen years due to the unique physical properties of these materials, which include a wide direct bandgap, remarkable mechanical strength and high melting
temperatures, as well as their huge commercial utility. The technological breakthrough in the epitaxial growth of InGaN structures [1] has revolutionized the optoelectronic industry, leading recently to robust and compact all-solid state light sources covering the broad spectral range from infra-red to ultraviolet. However, further advances in nitride technology, for example nitride laser diodes emitting in the green, red and ultra-violet spectral regions, require a deeper understanding of the microstructure and nanostructure of InxGa1-xN and InxAl1-xN alloy films.
X-ray Reciprocal Space Mapping (RSM) is a powerful tool to explore the structure of materials. However, RSMs are usually measured in two dimensions (2D) ignoring the third dimension of diffraction space volume. The idea of full three-dimensional (3D) diffraction space mapping to obtain information on the 3D structure of materials was first introduced by Fewster
et al [2]. In this paper we report the study of InGaN and InAlN epilayers by 3D RSM while probing the material with a microfocused X-ray beam.
EXPERIMENT
The samples studied were two nominally undoped wurtzite InxGa1-xN epilayers, labelled A
and B, and one InxAl1-xN epilayer, grown by Metalorganic Chemical Vapor Deposition (MOCVD) on GaN/Al2O3 (0001) substrates. The nominal thickness of the InGaN and InAlN layers was 250 nm and 120 nm respectively. The GaN buffers were 1 µm or 2 µm thick for InAlN and InGaN samples respectively.
The microdiffraction experiments were carried out on beamline B16 at the Diamond Light Source, UK. The synchrotron storage ring operated at 3 GeV with a current of 200 mA. The X-ray energy, selected by a Si(111) monochromator, was fixed at 12400 eV (1 Å). The X-X-ray beam was focused by beryllium Compound Refractive Lenses (CRLs). A set of 63 lenses was used to focus the X-ray beam down to a spot size with full widths at half maximum (FWHM) of 3.2 (horizontal) µm ×1.6 µm (vertical). The focal length was 750 mm and the effective aperture of the CRLs was calculated to be Deff≈0.6 mm resulting in horizontal and vertical incident beam
divergences of ~0.8 mrad. The demagnification factor of the lens system was estimated to be ~58. The required sample rotations and translations were performed using a high precision 5-circle Huber diffractometer with 0.1 millidegree resolution and a Huber XYZ sample stage. A Pilatus 100k detector with pixel size of 0.172×0.172 mm was used to record the diffracted X-rays from the sample. The measurements of the full 3D shape of the (1013)Reciprocal Lattice Point (RLP) were done in skew symmetric geometry by changing the incident angle ω to the
diffracting plane and recording the 2D diffraction pattern. The reciprocal space subtended by the detector, i.e. each detector image, was converted into scattering vector components in the
reference frame of the GaN substrate with Qx lying along [120], Qy along [100] and Qz along ]
001
[ directions. All images obtained during angular scans were later combined to produce full 3D volume of RLP. The effective X-ray beam spot on the sample was ~4×5 µm FWHM for the
) 3 1 10
( reflection.
DISCUSSION
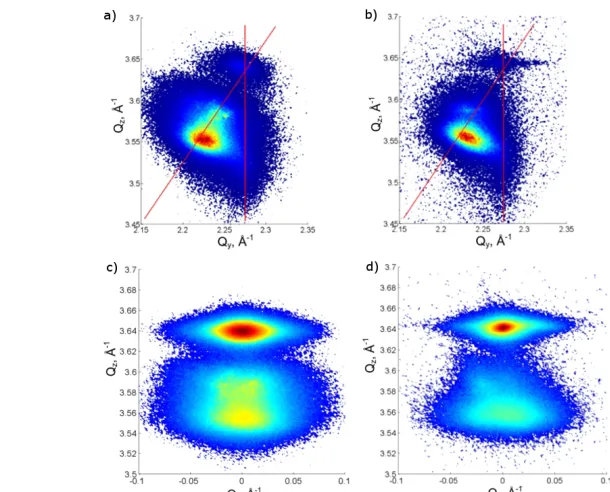
Figures 1(a) and 1(b) show the full volume of (1013) RLP for samples A and B respectively.
The presence of “tails” on either side of Qx=0 plane is clear. Figures 2(a) and 2(b) show projections of the(1013) RLP onto the Qy-Qz plane for samples A and B measured at ω=19.424° and ω=19.357° respectively. The (1013) RLP corresponding to the InGaN epilayer is broadened due to both compositional gradient and strain variation. Reciprocal space coordinates Qy and Qz of the InGaN RLP are directly related to the lattice constants a and c respectively. Knowing the lattice parameters it is possible to estimate the InN content x by finding physically acceptable solutions of the two dimensional Poisson ratio equation [3]. The following input parameters required for the solution of Poisson equation were used: lattice constants cGaN=5.1850 Å, aGaN=3.1892 Å for GaN [4], cAlN=4.98 Å, aAlN=3.111 Å for AlN and cInN=5.7033 Å [5], aInN=3.5378 Å for InN [6], and elastic constants [7] c13=103 Gpa and c33=405 Gpa for GaN, c13=99 Gpa and c33=389 Gpa for AlN [8] and c13=92 Gpa and c33=224 Gpa for InN. Sample A exhibits a compositional gradient: the InN fraction estimated from the breadth of the RLP varies from ~12% up to ~25%. The strain state of InGaN epilayer in this sample varies from fully relaxed to pseudomorphic to the substrate. The center of mass (COM) of the (1013) RLP
InGaN with 12% of InN is completely relaxed. For sample B, the InN content ranges from ~10% to ~24% and the strain state changes from relaxed to pseudomorphic. Again, the COM of the RLP corresponds to 20% InN under compressive strain and the “seed”, with 10% of InN, is completely relaxed.
Figure 1. Full 3D view on (1013) RLP for sample A (a) and sample B (b). The plane represents a cut along Qx=0.
Figure 2. (a) and (b) show projections of the (1013) RLP onto the Qy-Qz plane for sample A and sample B measured for ω=19.424° and ω=19.357° respectively, (c) and (d) are projections of the
) 3 1 10
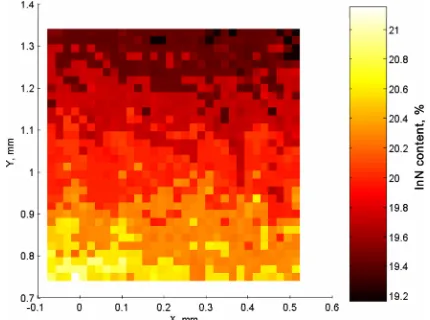
[image:3.612.127.432.383.629.2]A spatial scan across the sample B, monitoring the position of the COM for the (1013) RLP and calculating the InN content at each point, revealed the presence of a weak lateral
composition gradient as shown in Figure 3. Microfocusing allows us to disentangle lateral and vertical composition gradients on the length scales defined by the effective size of the X-ray beam. Figure 3 shows that the lateral composition variation is macroscopic and that it is much weaker than the vertical composition variation for a particular point on the sample. Figures 2 (c) and (d) show the projection of the (1013) RLP on to the Qx-Qz plane for samples A and B, respectively. What is observed here is that the “seeds” of composition gradient in both sample are inclined with respect to the COM of the InGaN RLP. In the case of sample A there are two somewhat diffuse “seed” tails inclined by 0.40° and 0.13° respectively. In the case of sample B there is only one sharp “seed” inclined by an angle of 0.19°. Heteroepitaxial films with large lattice mismatch to their substrates and exhibiting a high density of dislocations are best described as a collection of mosaic crystals [9]. The layer is assumed to consist of single crystallites, called mosaic blocks, tilted and twisted with respect to each other. Taking into account the geometry of the present experiments, a tilt θ along the[120] direction corresponds mainly to a twist φ with respect to the [001] direction through the following relation:
, tan sin
1
tan θ
χ
ϕ=− (1)
where χ is the angle between the (1013) and (0001) planes. Thus the observed tilting of the “seed” corresponds to twists by 0.75° clockwise and 0.37° anticlockwise around the [001] axis for sample A. For sample B “seed” the crystallites are twisted by 0.35° clockwise around the
] 001
[ axis.
Figure 3. Map of InN content x for InxGa1-xN sample B measured at ω=19.220°.
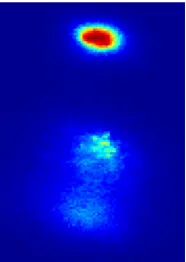
[image:4.612.198.413.394.554.2]Figure 4. The X-ray diffraction intensity speckle pattern for sample A observed during spatial scan. Note that the image is not transformed to reciprocal space.
Figure 5(a) shows the projection of (1013) RLP on onto the Qy-Qz plane for InxAl1-xN sample. The main peak corresponds to the ~16% of InN. Composition gradient is observed ranging from 20% to 9% of InN. Note that disorder as indicated by the breadth of RLP of is increasing when going from 20% to 9% of InN. Rutherford Backscattering (RBS) experiments confirmed the existence of composition gradient as shown in Figure 5(b). Simultaneous fitting of 5° and 70° off the sample normal curves using NDF code [11] and assuming three layer structure of
composition gradient produced following results:1st layer: 52 nm thick, x=0.085; 2nd layer: 34 nm thick, x=0.129; 3rd layer: 35nm thick, x=0.167. The order of the layers is from surface to the epilayer/GaN buffer interface. The compositions estimated from RBS are in very good
agreement with that estimated by X-ray diffraction. Thus, the disorder as reflected by the breadth of RLP is indicative of growth direction: it increases with growth time.
Figure 5. (a) Projection of (1013) RLP on onto the Qy-Qz plane for InAlN sample measured at ω=20.251°, (b) Simultaneous fitting of experimental RBS spectra using NDF code [11], signal due to Indium atoms is indicated by arrows.
CONCLUSIONS
[image:5.612.260.353.71.202.2] [image:5.612.133.480.412.595.2]nanocrystallites, less than ~250 nm in lateral size, are observed at the lower end of composition gradient. Formation of strain-free InGaN islands during the initial phases of growth was also observed by in-situ 2D RSM [12]. Most importantly it was observed that structural and compositional disorder increases with growth time thus supporting suggestion that the islands observed in our ex-situ experiments correspond to the beginning of epitaxial growth. The twist of InGaN nanocrystallites is caused by the twist of the underlying GaN mosaic blocks which in the case of III-nitrides was found to be related to a-type edge dislocations [13]. The average size of the mosaic blocks in the GaN substrate, estimated from the FWHM of the diffraction peak along Qy [14], is ~50 nm and ~100 nm for samples A and B respectively. The lattice mismatch between InGaN and GaN may be relieved by the microstrain associated with a-type edge dislocation. Thus, the initial stages of InGaN epitaxial growth correspond to Volmer-Weber growth with the nucleation of “seed” islands on strain fields generated by the a-type edge dislocations. As more of the substrate surface is covered, the structural disorder increases, as indicated by the breadth of the InGaN RLP. In case of InAlN epilayer the composition gradient was observed at the beginning of epitaxial growth. The existence and direction of composition gradient was confirmed independently by RBS. Thus, three-dimensional shape of RLP can provide information about epitaxial growth of semiconductor alloy epilayers.
ACKNOWLEDGEMENTS
The authors are grateful to Wim van der Stricht for providing the InGaN samples used in this study. Dr K. J. Sawhney is acknowleged for his help during experiments. S. Pereira
acknowledges funding from FCT (Portugal) through project Ref. PTDC/CTM/101453/2008. Diamond Light Source is acknowledged for providing beamtime.
REFERENCES
1. S. Nakamura, M. Senoh, T. Mukai, Jpn. J. Appl. Phys. 32, L8 (1993). 2. P.F. Fewster, N.L. Andrew, J. Phys. D: Appl. Phys. 28 A97 (1995).
3. S. Pereira, M. R. Correia, E. Pereira, K. P. O’Donnell, E. Alves, A. D. Sequeira, N. Franco,
Appl. Phys. Lett. 79, 1432 (2001) .
4. T. Detchprohm, K. Hiramatsu, K. Itoh, I. Akasaki, Jpn. J. Appl. Phys., Part 2 31, L1454 (1992).
5. M. Tanaka, S. Nakahata, K. Sogabe, H. Nakata, M. Tabioka, Jpn. J. Appl. Phys. 36, L1062 (1997) .
6. W. Paszkowicz, Powder Diffr. 14, 258 (1999). 7. A. F. Wright, J. Appl. Phys. 82, 2833 (1997).
8. L.E. McNeil, M. Grimsditch, R.H. French, J. Am. Ceram. Soc. 76, p. 1132 (1993). 9. M.A Moram, M.E. Vickers, Rep. Prog. Phys. 72, 036502(2009).
10. M. Sutton, S.G.J. Mocherie, T. Greytak, S.E. Nagler, L.E. Bermans, G.A. Held, G.B. Stephenson, Nature 352, 608 (1991).
11. N. P. Barradas, C. Jeynes, R. P. Webb, Applied Physics Letters 71, 291 (1997).
12. M.-I. Richard, M. J. Highland, T.T. Fister, A. Munkholm, J. Mei, S. K. Streiffer, C. Thompson, P. H. Fuoss, G. B. Stephenson, Applied Physics Letters 96, 051911 (2010).
13. T. Metzger, R. Hopler, E. Born, O. Ambacher, M. Stutzmann, R. Stommer, M. Schuster, H. Gobel, S. Christiansen, M. Albrecht, H. P. Strunk, Philos. Mag. A77, 1013 (1998).