Using Otoacoustic Emissions as a Biometric
Matthew A. Swabey1, Dr. Stephen P. Beeby1, Prof. Andrew D. Brown, and Dr. John Chad2
1 School of Electronics and Computer Science, University of Southampton,
Southampton SO17 1BJ, UK
2 School of Biomedical Sciences, University of Southampton, Southampton,
SO17 7PX, UK
Abstract. This paper presents research into using otoacoustic emissions (OAE) as a biometric. OAE are a group of sounds emitted by the cochlea of the ear. The main types are spontaneous OAE which are continuously emitted and the transient and distortion product types which are emitted after stimulation.
1
Introduction
Otoacoustic Emissions (OAE) are a sound wave originating from an active pro-cess naturally occurring in the cochlea of the ear. OAE have been studied by the medical profession since their detection in 1977 by David Kemp [1],[2] as a tool for clinical investigation into the ear’s health and for analysis of its operation. OAE are known to exhibit significant differences, for instance in the emission frequencies and numbers of spontaneous otoacoustic emissions between the gen-ders [3] and between people of different ethnic origins [4], giving credibility to speculation that OAE are unique.
2
Otoacoustic Emissions
OAE originate from the human body’s solution to improving the precision and threshold of hearing. Incoming sounds are mechanically separated into their component frequencies. As they travel up the cochlea these frequencies peak and stop at a distance proportional to their frequency. In a purely mechanical system energy loss and damping forces in the cochlea would cause quiet sounds to be beneath the detection threshold and degrades classification of sounds. The active process improves this by adding power to the sound as it travels. The OAE is a byproduct of this added power reflected by structural individuality’s, then altered by passing back through the middle ear and out of the eardrum. The generation and operation of OAE is currently not fully characterised or understood. OAE can be classified into three broad types:
Spontaneous Otoacoustic Emissions (SOAE) A spontaneous otoacous-tic emission is a pure tone at a stable frequency that is continually emitted attributed to positive feedback in the active process. The exact method of gen-eration is unknown however it is suggested that SOAE derive from structural irregularities within the cochlea which act as an energy reflector.
SOAE are currently thought to be present in approximately 75% of the pop-ulation [5],[6],[7]. A SOAE is a single pure tone at a fixed frequency up to 2kHz and a fixed amplitude. The maximum observed amplitude is approximately 20dB SPL (sound pressure level) however the mean observed amplitude for adults is between -3 and 0dB SPL [8],[9]. An ear may emit more than one independent SOAE simultaneously.
Distortion Product Otoacoustic Emissions (DPOAE) These are evoked by applying two continuous sine waves at similar frequencies. A set of sine waves are then ‘produced’ at set frequencies defined by the following equationnf1−mf2 where f1 is the frequency of the lower of the two stimulus tones, f2 the higher andnandmpositive integers. These “distortion products” magnitude is greatest for n= 2 and m = 1 and decays with increasing nand m. A DPOAE from a female adult’s ear stimulated by two sine waves at 1.820kHz and 2.196kHz with magnitudes 65dB SPL and 55dB SPL had the 2f1−f2component as the largest response, at 1.444kHz with a magnitude of 10dB SPL. The 3f1−2f2and 2f2−f1 components were also detected at -2.5dB SPL and -16.3dB SPL respectively. DPOAE have been recorded at frequencies as high as 7kHz however most adult DPOAE are recorded in the 1-2kHz range. They are also a characteristic of the hearing process.
3
Otoacoustic Emissions as a Biometric
In order for OAE to be used as a physiological biometric, they should be ro-bust and relatively easy to capture. Of the three types discussed above the least suitable is the spontaneous otoacoustic emission. It is currently detected in only 75% of the population and this requires laboratory conditions and sophisticated equipment. DPOAE and TEOAE are more suitable as they are stronger re-sponses, typically 15dB SPL at maximum compared to a typical SOAE at -3 to 0dB SPL.
When comparing hardware required for DPOAE vs. TEOAE the TEOAE is more straightforward. Acquiring a DPOAE requires the two frequencies to be swept across a frequency range and the magnitude of the largest component recorded. This technique requires a probe with two speakers and a microphone with accompanying sine wave generators to provide the stimulus. In order to dis-tinguish the response from the stimuli an analogue to digital converter (ADC) with a large dynamic range (typically 16 bits) is conventionally required to pro-vide the analysis software with suitable data. TEOAE, however, customarily uses a square pulse stimulus so can use a single speaker and a single microphone to acquire the information. Since the stimulus dies away before the TEOAE emerges a large dynamic range ADC is not required.
All OAE are vulnerable to hearing loss. Based on a study in the UK [11] the worst case, where any damage to hearing prevents the biometric, 84.95% of the population is suitable and this rises to 96.91% in the best case. As hearing loss affects the OAE having parial damage could lead to improved chances of identification.
TEOAE were selected for the initial research due to the reduced hardware requirements, but DPOAE also offers excellent potential as a biometric.
3.1 Uniqueness
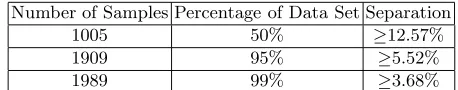
Number of Samples Percentage of Data Set Separation
1005 50% ≥12.57%
1909 95% ≥5.52%
[image:4.612.192.421.65.110.2]1989 99% ≥3.68%
Table 1.The separation expressed as a percentage computed for proportions of the data set.
further study an analysis was performed on subset of a large dataset collected in the UK for medical purposes that is fully detailed in [12]. This subset con-sisted of the non-linear responses of 2009 individual’s right ears computed from TEOAE. The non-linear response is the combination of an individual’s TOAE recorded at several increasing intensities and then manipulated to attenuate any linear components, maximising the information from the OAE as opposed to characteristics of the recording process. Manual examination of a small random sample of the data indicated the power spectra showed very few similarities and would be suitable for a simple analysis.
A closed rank calculation of the euclidean distance of the frequency compo-nents of the power spectra was chosen to quantify the separation between in-dividuals. This analysis also offers the attraction that working in the frequency domain gives immunity to phase difference and provides a single value for com-parison.
The separation analysis was performed on one of the two non-linear responses of the subjects right ears. The non-linear responses, detailed fully in [12], contain the most information from the TEOAE as they attenuate the linear character-istics of the ear canal and recording process.
The power spectra of the nonlinear component is extracted by performing a discrete fourier transform and calculating the absolute value of every complex component. The non-linear responses are 256 samples long so after the fourier transform there are 128 extracted components (Nyquist’s Theorem). The first component, representing the constant offset, is set to 0. Treating the 128 compo-nents as a 128 dimensional vector in euclidean space we can simply compute the separation between them using Equation 1 which gives the euclidean separation S between the two power spectra,aandb.
S=p((a1−b1)2+ (a2−b2)2+. . .+ (an−bn)2) (1) The individual distance is then compared to the rest of the individuals in the dataset and the distance to the closest neighbour recorded.
The data was held in a MySQL database and the mathematical analysis was performed using a C++ program implemented with the Fastest Fourier Transform in the West (FFTW) discrete fourier transform library [13].
3.2 Results and Discussion of Uniqueness Analysis
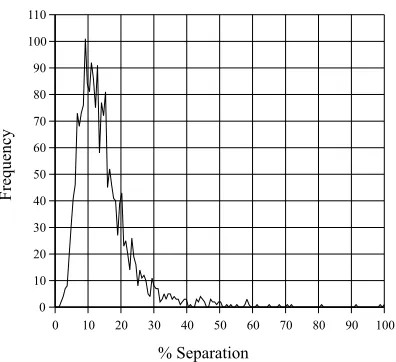
Fig. 1.Distribution of the Separation
system variation (all sources of error) is kept than 3.68%, we can identify 1989 individuals from the 2009 in the set (i.e. 99%). In the analysis of the whole data set the smallest separation was not zero but 1.26% meaning if the system noise was further reduced to less than 1.26% we could uniquely identify the entire set of 2009 individuals.
Figure 1 shows the frequency of each percentage separation. As discussed above note that the distribution does not extend to zero. Since this analysis relies on TEOAE and we have no results very close to zero this confirms that everyone in this sample set had a TEOAE.
This exercise has successfully discriminated between 2009 individuals using a computationally non-intensive analysis. Due to the large size of the sample set we are confident that TEOAE can be used as the basis of a successful biometric system for distinguishing between individuals.
3.3 Portable Low Cost Acquisition System
TEOAE are normally collected by a probe sealed into the inner ear. This sealing process is done by a medically trained person selecting the correct sterile foam tip and fitting the probe into the ear canal. The probe contains the necessary speakers and microphones to stimulate and capture the emission. A digital signal processor system or the host PC emits the stimulus then processes the data and stores the results. To detect the TEOAE a number of signal processing techniques are used to improve the signal to noise ratio as it is such a small signal (20dB SPL is equivalent to 10−12W).
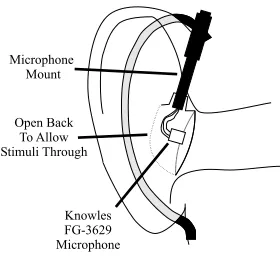
Fig. 2.Schematic of the Microphone Mount on a Left Ear
stimulated and captured TEOAE and DPOAE [14]. Recently a paper on work done with humans [15] using a conventional OAE probe held to the ear using a wire frame with a soft tube that extended into the canal but not sealed into the canal was performed at the University of Southampton Institute of Sound and Vibration Research (ISVR).
Recent work within the University of Southampton School of Electronics and Computer Science has also successfully demonstrated a superior on the ear approach. Figure 2 shows the schematic of a novel probe front end that is mounted within a set of conventional headphones that cover a persons ears and seal to the skull using a foam / rubber strip as a stimulus source this probe / stimulus source has proved effective in practise.
The DSP functionality required is provided by a Pentium III based personal computer (PC) hosting a National Instruments AT-MIO-16E-10 DAQ (data ac-quisition) card [16] running custom software. This functionality is easily fitted to a laptop system, allowing easy transport.
4
Conclusions
TEOAE have been identified as offering the most likely OAE to act as a successful biometric characteristic. They are universal in the normal hearing population, have one of the strongest detectable responses of OAE.
An analysis of a data set of 2009 random individuals based on the euclidean distance of the power spectra showed that 99% of the data set was seperated by 3.68%. This therefore would allow the correct identification of 99% of the individuals if the system error is kept less than 3.68%. A more optimised analysis will increase this separation and improve discrimination.
References
1. Kemp, D.: Acoustic resonances originating inside the cochlea. British Society of Audiology short papers meeting. (1978)
2. Kemp, D.: Stimulated acoustic Emissions from within the human auditory system. J. Acoust. Soc. Am.64(1978) 1386–1391
3. Bilger, R., Matthies, M., Hammel, D. and Demorest, M.: Genetic-implications of gender differences in the prevalence of spontaneous otoacoustic emissions. J. Spch. Hearing Res. 33(1990) 418–432
4. Whitehead, M., Kamal, N., Lonsbury-Martin, B. and Martin, G.: Spontaneous otoa-coustic emissions in different racial groups. Scand. Audiol.22(1993) 3–10
5. Zhang, T. and Penner, M.: A new method for the automated detection of sponta-neous otoacoustic emissions embedded in noisy data. Hear. Res.117(1998) 107–112 6. Pasanen, E. and McFadden, D.: An automated procedure for identifying
sponta-neous otoacoustic emissions. J. Acoust. Soc. Am. 108(2000) 1105–1116
7. Talamadge, C., Long, G., Murphy, W. and Tubis, A.: New off-line method for de-tecting spontaneous otoacoustic emissions in human subjects. Hear. Res.71(1993) 170–182
8. Burns, E., Arehart, K. and Campbell, S.: Prevalence of spontaneous otoacoustic emissions in neonates. J. Acoust. Soc. Am.91(1992) 1571–1575
9. Penner, M., Glotzbach, L. and Huang, T.: Spontaneous otoacoustic emissions: mea-surement and data. Hear. Res.68(1993) 229–237
10. Kapadia, S. and Lutman, M.: Are normal hearing thresholds a sufficient condition for click-evoked otoacoustic emissions? J. Acoust. Soc. Am.101(1997) 3566–3576 11. Davis, A.: Hearing in Adults. Whurr Publishers Ltd. London, ISBN 1-897635-40-0
(1995)
12. Lutman, M., Davis, A., Fortnum, H. and Wood, S.: Field Screening of Targeted Neonatal Hearing Screening by Transient-Evoked Otoacoustic Emissions. Ear. Hear.
18 No. 4(1997) 265–276
13. Frigo, M. and Johnson, S.: The Fastest Fourier Transform in the West. http://fftw.org (2003)
14. Withnell, R., Kirk, D. and Yates, G.: Otoacoustic emissions measured with a phys-ically open recording system. J. Acoust. Soc. Am.104(1998) 350–355
15. Meritt, S. and Kapadia, S.: Otoacoustic emissions in the unoccluded human ear canal. Int. J. Audiol.42(2003) 373