http://eprints.whiterose.ac.uk/113005/
Version: Accepted Version
Article:
Bux, J, Paul, N, Peakall, J et al. (3 more authors) (2017) In situ characterization of mixing
and sedimentation dynamics in an impinging jet ballast tank via acoustic backscatter.
AIChE Journal, 63 (7). pp. 2618-2629. ISSN 0001-1541
https://doi.org/10.1002/aic.15683
(c) 2017, American Institute of Chemical Engineers (AIChE). This is the peer reviewed
version of the following article: "Bux, J, Paul, N, Peakall, J et al (2017) In situ
characterization of mixing and sedimentation dynamics in an impinging jet ballast tank via
acoustic backscatter. AIChE Journal," published in final form at
[https://doi.org/10.1002/aic.15683]. This article may be used for non-commercial purposes
in accordance with Wiley Terms and Conditions for Self-Archiving.
[email protected] https://eprints.whiterose.ac.uk/
Reuse
Unless indicated otherwise, fulltext items are protected by copyright with all rights reserved. The copyright exception in section 29 of the Copyright, Designs and Patents Act 1988 allows the making of a single copy solely for the purpose of non-commercial research or private study within the limits of fair dealing. The publisher or other rights-holder may allow further reproduction and re-use of this version - refer to the White Rose Research Online record for this item. Where records identify the publisher as the copyright holder, users can verify any specific terms of use on the publisher’s website.
Takedown
If you consider content in White Rose Research Online to be in breach of UK law, please notify us by
! "
School of Chemical & Process Engineering
**School of Earth and Environment
University of Leeds, Leeds, West Yorkshire, LS2 9JT, UK
#! $
National Nuclear Laboratory, Central Laboratory, Sellafield, Cumbria CA20 1PG, UK
%
School of Chemical Engineering,
The University of Queensland, Brisbane, Queensland QLD 4072, Australia
* Corresponding author email: [email protected]
&
Impinging jets are utilized in numerous applications, including nuclear waste
treatment, for both the erosion of sediment beds and maintaining particulates in
suspension. Pulse9echo ultrasonic methods offer great potential for the
monitoring of critical mixing and settling dynamics, in concentrated dispersions. A
non9active scaled version of a Highly Active Storage Tank at Sellafield, UK, was
profiled with an acoustic backscatter system under various jet firing conditions. An
advanced analysis technique enabled the direct quantification of dispersion
concentration changes from the converted backscatter attenuation. Hence, the
erosion and mixing capability of the jets, and settling kinetics were characterized. It
was found that jet operation alone provided inadequate localized mixing of eroded
sediment. An additional air9lift process operation was required to hinder the rapid re9
settling of dispersed particulates.
'
( )
*
Understanding mixing and segregation dynamics in multiphase dispersions,
suspensions and slurries is of ubiquitous importance within many chemical
engineering processes, ranging from pharmaceutical, personal care, cosmetics,
pigments and food manufacture,1 to large scale multiphase separation processes in
fuels, minerals processing and water treatment.2 A particularly challenging example
is the use of multiphase mixing systems for nuclear waste treatment and transfer
across the US, UK and Europe, where jet ballasts are utilized to homogenize settled
materials such as radioactive suspensions, due to their increased reliability in
comparison to mechanical mixers.3,4 The process involves eroding and mobilizing
sludge waste layers via jet impingement, where consequential liquid turbulence
disperses particles into suspension.4,5
It is critical from operational and optimization perspectives, to have an understanding
of dispersion dynamics in such jet systems; specifically on particle erosion,6
mobilization and mixing, as well as settling kinetics, particulate segregation and
concentration changes once jets are stopped.7 Yet, such dynamic information is not
easily acquired at full scale or via characterization techniques, and is often
estimated from lab scale mixing or settling tests, where results may be correlated to
real systems by labor intensive sampling of particle concentrations or radioactivity
over time. Indeed, many jet9erosion systems rely on theoretical models to overcome
experimental difficulties with the prediction of process behavior.8 Nevertheless,
numerical simulations of erosion via impinging jets are still at an early stage 9 and
thus it is imperative that experimental techniques are developed to allow current
A range of devices are available for suspension monitoring that may be
applied to such fast jet mixing systems: For example, light transmission or
backscattering devices,11913 x9ray14 and gamma ray transmission,15 laser induced
fluorescence,7,10,16 CCD video analysis,17 and tomographic methods measuring
electrical resistance.18 However, many of these techniques also contain limitations
that have reduced their more wide scale industrial use including, low particle
concentration thresholds, high intrusiveness, high cost or implementation
complexity.19 Ultrasonic diagnostics however, can surmount many of these issues to
a practicable extent,2 and offer improved flexibility and fast sampling rates for the
monitoring of particle size, concentration and velocity in dynamic dispersions.20926
Specifically, acoustic backscatter systems (ABS), have been demonstrated for the
characterization of suspended sediment concentration (SSC) and particle sizing in
dilute estuarine flows of coarse sediments,27,28 fine sediments,29 colloidal
dispersions,30,31 concentrated suspensions and for the tracking of settling
interfaces.26,31936
Thorne and Hanes28 developed a model for SSC characterization of dilute sandy
sediments which applies only to particle sizes greater than 40 Dm, concentrations
below approximately 2.5 g/l,32 and requires independent knowledge of particle
specific scattering and attenuation constants which are determined from the
corresponding form functions and total normalized scattering cross sections; these
are only readily available in literature for large glass beads and sandy particles.37939
Hunter 32 and Bux .,31 outlined a phenomenological approach, whereby in
cases where there is a linear decay in the backscattered signal on the decibel scale,
the attenuation gradient can be correlated directly with concentration. This approach
comprising arbitrary particle types, because predetermined knowledge of particle
properties isn’t a prerequisite, and in higher concentration regimes than the Thorne
and Hanes model,28 due to the corresponding linearity of the signal decay. Rice
presented an advanced analysis method, which enables the calculation of the
attenuation constants of arbitrary particles directly from backscatter measurement,
negating the need for laborious defining of the total normalized scattering cross9
section.
The Rice method22 rearranges the Thorne and Hanes28 expression for backscattered
voltage in terms of the [G=ln(ψVr)], where V is the backscattered
voltage, is the transducer distance range and ψ is a near9field correction factor that
can theoretically account for response variation at short distances.40 It was shown by
Rice 22 that for a well9mixed dispersion, varies linearly with distance , and
that more importantly, the gradient of the , ∂G/∂r varies linearly with
particle concentration. The 22 enables quantification of sediment
concentration in many particle systems across a wide range, using the gradient
equation; ξ = - ∂G/∂r], where ξ is the sediment attenuation constant, to generate
particle specific correlations. A derivation of the is available in the
Supplementary Material section, S1. Importantly, in the model, gradient
linearity holds for a larger concentration range than the phenomenological correlation
method,31,32 where the influence of inter9particle scattering becomes so enhanced, at
a limiting concentration, that the signal decay is no longer linear on a decibel scale.
In this report, we investigate the application of an acoustic backscatter system (ABS)
utilizing a combined analysis approach for the first time, which incorporates the
22
alongside the phenomenological approach,31,32 to characterize
Specifically, a tank system from the UK nuclear industry is investigated, where the
characterization of legacy waste sludges pending retrieval from aged tanks and silos
is very challenging.41 Highly Active Storage Tanks (HASTs) are utilized by Sellafield
Ltd UK, for the interim storage of the penultimate liquid waste stream arising from
spent nuclear fuel reprocessing. They comprise impinging jet ballasts to erode and
re9suspend fission products that have precipitated out of solution and settled onto
the tank base.41,42 HASTs also incorporate heat exchange cooling coils to remove
residual radioactive decay heat. These occupy a significant tank volume, thus
undesirable particulate sedimentation onto this pipework is also known to occur41.
Furthermore, air9lifts are also incorporated in the design. These generate additional
turbulence in order to improve mixing of dispersed sediment. It is critically important
to understand the level of mixing achieved both with and without air9lift operation.
Monitoring suspension conditions is a significant challenge within the HASTs owing
to the inherent radioactivity and their congested internal structure. Hence, the
availability of practical characterization instrumentation is imperative. Direct
deployment of an ABS in the HASTs was not practical for this preliminary
investigation, owing to the high radioactivity. Instead, non9active test experiments
were conducted in a four tenths scale rig with the aim of correlating suspension
behavior within HASTs using current models.42 Specifically; the clearance achieved
via erosion, levels of sediment mixing and dispersion, sediment re9settling and the
influences of neighboring jets, were investigated by employing various jet and air9lift
operating regimes. An inorganic mineral comprising settling properties corresponding
with a 40% scaling of active sludge solids, was utilized to model particulate behavior
in these non9active trials. The sediment was calibrated in the laboratory to extract the
utilized as a reference to quantify concentration from measured backscatter in the
FTR trials. Sedimentation tests were also conducted in the laboratory to gauge
expected settling behavior, prior to non9active trials.
+
The selection of materials that can be utilized in large scale experiments is typically
limited due to practicality, toxicity and cost. Barium sulfate or barytes (supplied from
RBH Ltd UK), was selected as the non9radioactive test material in the corresponding
experiments, because it enables investigation of settling properties in a scaled
scenario. Barytes is highly dense, akin to cesium phosphomolybdate (CPM) and
zirconium molybdate (ZM), the primary constituents of HAST waste liquors.41
Material density was measured via a Micrometrics Accu9Pyc 1330 helium
pycnometer (Micrometrics Instrument Corporation, USA). Three individual powder
samples were measured three times each, yielding a density value of 4418 kgm¯³,
which is close to the reference value of 4490 kgm¯³.43 The measured density is
higher than that of CPM (3820 kgm¯³) and ZM (3410 kgm¯³)41, enabling experimental
investigation of a worse case settling scenario for modeling purposes.
Particle size distribution was measured via a Malvern Mastersizer 2000 laser
diffractometer (Malvern Instruments, UK), where three samples were dispersed in
water, recirculated at 1400 rpm and measured ten times each (Figure 1). The
distribution is bimodal with a primary peak at 10 Dm and a minor volume fraction of
fines at 1 Dm. The resulting D10 D50 and D90 percentile diameters are 1.7, 7.8 and
LEO/Zeiss 1530 FEGSEM scanning electron microscope (LEO Elektronike GmbH,
Germany) (Figure 2). These images both corroborate the laser diffractometer
measured particle size, as well as revealing the shape characteristics, which in this
case are non9uniform crystalline structures with uneven fractured flat faces. Size and
shape both require consideration because not only do they influence settling
behavior, but they also govern the backscatter response of the acoustic wave;
whereby small particle radii, non9spheroidal shape and orientation in dispersion can
enhance backscatter attenuation.44 Although barytes is larger than colloidal CPM
and ZM, it is at least an order of magnitude smaller than large sandy sediments that
are characterized in typical marine ABS applications.27 The stability of barytes in
aqueous dispersions was also characterized via ζ potential measurement, using the
Zetasizer Nano9ZS (Malvern Instruments, UK). A minimum of three samples were
measured, with each sample comprising a maximum of 100 measurement runs.
A 0.3 x 0.8 m Perspex column with inset baffles was utilized for the calibration of the
barytes sediment (Figure 3). The column was fitted with an off9centered mixing
impeller that was positioned 0.1 m from the base and mixing at a rate of 1640 rpm.
Three transducers; 1 x 1 MHz and 2 x 2 MHz, were utilized with an AQUAscat 1000
acoustic backscatter system (Aquatec Group Ltd, UK), positioned at 0.55 m from the
base to ensure sufficient submersion below the waterline at 0.60 m. Barytes
sediment was dispersed in tap water to correspond with the solids settling properties.
Suspension concentration was increased incrementally from 0.06 to 1.42 vol% with a
10 minute homogenization period between sediment addition and acoustic
measurement. The transducers profiled the suspensions for a duration of 5 minutes,
mm distance bins. Three runs were conducted per concentration, and an averaged
backscatter intensity profile was ascertained per concentration. Three 50 ml samples
were extracted, using a peristaltic pump, from four equidistant depths at the highest
concentration for a homogeneity check. Depth9wise suspension homogeneity was
confirmed with standard deviation ranging ± 0.001– 0.044 vol%, as seen in Figure 4.
The settling tests were conducted via an analogous method, albeit with minor
alterations; the waterline was set at 0.4 m and mixing impeller speed at 1200 rpm.
The settling of a suspension with bulk concentration of 0.7 vol% ( 3 wt%) was
investigated to match the nominal concentration in the industrial experiments. The
transducers were positioned at 0.25 m to enable profiling within the sediment bed
region. The dispersion was mixed for 10 minutes post sediment addition to ensure
homogeneity, after which the mixer was turned off and the settling dispersions were
profiled for a duration of 10 minutes. Three experimental runs were conducted per
concentration, between which 10 minute mixing intervals were allowed for re9
dispersion and homogenization of sediment.
The Four Tenths Rig (FTR) at the National Nuclear Laboratory (Workington, UK) was
utilized for non9active industrial experimental trials. The FTR, which is pictured in the
Supplementary Material S2, is a 40% scaled version of a Highly Active Storage Tank
(HAST), of the type at Sellafield Ltd (Cumbria, UK).42 The HAST is a storage vat
which routinely mobilizes radioactive liquor waste, to prevent settled particles
forming radioactive hotspots. The FTR design comprises three primary features;
impinging jet ballasts to resuspend and mobilize settled particles, ‘dummy’ cooling
coils to remove radioactive decay heat and air9lifts to generate turbulence and
diameter, which is supported on a platform. At 100% fill, the FTR contains 12.10 m3
of water generating a waterline height of 2.28 m from the base, or 1.44 m at 50% fill.
Experiments were conducted at both fill levels. The jet arrangement consists of six
equidistant peripheral jets and a central jet with a vertically positioned nozzle. The
central jet nozzle is positioned 0.38 m above the base, and the peripheral jet nozzles
are angled towards the wall and positioned 0.23 m above the base. These features
are visualized in schematics in Figure 5; (A) plan view, (B) CAD schematic of internal
structure, and (C) side view of experimental configuration.
Jet ballasts withdraw fluid from the FTR and fire it out at a known velocity, creating
an impingement which erodes the sediment bed to resuspend settled particles. At 40
Hz pump operating frequency, the jet nozzle diameters of 0.015 m, limit the
maximum flowrate of the central jet to 230 l/min, and 196 l/min for the peripheral jets.
During operation, each jet’s velocity profile increases, reaches a plateau and then
eventually decreases. A typical jet velocity profile with respect to time is provided in
the Supplementary Material, S3, for reference. There are also four air9lift pipes which
comprise perforated dispersion nozzles. The upper and lower positions of the
nozzles are 0.21 m and 0.07 m respectively, from the base. They inject air into the
suspension at a rate of 4 l/s and 1 barg pressure, to promote mobilization and
homogenization of suspended particles.
The AQUAscat 1000 ABS (Aquatec Group Ltd, UK) was deployed here initially with 1
x 1 MHz and 1 x 2 MHz transducers. The 1 MHz transducer was positioned
approximately 0.8 m from the base to monitor large depth scale suspension
changes, due to its enhanced depth penetration compared with the higher
frequencies. The 2 MHz transducer which is relatively more sensitive, was positioned
region. Consequently, the probes were not co9located. The 1 MHz was positioned
closer to jet 2, and 2 MHz closer to jet 3 (Figure 5). The region between jets 2 and 3
was the only access point free from internal coils to enable ABS measurement. The
highest transducer pulse repetition rate (64 Hz) was selected and one full depth
profile was collected every second, to reduce the influences of noise. The depth
profiles were segregated into 5 mm measurement bins to enable maximum depth
penetration without compromising depth9wise resolution.
A range of HAST operation cycles were replicated in the FTR, in order to better
understand sediment erosion and mobilization dynamics from an operational
perspective. These are detailed in Table 1. Specifically, in Regime 1 (R1), only jet 1
and the central jet were operated. This regime was selected to investigate sediment
mobilization influences of neighboring jets, and is analogous to experimental regimes
selected by Hunter 3 in a small scale 1 m3 tank without internal cooling coils.
Regime 2 (R2), where each of the jets are operated in sequence, is more similar to a
typical daily HAST mobilization operation. In Regime 3 (R3), all air9lifts are operated
simultaneously with the jet cycle, to generate turbulence and thus promote mixing
and homogenization of particles resuspended by the jets. The air9lift operation
ceases upon completion of the jet firing cycle. This sequence resembles a typical
operation that is conducted prior to HAST decantation, where liquor suspensions are
pumped out for vitrification. ABS measurements commenced upon firing of the final
jet in each regime and ceased by 30 minutes post firing. 60 minute inoperative
periods between experiments were used to enable sediment to resettle close to
background levels. ABS readings were taken 60 minutes post operation, in order to
establish background concentration levels. Note, variations in firing time cycles is a
of operational variables. These variables are not necessarily adjustable to the same
extent in an actual HAST.
Regime 3 experiments were conducted with an additional 2 MHz probe co9located
with the 1 MHz to profile changes in the corresponding upper9region. As part of the
Regime 3 experiments, tank validation of the ABS concentration measurements was
undertaken using independent sampling. Sampling was initiated post firing of jet 2 in
the second cycle, i.e. 30 s prior to cycle completion. 2 x 20 ml samples were
extracted with a peristaltic pump at selected times, at 0.15 m from the base. For
each jet in Regime 3 experiments, and for the central jet in Regime 2 experiments,
bed clearance profiles were measured, through the underside of the transparent rig.
The equilibrium clearance area was then calculated for each jet.
, $
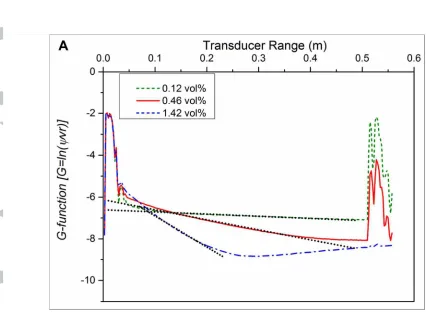
Averaged backscatter profiles of homogenous dispersions in the laboratory
calibration tests, ranging 0.06–1.42 vol%, are presented in Figure 6 in terms of the
[G=ln( Vr)], with respect to transducer range Note, for figure clarity, only
data from three concentrations are shown, which broadly cover the range measured.
The intense peak in backscatter intensity at 0.5 m denotes the tank base position
relative to the transducers. The backscatter intensity is strongest at the
closest range and progressively attenuates due to natural absorption losses. This
extinction in echo intensity, is enhanced for the 2 MHz frequency due to the shorter
pulse wavelength.45 Attenuation is also further pronounced with increasing
scattering events which deviate the echoes from their path to the transducer.31,32 The
data between transducer range 0.1 m and 0.4 m, or up until the signal threshold
denoted by the minimum at 1.42 vol% for example, were utilized in subsequent data
analysis.
The profiles exhibit a linear extinction with respect to r, in this range,
which enables direct quantification of attenuation with respect to concentration,
where the attenuation constant is, ξ = 9 ∂G/∂r, as per the 22
Accordingly, the averaged linear gradient of the profiles were measured in
the far9field (dashed lines in Figure 6.) for each transducer and system, and these
values (representing ∂G/∂r) are plotted against particle concentration in Figure 7.
Importantly, Figure 7 confirms a linear relationship between ∂G/∂r and M, for
concentrations > 0.1 vol%, and therefore it was utilized as a reference relationship
for the direct inference of barytes concentration from the measured
backscatter, in the subsequent four tenths scale jet testing.
The values of the attenuation constants ‘ξ are; 0.1254, 0.1910 and 0.1867 kg91m2 for
1 MHz, 2 MHz (probe 1) and 2 MHz (probe 2) respectively. These values indicate
that barytes sediment attenuates the backscattered pulse far more than larger glass
bead and jagged plastic particles that have been previously investigated.22 This is
primarily due to their correspondingly smaller size range, where viscous absorption
of the acoustic pulse is high.44 The consistency between the two 2 MHz calibrations
is in agreement with theory since ∂G/∂r should not show significant deviation
Figure 8A presents the average backscatter profiles obtained at selected time
intervals (in minutes), in the laboratory settling investigation of a 0.7 vol% barytes
dispersion. For data analysis, it was found that further averaging of adjacent one
second time profiles was required to reduce the influence of random fluctuations in
data, due to inherent signal noise generated in this dynamic settling system. Five
second time averaging was found to be optimal and thus selected for analysis.
Averaging over smaller durations proved noisy, whereas averaging over greater
durations proved too long a time frame, with respect to the sedimentation dynamics
of the system. The five second averages adopted here were also found to be optimal
time frames using the same instrument in dynamic settling sludge suspensions.31,34
Hence, the profiles in Figure 8A, represent five second averaged results measured
via the 2 MHz transducers, akin to previous investigations of similar settling
systems.31 Initially, T(0) (time in minutes), depicts an intense narrow peak at 28.25
cm, which denotes the column base position relative to the transducer. In
subsequent time profiles, the peak recedes in intensity and shifts towards the
transducer. This shift is indicative of a bed interface, where sediment is deposited at
the base. The final bed depth at T (10) is 0.75 cm.
An additional broader peak is observed close to the transducer, positioned at 7.5 cm
in profile T(2), as denoted by the arrow. The peak successively shifts towards the
column base, as seen in profiles T(3) and T(3.5) (arrows). These features are
indicative of a settling dispersion, where the moving broad peaks corresponds with
the demarcation of a diffuse clarified supernatant – settling suspension
boundary.31,33,34 The positions of the settling front and sediment bed were measured
over successive time profiles and plotted in Figure 8B. Note, data were not included
of the very diffuse settling front – bed boundary, at this point in time. The resulting
sedimentation curve indicates the occurrence of hindered settling behavior in the 0.7
vol% dispersion, the settling rate of which is 1.35 mm/s at suspension temperature
24.5 C. The average ζ potential corresponding with the dispersion at pH 7 ranges
0.4 – 3.2 mV. Low magnitude ζ potential data indicate weak electrostatic repulsion
forces between particles, which are insufficient to prevent aggregation.46 Indeed, the
measured settling rate is considerably faster than the Stokes free settling velocity of
0.51 mm/s for 7.8 Dm particle size. These results suggest that the particles may be
aggregating in suspension. Indeed, fine cohesive minerals are known to aggregate in
suspension and exhibit complex settling behavior.46 A transition from the individual
deposition of barytes aggregates to hindered settling behavior, has previously been
reported to be in the region of 1 vol% concentration.47
Suspension concentration within the settling regions (between the broad settling
peak and bed peak for selected time profiles in Figure 8A) were characterized via the
reference relationship determined from the calibration experiment discussed in the
previous section. Backscatter profiles in Figure 8A, were subsequently averaged
over 5 successive time profiles (5 s), and plotted in terms of the versus
transducer range, akin to the calibration methodology. The gradients (∂G/∂r), were
calculated in successive 5 distance bin segments, over the corresponding profile
range, for each examined profile. The value of ∂G/∂r for each segment was then
quantified in terms of concentration via the calibration reference given in Figure 7.
The corresponding depth9wise concentration profiles are presented in Figure 9 A to
D, over four time profiles in minutes. The dispersions are fairly homogeneous
initially, around the expected bulk concentration zone, demonstrating good
set9up within the tank. Profiles A and B do however show significant variations
suggesting an error of +/9 0.1 vol%, or around ~+/910% relative. Considering the fast
settling kinetics that are occurring in these systems, which limits the data capture
time, such variation is considered acceptable for the required jet tank studies, and is
consistent with previous ABS studies of settling suspensions.31,34 Figure 9 C and D,
also show that a concentration gradient from the settling interface to the near9bed
progressively develops with time. Generally, particles of different sizes settle at
different rates in polydisperse suspensions, 47 and given that barytes is bi9disperse in
this case, size segregation during settling is the likely cause for the profiled
concentration changes observed. It is evident that detailed information is obtained on
the settling kinetics of the bidisperse suspension via the ABS, with the instrument
giving the ability to not only monitor interfacial changes but particle segregation
through concentration in the same measurement.
Bed clearance dimensions were measured from the underside of the transparent
tank post Regime 3 jet9only operation, in order to gauge the erosion capability of the
jets. Clearance was also measured for the central jet post Regime 2, where the
corresponding jet was fired in sequence rather than continuously throughout the
cycle, to gauge jet duration influences. Visual inspection of the tank underside,
revealed that the clearance pattern of the peripheral jets were not as uniform as the
expected empirical clearance model generated by McArthur ,42 as shown in
Figure 10A. This is because the peripheral jet nozzles are angled at the tank wall,
creating effectively a double impingement. Figure 10C, illustrates how the liquid jet
initially impinges on the vertical wall (solid blue lines), spreads along the wall to the
[image:17.612.60.523.42.709.2]more of the jet energy is directed along the tank wall, rather than out into the bed,
which tended to create a semi9ellipsoidal erosion profile in an outward direction from
the wall 9 base boundary (dashed blue line). In actuality, the peripheral jets
generated a non9uniform clearance area, due likely to inhomogeneous bed yield9
strength, the approximate shape of which is depicted in Figure 10B.
The procedure for quantifying peripheral clearance areas is outlined henceforth. The
measured major and minor axis dimensions are given in Table 2. In almost all cases,
the minor axis is not directly half the value of the major axis, verifying the ellipsoidal
nature of the erosion process. Therefore, the area generated by each measured axis
was calculated, and the difference between the two values was subtracted from the
largest calculated area, thus providing the clearance area estimated for each jet, as
shown in Table 2. Note, areas were calculated assuming a simple semi9circular
shape for ease of calculation. The data in Table 2 indicate that the clearance area of
the peripheral jets 1–6, are comparable, ranging from 0.33 – 0.39 m2.
The central jet nozzle is positioned directly above the tank base, thus generates a
circular profile hence the corresponding area was calculated as such. The clearance
resulting from the longer jet firing duration in Regime 3 (0.79 m2), was markedly
improved with respect to the shorter duration in Regime 2 (0.28 m2), suggesting that
equilibrium erosion was not achieved in the latter scenario, an important result as the
latter is indicative of operational procedure. Although increasing jet fire would
improve the level of erosion (at least until maximum clearance is achieved according
to the jet dimensions and flow velocity10 as attained in Regime 3) in the real HAST
systems, fire time is limited by liquid volume in the jets. Given these limitations, the
erosion data suggest that there will inevitably be regions where the bed remains
agreement with the clearance model of McArthur 42, albeit the shape of the
erosion patterns is different. One other potential reason for the low level of erosion is
the influence of broad grain size distributions in the barytes, where the preferential
transport of smaller particles may lead to larger particles armoring the bed, thus
reducing erosion from jet scouring.6,9
! " #
$
The five second time averaged [G=ln(ψVr)] backscatter profiles of
regimes 1 and 2 are presented in Figure 11A, for the 1 MHz data, and Figure 11B,
for the 2 MHz data. Since the probes were offset in the rig, the listed distances for
the 2 MHz in Fig. 11B are converted to be shown in respects of the 1 MHz probe, for
consistency with the 1 MHz data. The position of the sharp peaks located at 0.75 m
shifts by a few centimeters with respective regimes, suggesting that they denote the
position of an eroding sediment bed, rather than the tank base itself. The R1 profile
corresponds with measurement directly following the simultaneous prolonged
operation (40 minutes) of jet 1 and the central jet. R2 profiles denote measurement
at three time intervals in the final cycle of sequential jet operation in short bursts (20
seconds). Specifically, R2.1, R2.2 and R2.3 profiles correspond with measurements
directly following the cessation of jet 2, jet 3 and jet 4 respectively (refer back to
Table 1). The position of the transducers in relation to the jets is referenced in Figure
5.
The R1 profile in Figure 11A exhibits an intermediate intensity, which is assumed to
be a consequence of mobilization of some sediment from the neighboring jet 1 and
central jet regions, into the 1 MHz measurement zone. This is not the case for the 2
away from jet 1. The backscatter attenuation versus range is minor in both cases,
indicating only dilute dispersion concentrations.48 This result suggests that despite
the long firing cycle, dispersion of sediment beyond localized regions is significantly
hindered by the obstruction of the cooling coils, especially around the central jet.
Therefore, even though the central jet has potentially a higher erosion capacity than
the peripherals (because of its single vertical impingement zone) mixing throughout
the greater tank area is almost completely obstructed. The physical obstruction of
the cooling coils is pictured in Figure 5B, a CAD schematic of the internal
configuration, where it can be seen that the coils occupy a significant volume of the
tank.
Profiles R2.1, R2.2 and R2.3 however, exhibit significantly enhanced backscatter
attenuation in comparison to the R1 profile, which is assumed to be a consequence
of sediment re9suspension via the jets operating in the ABS measurement zones.
Initially in Figure 11A, the R2.1 profile has a clear increase in the
gradient, in comparison to the R1 data, inferring a concentration increase.
Subsequently, the attenuation gradient and thus suspension concentration, is again
increased in R2.2, which also depicts a broad peak at 0.25 m (highlighted in the
figure by an arrow). By profile R2.3, the broad peak has shifted closer to the bed
(arrow at 0.4 m). It is assumed these peaks denote the position of a diffuse
scattering plane generated by the density contrast of a dilute and relatively
concentrated suspension,31,33,34 akin to the laboratory settling tests. Essentially, the
peak in R2.2 corresponds with the maximum sediment dispersion height achieved by
jet operation alone, and the movement of the peak in R2.3 suggests rapid settling of
the re9suspended sediment occurs shortly after jet operation, within that specific
The settling rate of the interface, calculated from the difference between the two
peaks with respect to the measurement time interval was 0.8 mm/s. This rate is
higher than the Stokes settling velocity (0.51 mm/s), but lower than the rate of 1.35
mm/s in the batch scale settling studies at 0.7 vol%, reported earlier. Such a
reduction may be indicative that the localized tank regions measured have a slightly
higher concentration, which would reduce settling rates though enhanced hindered
settling effects. It is also possible that the particles are not aggregating to the same
extent as in the small scale batch settling studies. These results may be expected
from greater levels of particle segregation given the likely inhomogeneity of the tank
mixing. Indeed, since the dispersion zone9supernatant interface is detected by the
ABS at only ~0.7 m, which is much lower than the total fluid depth, it is clear that the
jets are not suspending the particles completely through the tank volume. The rapid
settling behavior, also highlights the importance of maintaining and optimizing jet
operations in actual radioactive HASTs, which normally operate jets in 30 minute
intervals.42
The attenuation changes in each regime, were quantified in terms of concentration,
via the reference relationship established in the barytes calibration in Figure 7.
Specifically the backscatter profiles were smoothed over five consecutive
time and distance bins, to reduce influences from inherent noise fluctuations in the
measured signal. The corresponding ∂G/∂r slopes, were subsequently calculated
between transducer ranges 0.3 – 0.5 m, denoted as the upper9region (UR) for the 1
MHz data, and 0.55 – 0.68 m, denoted as the near9bed (NB) for both 1 MHz and 2
MHz data. A wider range was not selected for the near9bed calculations due to
enhanced signal fluctuations closer to the bed. The corresponding concentrations
As expected from the profile observations discussed, dispersion concentration of R1
is minimal compared with R2 profiles, the former of which corresponds with sediment
erosion in neighboring jet regions to the ABS measurement zones. Particle levels
clearly increase from R2.1 to R2.2, and then appear to level off or reduce, depending
on the relative location between the probe and the firing jet in R2.3. In particular the
R2 profiles align with the rapid settling scenario discussed, whereby concentration in
the upper9region successively recedes with increasing concentration in the near9bed
There is also an apparent discrepancy between estimated concentration in the near9
bed between the 1 and 2 MHz transducers, in R2.2 and R2.3. It is assumed that
these differences are due to the fact that the probes were not laterally co9located. As
the 1 MHz probe was closer to jet 3, it measured enhanced particle levels at R2.2
which carried forward to R2.3. Once again, these results highlight the lack of overall
mixing in the tank from jet operation alone, and considerable inhomogeneities in
particle dispersion levels, where it appears the liquid jets are only able to mobilize
suspensions within the vicinity of the jet itself, suggesting that the cooling coils act to
dampen any larger scale turbulent mixing.
# ! .
The impact of air9lift operation with respect to suspension mixing was investigated
and directly compared with the mixing achieved without their utilization.
backscatter profiles were obtained for Regime 3 (jet cycle described in Table 1), both
with and without air9lift operation. The level of dispersion in each scenario, as a
function of time, is compared in the corresponding attenuation profiles presented in
Figure 13 (A) without, and (B) with air9lifts. Levels of attenuation exhibited in the
[image:22.612.60.522.45.734.2]MHz transducer are compared. The 1 MHz probe exhibits lower values of
attenuation than the 2 MHz, due to the longer wavelength.45 Note, some fluctuations
are observed in the initial data points of each profile, since the cessation of
suspension turbulence following air9lift operation is gradual.
In Figure 13A, without air9lift operation, the 2 MHz attenuation values are
systematically lower in the upper9region than the near9bed, inferring depth9wise
concentration stratification. The values for both regions in the air9lift scenario in
Figure 13B, are analogous however, indicating improved mixing and dispersion
homogenization. The comparative magnitude of the attenuation values is also
systematically lower in the air9lift case. It is probable that improved mixing would
better disperse the particles throughout the whole of the tank volume, reducing the
relative concentration in the zone measured by the probes. All profiles, both with and
without air9lift operation, depict a general reduction in attenuation over time. This is
indicative of bulk concentration recession as the sediment settles. Importantly, the
gradient, which represents reduction over time, is comparatively shallow in the air9lift
scenario, which suggests that particle re9settling is more gradual in the air9lift
experiments. Indeed, visual observations of the tank confirmed a consistently turbid
dispersion which gradually clarified with time, which is unlike the rapid bulk settling
behavior witnessed during jet operation alone. Thus, air9lift operation results in more
favorable mixing conditions and resettling durations.
Samples were withdrawn from the FTR at 0.15 m (near9bed zone) in order to
compare the characterized concentrations at different times using the
, with physical measurements. Figure 14 compares the
sampled and characterized values obtained in both over time. Specifically, ABS
samples were withdrawn at a specific 0.15 m location from the base (refer to Figure
5). The concentrations characterized via the ABS data, align well the physical
sample concentrations, further validating the approach used.22 The slight
discrepancy in data at longer time periods for the case without air9lift operation is
assumed to come from the spatial differences between the techniques. As the
sample was taken from a single position at 15 cm, the zonal suspension front may
have dropped below this point at longer periods leading to a significant drop off in
measured concentration. Because acoustic data represent an average distance (10–
20 cm) from the tank base, this drop9off would be less evident. Figure 14 shows a
drop in concentration with time which is more gradual in the air9lift scenario, as seen
in Figure 13. Indeed, the bulk concentrations are markedly lower in the case of air9lift
operation, confirming that the air9lifts are able to mix and homogenize the
dispersions to a much greater extent than jet operation alone. The data also suggest
that they do not actually increase the amount of sediment eroded, but only aid in
secondary mixing (or else the bulk concentration would have increased). Overall, the
results demonstrate that air9lift operation is key to achieving optimized dispersion
and mixing of eroded sediment to prevent rapid re9settling.
-A four tenths scale non9active impinging jet tank (FTR), the design of which is based
on an operational Highly Active Storage Tank (HAST), was profiled via an acoustic
backscatter system (ABS). Sediment erosion, mixing, mobilization and re9settling
dynamics, were investigated with respect to jet ballast and air9lift operating regimes,
to facilitate operational optimization within actual HAST systems. The acoustic
and a linear relationship was extracted between the backscatter
attenuation obtained via the and concentration. This reference
relationship mediated the characterization of depth9wise concentration changes
within a laboratory scale settling test and within the dynamic FTR dispersion, where
characterized values aligned well with extracted samples. The also
facilitated the quantification of the frequency specific attenuation constants of the
mineral, for the first time here. The quantified attenuation was greater for this
sediment compared with larger glass bead and plastic particles previously
investigated,22 due to the dominating influence of size related viscous absorption of
the backscattered pulse.
The ABS analysis of the FTR found sediment bed erosion via jet impingement
to be inhomogeneous and incomplete in all cases. The obstruction of the cooling
coils dampened the mobilization of eroded sediment during jet only operations,
resulting in localized and stratified dispersion of sediment, and subsequently rapid
re9settling of particles. The additional turbulence generated during air9lift operation,
significantly reduced bulk concentration in the measured regions, due to improved
mixing and non9localized sediment distribution (although did not enhance sediment
erosion). Overall, this research has given important insight into dispersion dynamics
with respect to applied operations, within a very complex jet impingement system,
facilitating the design and optimization of jet mixing processes. The ABS
monitoring technique, which incorporates both the 22 and
phenomenological analysis approaches,31,32 has been able to analyze systems that
would be otherwise almost completely inaccessible, and characterize particle settling
dynamics and concentration changes, in both small scale and large scale
& )
The authors would like to thank Steve Rawlinson from the National Nuclear
Laboratory (NNL) for technical support during industrial experimentation, and George
McArthur and Sellafield Ltd for providing general support on the project. This work
was funded by the Engineering and Physical Sciences Research Council (EPSRC)
UK and the Nuclear Decommissioning Authority (NDA) as part of an Industrial CASE
Award. Dave Goddard from the NNL provided general supervisory support on behalf
of the NDA.
.
-/! Hazlehurst T, Harlen O, Holmes M, Povey M. Multiple scattering in
dispersions, for long wavelength thermoacoustic solutions. Paper presented at: J Phys Conf Ser.2014.
0! Challis RE, Povey MJW, Mather ML, Holmes AK. Ultrasound techniques for characterizing colloidal dispersions. 2005;68(7):154191637.
1! Hunter TN, Peakall J, Unsworth TJ, et al. The influence of system scale on impinging jet sediment erosion: Observed using novel and standard
measurement techniques. 2013;91(4):7229734.
2! Gauglitz PA, Fort JA, Wells BE, Chun J, Bamberger JA, Jenks JJ. !
" # $ % & '
( & ) ! : Pacific Northwest National
Laboratory;2010.
3! Hamm B, West W, Tatterson GB. Sludge suspension in waste storage tanks.
*# ( 1989;35(8):139191394.
4! Merry J. Penetration of vertical jets into fluidized beds. *# (
1975;21(3):5079510.
5! Feng H, Olsen MG, Liu Y, Fox RO, Hill JC. Investigation of turbulent mixing in a confined planar-jet reactor. *# + 2005;51(10):264992664.
6! Betancourt F, Bürger R, Diehl S, Farås S. Modeling and controlling clarifier– thickeners fed by suspensions with time9dependent properties. &
7! Epely9Chauvin G, De Cesare G, Schwindt S. Numerical modelling of plunge pool scour evolution in non9cohesive sediments. * ,
2014;8(4):4779487.
/8! Unger DR, Muzzio FJ. Laser-induced fluorescence technique for the
quantification of mixing in impinging jets. *# ( 1999;45(12):247792486.
//! Finlayson BL. Field calibration of a recording turbidity meter. *! -*
1985;12(2–3):1419147.
/0! Lynch JF, Irish JD, Sherwood CR, Agrawal YC. Determining suspended sediment particle size information from acoustical and optical backscatter measurements. $ 1994;14(10–11):113991165.
/1! Gartner JW, Cheng RT, Wang P9F, Richter K. Laboratory and field evaluations of the LISST9100 instrument for suspended particle size determinations. & 2001;175(1–4):1999219.
/2! Chu CP, Ju SP, Lee DJ, Tiller FM, Mohanty KK, Chang YC. Batch settling of flocculated clay slurry. # 2002;41(5):122791233.
/3! Kaushal DR, Tomita Y. Experimental investigation for near9wall lift of coarser particles in slurry pipeline using γ9ray densitometer. . !
2007;172(3):1779187.
/4! Hernando L, Omari A, Reungoat D. Experimental study of sedimentation of concentrated mono9disperse suspensions: Determination of sedimentation modes. . ! 2014;258:2659271.
/5! Hubner T, Will S, Leipertz A. Sedimentation image analysis (SIA) for the simultaneous determination of particle mass density and particle size.
$ 2001;18(2).
/6! Bolton GT, Bennett M, Wang M, et al. Development of an electrical tomographic system for operation in a remote, acidic and radioactive environment. ( 2007;130(293):1659169.
/7! Shukla A, Prakash A, Rohani S. Particles settling studies using ultrasonic techniques. . ! 2007;177(2):1029111.
08! Shukla A, Prakash A, Rohani S. Particle size distribution measurements in dense suspensions using ultrasonic spectroscopy with an improved model accounting for low angle scattering. *# ( 2010;10.
0/! Shukla A, Prakash A, Rohani S. Online measurement of particle size distribution during crystallization using ultrasonic spectroscopy.
$ May 2010;65(10):307293079.
00! Rice HP, Fairweather M, Hunter TN, Mahmoud B, Biggs S, Peakall J. Measuring particle concentration in multiphase pipe flow using acoustic backscatter: Generalization of the dual9frequency inversion method. ( * $ * 2014;136(1):1569169.
02! Zou X9j, Ma Z9m, Zhao X9h, Hu X9y, Tao W9l. B9scan ultrasound imaging measurement of suspended sediment concentration and its vertical distribution. & $ ! 2014;25(11):115303.
03! Norisuye T. Structures and dynamics of microparticles in suspension studied using ultrasound scattering techniques. # 2016;Accepted.
04! Weser R, Woeckel S, Wessely B, Steinmann U, Babick F, Stintz M. Ultrasonic backscattering method for in9situ characterisation of concentrated dispersions.
. ! 2014;268:1779190.
05! Rose CP, Thorne PD. Measurements of suspended sediment transport parameters in a tidal estuary. $ 2001;21(15):155191575.
06! Thorne PD, Hanes DM. A review of acoustic measurement of small9scale sediment processes. $ 2002;22(4):6039632.
07! Zhang W, Zhu Q, Hu J, Gu J, Yang S. Experimental Study of the
Multifrequency Acoustic Backscatter System using Field Sediment. % " ( 2015;3(6):1889194.
18! Fuller CB, Bonner JS, Islam MS, Ojo T, Page CA, Kirkey WD. Estimating Colloidal Concentration Using Acoustic Backscatter. # $ (
2013;13(11):454694555.
1/! Bux J, Peakall J, Biggs S, Hunter TN. In situ characterisation of a
concentrated colloidal titanium dioxide settling suspension and associated bed development: Application of an acoustic backscatter system. . ! 2015;284:5309540.
10! Hunter TN, Darlison L, Peakall J, Biggs S. Using a multi9frequency acoustic backscatter system as an in situ high concentration dispersion monitor.
$ 2012;80(0):4099418.
11! Carlson JE, Stener J, Sand A, Pålsson BI. Monitoring local solids fraction variations in multiphase flow using pulse9echo ultrasound.
2015;70:3769379.
12! Hunter TN, Peakall J, Biggs S. An acoustic backscatter system for in situ concentration profiling of settling flocculated dispersions. & 2012;27– 28:20927.
13! Stener JF, Carlson JE, Sand A, Pålsson BI. Monitoring mineral slurry flow using pulse9echo ultrasound. , . & # 2016;50:1359146.
14! Kosior D, Ngo E, Dabros T. Determination of Settling Rate of Aggregates using Ultrasound Method during Paraffinic Froth Treatment. ,
2016;doi: 10.1021/acs.energyfuels.6b01714.
15! Betteridge KFE, Thorne PD, Cooke RD. Calibrating multi9frequency acoustic backscatter systems for studying near9bed suspended sediment transport processes. $ Feb 1 2008;28(2):2279235.
17! Moate BD, Thorne PD. Interpreting acoustic backscatter from suspended sediments of different and mixed mineralogical composition. $
2011(0).
28! Downing A, Thorne PD, Vincent CE. Backscattering from a suspension in the near field of a piston transducer. ( * $ * 1995;97(3):161491620.
2/! Paul N, Biggs S, Edmondson M, Hunter TN, Hammond RB. Characterising highly active nuclear waste simulants. 2013;91(4):7429 751.
20! McArthur GAH, Tinsley TP, McKendrick D. Development of a liquid jet sludge re9suspension model (used on pulse jets or jet ballasts). Paper presented at: AIChE Annual Meeting2005; Cincinnati, OH, USA.
21! Haynes WM. / : CRC press; 2014.
22! Moore SA, Le Coz J, Hurther D, Paquier A. Using multi9frequency acoustic attenuation to monitor grain size and concentration of suspended sediment in rivers. ( * $ * 2013;133(4):195991970.
23! Temkin S. $ * * #
$ : Cambridge University Press; 2005.
24! Johnson M, Peakall J, Fairweather M, Biggs S, Harbottle D, Hunter TN. Characterisation of multiple hindered settling regimes in aggregated mineral suspensions. # 2016; 55(37): 998399993.
25! Balastre M, Argillier JF, Allain C, Foissy A. Role of polyelectrolyte dispersant in the settling behaviour of barium sulphate suspension. $ *
2002;211(2–3):1459156.
26! Rice HP, Fairweather M, Peakall J, Hunter TN, Mahmoud B, Biggs SR. Particle concentration measurement and flow regime identification in multiphase pipe flow using a generalised dual9frequency inversion method.
! "
! " !
!
6. Average G function [G=ln(ψVr)] backscatter profiles with respect to transducer range via (A) 1 MHz, and (B) 2 MHz, where the dashed lines represent linear gradient range. The average of the two 2 MHz
[image:36.612.69.496.79.391.2]probes is used in B. Figure 6A
6. Average G function [G=ln(ψVr)] backscatter profiles with respect to transducer range via (A) 1 MHz, and (B) 2 MHz, where the dashed lines represent linear gradient range. The average of the two 2 MHz
probes is used in B. Figure 6B
!" !
# $ % & '
!" !
# $ % & '
#
!" #" $ % " & '" & %
( )
!" # $ # % "
!
!" !
# $ % & ' ! " ( ) *
( '& + ! " " $ , #
!" !
# $ % & ' ! " ( ) *
( '& + ! " " $ , #
%
!
! " # $ % #&$ %
' %
! " # $ % #&$ %
' %
&
! " " #$
% & & #"
! "
# $ %
& ! %
'" () *+ +, - .
! . ! ! . . / 01 0 0 0 0 2!
'" (). . 0 3 0 4.
2 3 0 04. * 3 0 24
0+ 1 ++ +, 21 2 2 0
'" ( *. () . 5. . 0. 2 2+ 1 ++, ' /
! 1 % '" ! !
!
'" ! ! 0
'" ! ! 2
!
'" ! ! *
6 /
' / !