Migration out of Central Java: 1971–2010
Hasnani Rangkuti
Crawford School of Public Policy
College of Asia and the Pacific
Australian National University
A thesis submitted for the degree of Doctor of Philosophy of
the Australian National University
Declaration
This thesis is my own original work and contains no material that has been submitted for a degree at the Australian National University or any other university. It contains no copy or paraphrase of work published by another person, unless explicitly stated.
This thesis used the Indonesian population censuses (1971, 1980, 1990, 2000 and 2010). The data were provided by the Badan Pusat Statistik (BPS-Statistics Indonesia).
All errors in this thesis are my own responsibility.
Hasnani Rangkuti
Acknowledgements
First and foremost, I would like to give my sincere thanks to my chair, Professor Peter McDonald, who offered me so much advice, patiently supervised me, always guided me in the right decision, and provided me with the opportunity to grow as a researcher. I appreciate all his contribution of time, ideas and funding to make my PhD experience more productive, stimulating and joyful. Without his ongoing support I would not have had the opportunity to present my papers at various conferences and to complete my PhD on time. It is not sufficient to express my gratitude with only these few words.
I would like to express my special appreciation and thanks to my supervisor, Dr. Ariane Utomo. Her encouragement made me feel confident to work on my thesis, her joy and enthusiasm to undertake research was contagious and motivated me, in particular, during the hard times of my PhD journey.
I thank Professor James Raymer wholeheartedly for his supervision and advice during the earlier stages of my thesis. I am very grateful for support from Ibu Iwu Dwisetyani Utomo, Bapak Terence Hull, Zhongwei Zhao and all colleagues and friends at the School of Demography and the Crawford School of Public Policy. I also wish to thank Anthony Reid and Ed Aspinal. My PhD journey has been an amazing experience because of your support.
I also appreciate the advice from all colleagues and friends who attended my PhD presentations and provided their critical comments. That really helped me to notice the weaknesses of my dissertation, to shape my research questions and to enable me to see things from different perspectives.
to the ANU to pursue PhD in the first place. I would also like to extend my gratitude to all of my friends and colleagues. To Mba Vida, Irene, Mba Fifi, friends at the Crawford School of Public Policy, seniors at the School of Demography, colleagues at the Pengajian Muslimah and Pengajian Keluarga, friends at the Graduate House and the University House, office mates, Rongfang, Helen Moles and all other colleagues. To the one and only rosy cheeks owner, I thank you.
I thank Megan Poore who has helped me improve my writing skills. For me, Megan is not only a PhD advisor but also a good friend who has always been there to support me, in particular, during my darkest times. For all her efforts and generosity, I am deeply grateful. I thank Karin Hosking for providing assistance with copy editing of my thesis. I also thank the IT staff, the librarians, the administrators and all staff at the Crawford School of Public Policy with whom I intersect.
I would like to sincerely thank each and every one of the Australian taxpayers as I am an Australian Awards Scholarship recipient. Without this scholarship, I would not be able to pursue my PhD in this beautiful, clear-blue-sky country named Australia.
Finally, but by no means least, thanks go to my mother, my late father, my sisters, my brother, my nieces, my nephews and all my relatives. I am very grateful for my mum. Her understanding and love have encouraged me to work hard towards my PhD and to allow me to travel the world independently. My father was my number one fan and he inspired me to study abroad. He once said, ‘Pergilah sekolah jauh, nanti Ayah datang pas wisuda’. Even though, he physically never appeared at any graduation that I had, I believe his spirit has never abandoned me.
Hasnani Rangkuti,
I dedicate this thesis to my family,
Abstract
Migration within Indonesia has a long history, a history associated with the uneven distribution of population across the archipelago that has persisted over centuries. Throughout this history, out-migration has been associated with population policy and, in particular, with one province, Central Java. The main objective of the thesis is to investigate contemporary patterns of population movement within Indonesia and to situate Central Java in the overall migration pattern. Specifically the thesis examines patterns and changes in inter-provincial migration, calculates rates of primary, onward and return migration for Central Java, and investigates employment outcomes and marital assimilation of Central Java’s migrants in selected destinations.
Utilising the five censuses of Indonesia from 1971 to 2010, the thesis found that Central Java was the largest source of out-migration in all the censuses, and was strongly connected with movements into two provinces: Jakarta and Yogyakarta. I argue that the connectedness between Central Java and Jakarta is related to economic opportunities while similarity in culture and proximity are the key connectivities between Central Java and Yogyakarta. Over time, the proportion of primary and onward migration to Jakarta declined substantially. At the same time, the proportion moving to West Java increased significantly. A substantial proportion of Central Java primary migrants was also found in Kepulauan Riau. I argue that the decline in the proportion of primary and onward migration to Jakarta is due to the economic extension of Jakarta to its peripheral regions in West Java and Banten.
for migrants to seek better opportunities in distant places.
From a social perspective, patterns of marital assimilation of Central Javanese husbands and wives are higher when measured by ethno-migration status that is, province of birth than they are by ethnicity. I argue that ethnicity is a better variable for measuring patterns of inter-marriage than ethno-migration status. When they do inter-marry, Central Javanese migrants favour marriage with local people compared with marrying people from other groups. Exogamous marriage is lower in JMR than it is in BBK when measured by either ethno-migration status or ethnicity. While education homogamy is the norm in all ethnic pairing type marriages, I found that hyper-gamy is more likely to be found in exogamous marriages than in endogamous marriages. As the levels of educational differences between husband and wife increases the likelihood of inter-marrying increases. As opposed to Javanese intra-marriages, Javanese husbands and wives who are in inter-marriages are more likely to marry down than to marry equally on education in both BBK and JMR. This means that status exchange on education applies among Central Javanese who inter-married local people in BBK and JMR.
By examining patterns and outcomes of migration out of Central Java, my thesis contributes to the literature in understanding contemporary patterns of inter-provincial migration, and employment and marital assimilation of migrants who originate from the same place of origin but who migrate to different places of destination.
Table of Contents
Declaration ... iii
Acknowledgements ... v
Abstract ... ix
Table of Contents ... xi
List of Tables ... xv
List of Figures ... xix
List of Appendices ... xxi
Chapter 1 Introduction ... 1
1.1 Rationale of the thesis ... 1
1.2 Background... 4
1.2.1 Setting of the study ... 4
1.2.2 Migration and population resettlement policy ... 6
1.2.2.1 Population resettlement policy during the Soekarno administration (1945–1966) ... 7
1.2.2.2 Population resettlement policy during the Soeharto administration (1966–1998) ... 9
1.2.2.3 Population resettlement policy during the Reform era (1998 - to date) .... 11
1.2.2.4 Summary ... 14
1.3 Organisation of the thesis ... 17
Chapter 2 Theoretical review ... 21
2.1 Concept of migration ... 21
2.2 Macro and micro theory in the migration literature ... 24
2.2.1 Macro theory in the migration literature ... 24
2.2.2 Micro theory in the migration literature ... 29
2.3 Adaptation of migrants at the place of destination ... 35
2.3.1 Employment outcomes of migrants ... 35
2.3.2 Concept of assimilation ... 38
2.3.2.1 Marital assimilation ... 41
spatial concentrations and structural patterns across provinces ... 49
3.1 Introduction ... 49
3.2 Background ... 51
3.3 Data ... 54
3.4 Patterns of inter-provincial migration flows ... 56
3.5 Investigating spatial concentration of inter-provincial migration flows ... 63
3.5.1 A Coefficient of Variation (CV) measure of spatial concentration ... 64
3.5.2 CV values for in- and out-migration rates ... 66
3.5.3 Provinces as redistributors of population ... 75
3.5.4 Sex concentrations of inter-provincial migration flows ... 78
3.6 Structural patterns of inter-provincial migration flows ... 80
3.7 Summary and conclusion ... 95
Chapter 4 Characterisation of Central Java’s primary, onward and return migrants: Patterns and rates of conditional probabilities of migration by age and sex ... 99
4.1 Introduction ... 99
4.2 Positioning Central Java in the context of Indonesia ... 101
4.3 Literature review ... 104
4.3.1 Conceptual framework ... 104
4.3.2 Method and data used ... 109
4.4 Findings ... 113
4.4.1 The number of Central Javanese migrants and migrations ... 113
4.4.2 Conditional probabilities of migration for Central Java’s primary, onward and return migrants ... 118
4.4.3 The patterns and rates of conditional probabilities of migration by age and sex for Central Java’s primary, onward and return migrants ... 120
4.5 Discussion and conclusion ... 131
Chapter 5 Employment outcomes of Central Java’s primary migrants in different economic zones ... 135
5.1 Introduction ... 135
5.2 Literature review ... 137
5.3 SMR, JMR and BBK zones ... 141
5.4 Variables, method and data used in the study ... 144
5.4.2 Method and data used ... 146
5.5 Findings ... 149
5.5.1 Descriptive analysis ... 149
5.5.2 Odds of being in work... 160
5.5.3 Sectoral analysis ... 162
5.6 Discussion and conclusion ... 171
Chapter 6 Marital assimilation amongst Central Javanese people in two destinations: Investigating patterns of exogamous marriage and status exchange 175 6.1 Introduction ... 175
6.2 Theoretical review and hypotheses ... 176
6.3 Background to the study ... 177
6.4 Data and methods used in the study ... 182
6.5 Findings ... 182
6.5.1 Descriptive analysis of marital assimilation of Central Javanese people in BBK and JMR based on ethno-migration status and ethnicity ... 186
6.5.1.1 Based on ethno-migration status ... 186
6.5.1.2 Based on ethnicity ... 192
6.5.2 Inferential analysis of the marital assimilation of Central Java married couples based on ethno-migration status and ethnicity in BBK and JMR ... 199
6.5.2.1 Based on ethno-migration status ... 199
6.5.2.2 Based on ethnicity ... 202
6.5.3 Testing status exchange on education among Central Javanese inter-marriage couples by ethno-migration status and ethnicity ... 208
6.5.3.1Descriptive analysis of educational matching by ethno-migration status and ethnicity... 208
6.5.3.2 Inferential analysis ... 212
6.6 Discussion and conclusion ... 215
Chapter 7 Conclusions ... 221
7.1 Introduction ... 221
7.2 Summary of the thesis findings ... 221
Patterns and rates of conditional probabilities of migration by age and sex222 7.2.3 Employment outcomes of Central Java’s primary migrants in different
economic zones ... 225
7.2.4 Marital assimilation amongst Central Javanese people in two destinations: Investigating patterns of exogamous marriage and status exchange ... 228
7.3 Theoretical implications ... 230
7.4 Implications for policy debates ... 230
7.5 Suggestions for future research ... 234
References ... 239
List of Tables
Table 1.1 Number of transmigrants and their provinces of origin, 1950–1966 ... 8
Table 1.2 Objective of transmigration in each development plan ... 9
Table 2.1 The stages of assimilation (Gordon, 1964, p. 71) ... 40
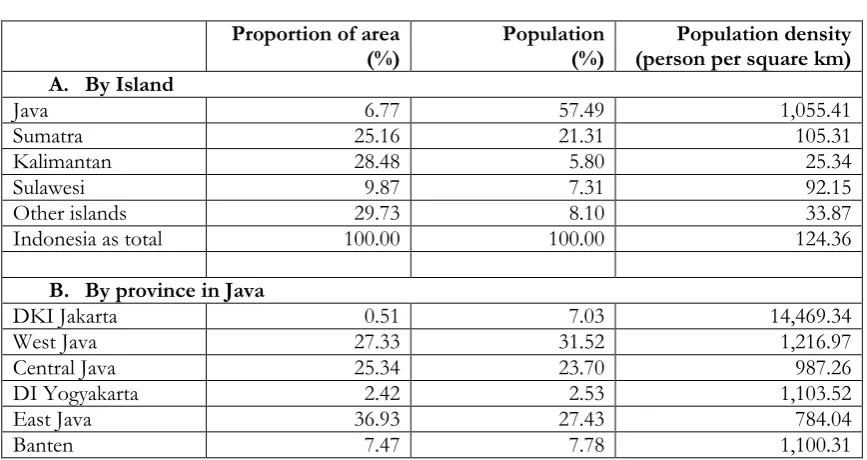
Table 3.1 Area, population and population density by islands in Indonesia, 2010 ... 52
Table 3.2 List of new provinces and date of splitting, up until 2010 ... 55
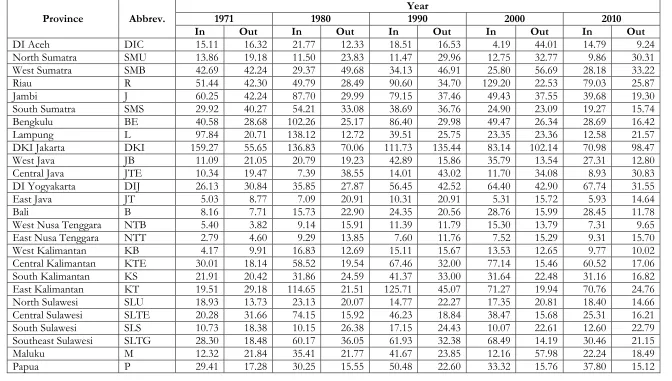
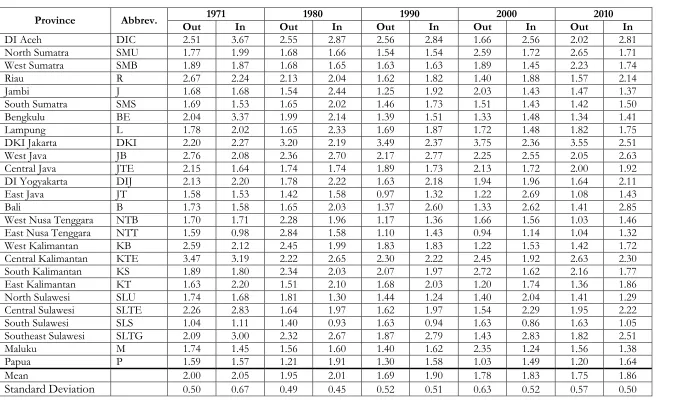
Table 3.3 Five-year inter-provincial migration rates of Indonesia, 1971–2010 (per 1,000 persons) ... 58
Table 3.4 ACV field indices of inter-provincial migration ... 67
Table 3.5 CV field indices for out- and in-migration flows for provinces of Indonesia, 1971–2010... 70
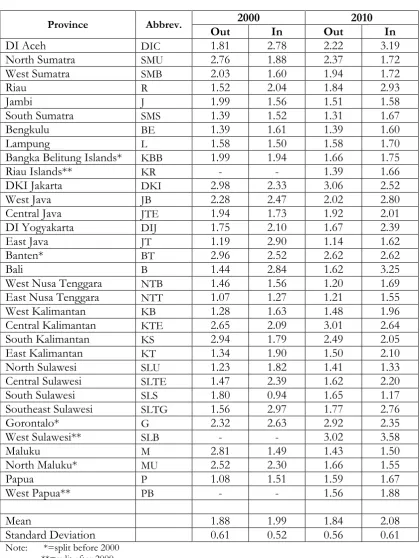
Table 3.6 CV field indices for out- and in-migration flows, Indonesia, 2000 and 2010, 33 provinces ... 73
Table 3.7 ACV field indices of inter-provincial migration ... 75
Table 3.8 Classification of provinces that were redistributors of population, 1971–2010 ... 77
Table 3.9 ACV values for male and female inter-provincial migration flows, 2010 ... 78
Table 3.10 ACV values for male and female inter-provincial migration flows, 2010 ... 80
Table 3.11 Origin-destination-interaction components of inter-provincial migration flows, 2010 ... 83
Table 4.1 Number of migrants, Java Island and Central Java Province, 1971 to 2010 ... 103
Table 4.2 Definitions of Central Java’s primary, onward and return migrants ... 111
Table 4.3 Central Java’s primary, onward and return migrants, 1971 to 2010 ... 115
Table 4.4 Provincial distribution Central Java’s primary, onward and return migrants, 1971 to 2010 (per cent) ... 117
Table 4.5 Conditional probabilities of migration for Central Java’s primary, onward and return migrants, 1971–2010 (per 1000) ... 119
Table 5.1 Main activity of population aged 15–34 years in SMR, JMR, and BBK (per cent) ... 150
(per cent) ... 154
Table 5.4 Economic sectors of individuals who were currently working in the SMR, JMR and BBK (per cent) ... 156
Table 5.5 Economic sectors of Central Java’s primary migrant workers aged 15–34 years in SMR, JMR and BBK (per cent) ... 159
Table 5.6 Odds of being in work in SMR, JMR and BBK ... 161
Table 5.7 Odds of being in work in the manufacturing, trade and service sectors ... 164
Table 5.8 Odds of being in work in a particular sector by sexes in SMR ... 166
Table 5.9 Odds of being in work in a particular sector by sexes in JMR ... 168
Table 5.10 Odds of being in work in a particular sector by sexes in BBK ... 170
Table 6.1 Inter-marriages of local-born husbands and wives by their spouse’s ethno-migration status in BBK and JMR, 2010 ... 188
Table 6.2 Percentage distributions of marriages by ethno-migration status of husbands and wives in BBK and JMR, 2010 ... 190
Table 6.3 Exogamy rate of co-resident married couples in BBK and JMR, 2010 ... 192
Table 6.4 Malay husbands and wives by their spouse’s ethnicity in BBK, 2010 ... 194
Table 6.5 Sundanese, Betawi and Bantenese husbands and wives by their spouse’s ethnicity in JMR, 2010 ... 195
Table 6.6 Percentage distributions of marriages by ethnicity of husbands and wives in BBK and JMR, 2010 ... 197
Table 6.7 Exogamy rate of co-resident married couples in BBK and JMR, 2010 ... 199
Table 6.8 Likelihood of being in exogamous marriages of co-resident married couples based on ethno-migration status in BBK and JMR, 2010 ... 201
Table 6.9 Likelihood of being in exogamous marriages of co-resident married couples based on ethnicity in BBK and JMR, 2010 ... 203
Table 6.10 Likelihood of being in exogamous marriages of co-resident married couples based on ethnicity in JMR, 2010 ... 207
Table 6.11 Educational matching by inter-marriage among Central Java-born and local-born husbands and wives in BBK and JMR, 2010 ... 209
Table 6.12 Educational matching by inter-marriage among Javanese and local-ethnic husbands and wives in BBK and JMR, 2010 ... 211
List of Figures
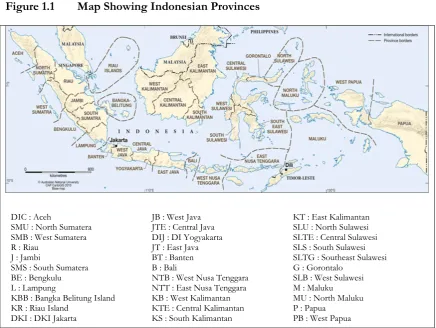
Figure 1.1 Map Showing Indonesian Provinces ... 5
Figure 1.2 Target and realisation of transmigration in Indonesia (No. of families) ... 10
Figure 1.3 Percentage of persons transmigrated by island of destinations ... 11
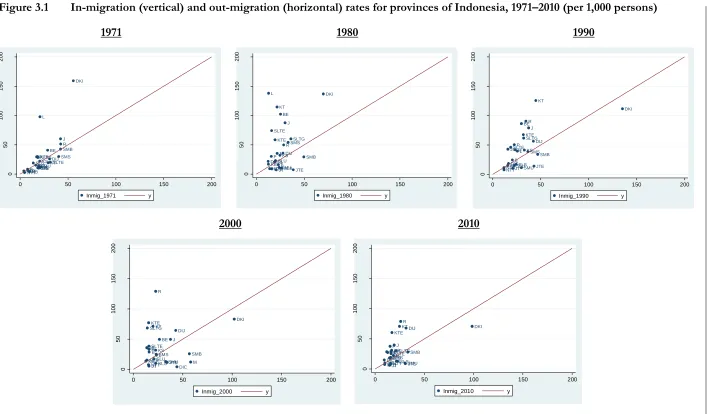
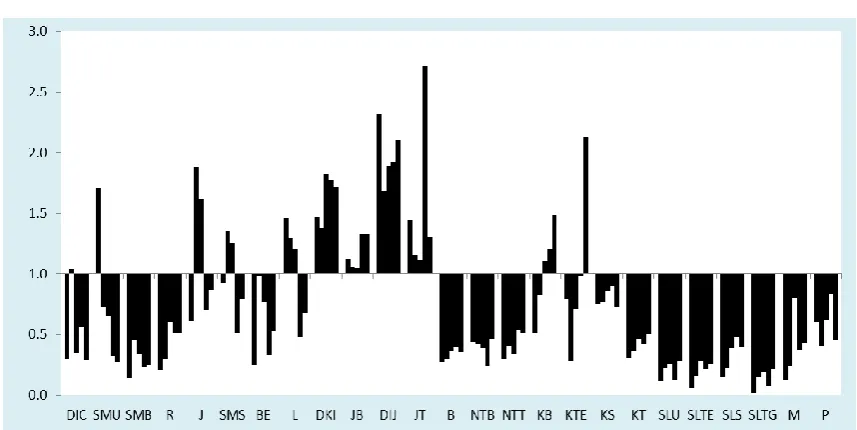
Figure 3.1 In-migration (vertical) and out-migration (horizontal) rates for provinces of Indonesia, 1971–2010 (per 1,000 persons) ... 62
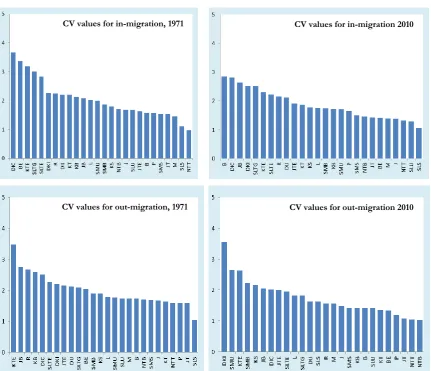
Figure 3.2 The provincials CV values for in- and out-migration, 1971 and 2010 ... 72
Figure 3.3 The origin component of inter-provincial migrations, 1971–2010 ... 85
Figure 3.4 The destination component of inter-provincial migrations, 1971–2010 ... 86
Figure 3.5 The destination component of inter-provincial migrations, 1971–2010 ... 87
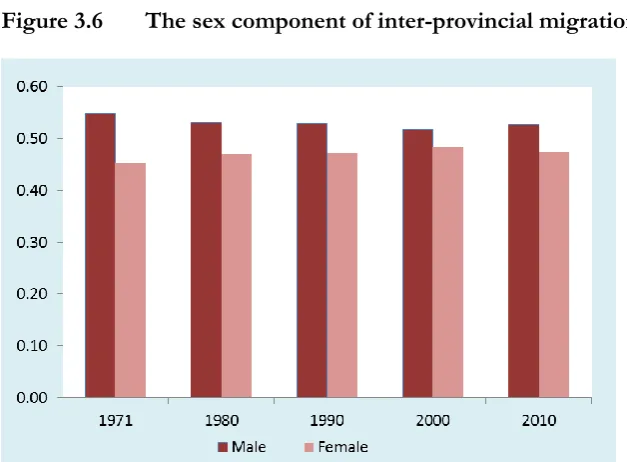
Figure 3.6 The sex component of inter-provincial migrations, 1971–2010 ... 88
Figure 3.7 Sex ratios of out-migrants by province, 1971–2010 ... 89
Figure 3.8 Sex ratios of in-migrants by province, 1971–2010 ... 90
Figure 3.9 Central Java-destination-interaction of inter-provincial migrations, 1971–2010 ... 91
Figure 3.10 Central Java-destination-interaction of inter-provincial migrations, 1971–
2010 (Jakarta and West Java are combined) ... 92
Figure 3.11 Origin-Central Java-interaction of inter-provincial migrations, 1971–2010 . 93 Figure 3.12 Origin-Jakarta-interaction of inter-provincial migrations, 1971–2010 ... 94
Figure 3.13 Jakarta-destination-interaction of inter-provincial migrations, 1971–2010 ... 95
Figure 4.1 Distribution of age groups (%) and conditional probabilities of migration by age groups for Central Java’s primary, onward and return migrants (per 1000), 2010 ... 121
Figure 4.2 Changes in distribution of age groups (%) and conditional probabilities of migration by age groups for Central Java’s primary, onward and return migrants (per 1000), 2000–2010 ... 123
Figure 4.3 Changes in the sex ratio (males per 100 females) and conditional probabilities of migration by sex for Central Java’s primary, onward and return migrants (per 1000), 2000–2010 ... 124
of migration by age groups and sex for Central Java’s primary, onward and return migrants (per 1000), 2000–2010 ... 127 Figure 4.6 Changes in the sex ratio by destination provinces/provinces five years before
the census for Central Java’s primary, onward and return migrants, 2000–2010 ... 129 Figure 4.7 Changes in the sex ratios of conditional probabilities of migration by
destination provinces/provinces five years before the census for Central Java’s primary, onward and return migrants, 2000–2010... 130 Figure 5.1 Age group distribution of population aged five years and above by migration
List of Appendices
Appendix 1 Figures of provincial CV values for out-migration, 1971-2010 ... 255
Appendix 2 Figures of provincial CV values for in-migration, 1971-2010 ... 256
Appendix 3 Maps of Jakarta Metropolitan Region (JMR), Semarang Metropolitan Region (SMR) and Batam Bintan Karimun (BBK) ... 257
Appendix 4 Questionnaires of the 1971 Population census... 258
Appendix 5 Questionnaires of the 1980 Population census... 260
Appendix 6 Questionnaires of the 1990 Population census... 266
Appendix 7 Questionnaires of the 2000 Population census... 272
1.1 Rationale of the thesis
Migration within Indonesia has a long history, a history associated with the uneven distribution of population across the archipelago that has persisted over centuries. Throughout this history, out-migration has been associated with population policy and, in particular, with one province, Central Java. The first resettlement of population was conducted in 1901 by the Dutch colonial government, relocating 155 families from Kedu, a residency in Central Java, to Gedong Tataan, south of Wai Sekampung, a region in Lampung (McNicoll, 1968; Tirtosudarmo, 2009). Since then, population resettlement policy has continued to be implemented to the present day and Central Java has been the province that sends the greatest number of migrants. The latest population census recorded that, in 2010, the number of Central Java-born who lived outside the province reached 6.8 million whilst the number of those people who five years earlier had lived in Central Java was one million (BPS, 2013). Central Java predominates among provinces of origin of lifetime and recent migrants.
less aggressive, quiet and accepting things peacefully1. The characteristics and nature of this
group are quite often taken for granted by third parties (Spaan, 1994). This explains how migration out of Central Java has occurred and has been triggered mostly by government policies.
Secondly, it is important to investigate migration out of Central Java because Central Java consistently sends the greatest number of migrants across the nation. It was noted in 1971 that there were 1.7 million Central Javanese life time migrants, that is, people who were born in Central Java but lived outside the province. This figure accounted for 24 per cent of all out-migrants in 1971 (Hugo, 2001, p. 57). The sustained dominance of Central Java as the major origin of inter-provincial migrants continues over time. The latest population census reported that, in 2010, one quarter of the people who lived outside their province of birth originated from Central Java (BPS, 2013).
Thirdly, the flow of people out of Central Java is investigated because people who left were amenable to migration due to macro-economic conditions that were not attractive to the majority of its residents. This can be seen by a comparison of the three largest provinces in Java. In 2010, the contribution of West Java to the total population of Indonesia was 18 per cent, while the equivalent figures were 16 per cent and 14 per cent for East Java and Central Java, respectively. In terms of macro-economic indicators, however, Central Java is far behind. For instance, the share of West Java’s and East Java’s Gross Domestic Regional Bruto (GDRB) to the national economy was 15 per cent each in 2013 whilst the share of Central Java’s GDRB was only 8 per cent (BPS, 2014). At the same time, the share of Jakarta’s GDRB, the nation’s capital, was 17 per cent (BPS, 2014). Thus, as opposed to Central Java, the economic performances of West Java, East Java and Jakarta are much better leading to many more jobs being created in those three provinces. Thus, the persistent outflow of migrants from Central Java can be explained by persistent inequality in economic opportunities between Central Java and other provinces.
Fourthly, it is important to understand migration out of Central Java because it has contemporary political relevance, in particular, in terms of ethnicity, power and dispersion. Central Java is the heartland of Javanese ethnicity; 98 per cent of Central Java’s population are Javanese (Ananta et al., 2014). The Javanese also constitute the largest ethnicity in Indonesia and account for 40 per cent of the national population (Ananta et al., 2014). Continuous outflows of Central Javanese people generate a great dispersion of the Javanese ethnic group across other provinces. At the place of destination, Central Java’s migrants often participate in local government. For instance, it is common to find that a province that is located outside Java Island has a Javanese governor. The participation of Javanese migrants in local government can be considered to be a form of migration assimilation at the place of destination. Another form of migration assimilation is inter-marriage between Central Java’s migrants and local people at the place of destination. Inter-marriage is considered to be one source of ethnic diversity and in a multi-ethnic nation such as Indonesia, a study on assimilation of migrants is crucial (King & Skeldon, 2010).
The thesis explores a series of topics in the migration literature. The main objective of the thesis is to investigate contemporary patterns and outcomes of migration out of Central Java as regards the overall picture of contemporary patterns of population movement within Indonesia based on five decennial Indonesian population censuses (1971, 1980, 1990, 2000 and 2010 censuses). Specifically, the thesis examines inter-provincial migration patterns over 40 years of analysis and investigates out-migration patterns from Central Java; calculates the rates of conditional probability of migration of Central Java’s primary, onward and return migrants; investigates employment outcomes of Central Java’s primary migrants in different destinations; and examines patterns of exogamous marriage and status exchange in relation to education among Central Javanese people based on their ethno-migration status and ethnicity in selected destinations.
importance of origin-destination-specific migration in studying internal migration. The thesis enriches the migration literature by applying rates of conditional probabilities of migration in investigating the propensity to migrate amongst Central Java’s primary, onward and return migrants. There has been extensive research on the employment outcomes of migrants in specific destinations. To enrich the literature, the thesis contributes insights on the employment outcomes of migrants who share the same origin but who migrate to different destinations. In the context of Indonesia, very little is known about the inter-marriages of migrants, although migration has been part of Indonesia’s history. The thesis contributes to the literature by examining exogamous married couples in different places of destination. Further, the study enriches the literature by investigating status exchange on education among inter-married couples.
The current chapter begins by outlining the rationale, the objectives and the contribution of the thesis. The chapter then moves on to the background of the study which discusses the setting of the study and related population resettlement policy. The analysis of population resettlement policy relates to the period from Indonesian independence to the present time. The focus in this discussion is not merely on migration out of Central Java; rather it focuses on the overall origin and destination of transmigrants and how Central Java sends the largest number of transmigrants. The chapter concludes with the structure of the thesis which outlines the objectives, data used and research questions addressed in each analytical chapter.
1.2 Background
1.2.1 Setting of the study
Figure 1.1 Map Showing Indonesian Provinces
DIC : Aceh JB : West Java KT : East Kalimantan
SMU : North Sumatera JTE : Central Java SLU : North Sulawesi SMB : West Sumatera DIJ : DI Yogyakarta SLTE : Central Sulawesi
R : Riau JT : East Java SLS : South Sulawesi
J : Jambi BT : Banten SLTG : Southeast Sulawesi
SMS : South Sumatera B : Bali G : Gorontalo
BE : Bengkulu NTB : West Nusa Tenggara SLB : West Sulawesi L : Lampung NTT : East Nusa Tenggara M : Maluku KBB : Bangka Belitung Island KB : West Kalimantan MU : North Maluku KR : Riau Island KTE : Central Kalimantan P : Papua
DKI : DKI Jakarta KS : South Kalimantan PB : West Papua
Source: Australian National University. CAP CartoGIS.
provinces within Java Island is relatively greater. For instance, Central Java, a province with a population size similar to West Java and East Java, contributes only eight per cent to the national economy.
Another macro-economic indicator that can be used to demonstrate development imbalances across provinces is the percentage of people who are living under the poverty line. Statistics show that provinces in eastern Indonesia, such as Papua, Gorontalo and East Nusa Tenggara, are among those provinces with the highest percentage of poor people. For instance, 23 per cent of the population in East Nusa Tenggara Province were categorised as poor in 2010. Among provinces on Java Island, the percentage of poor people found in Central Java was high, reaching 17 per cent in 2010, four per cent higher than the national average of 13 per cent.
Based on the two indicators above, it can be said that economic inequality exists across provinces and this inequality may contribute to out-migration. Central Java becomes the centre of analysis because, relative to other provinces that also have low GDRB and high poverty rates, Central Java is one of the largest provinces in the country. Demographically speaking, the effect of Central Java’s out-migration on its population size and in particular on population at the places of destination would be much greater than the effect of migration from other provinces with a smaller population size.
1.2.2 Migration and population resettlement policy
The major sources of citations are the works of Hugo, Sjamsu, Hardjono, Oey and Lipscombe.
1.2.2.1 Population resettlement policy during the Soekarno administration (1945–1966)
Soekarno was certain that population resettlement policy (known as transmigration) could overcome population imbalances and he planned the policy immediately after independence (Sjamsu, 1960 p. 78). Population resettlement was prioritised throughout the Soekarno administration. In the process, however, the implementation of the policy was marked by frequent changes of the institution that was responsible for the program and of the objective of the population resettlement policy. The objective of the transmigration program fluctuated between the purely demographic outcome of gathering and resettling people from a crowded Java to Sumatra while providing those people with shelter and daily support until they themselves were capable of providing for their daily needs (Sjamsu, 1960 p. 5) and the need for national security in order to achieve a prosperous socialist Indonesian state (Oey & Astika, 1978 p. 27). In most cases, however, the number of transmigrants successfully relocated was far below the target.
The number of transmigrants relocated and their provinces of origin are shown in Table 1.1 below. The number of transmigrants is a total of general transmigrants and family transmigrants. General transmigrants refers to those who received full support from the government, while family transmigrants refers to those to whom the government only provided transportation, land and agricultural tools and who did not receive a house and rations loan because they came by the invitation of their relatives.
originated from Purbalingga, Banyumas and Purworejo, three regions in Central Java. Another 30 per cent of transmigrants originated from Yogyakarta and East Java. In contrast, only two per cent of transmigrants came from West Java. In 1952, the Soekarno administration planned an ambitious long-term transmigration program, called the 15-year transmigration plan. The plan aimed to relocate 48,675,000 people over a thirty five year period from 1953 to 1987. The plan was unachievable. For instance, the program target for 1965 was 50,000 families but only a quarter of the expected number of families was able to be relocated, accounting for 13,249 families or equal to 53,225 transmigrants.
Table 1.1 Number of transmigrants and their provinces of origin, 1950–1966
Year
No. of
transmigrants Province of origin of transmigrants
Family Persons Central Java West Java Yogya karta East Java Others Total
1950 23 77 n.a. n.a. n.a. n.a. n.a. n.a. 1951 790 2,951 53.8 2.3 13.2 17.0 13.6 100.0 1952 3,855 17,605 49.9 2.3 15.6 28.4 3.9 100.0 1953 9,240 40,009 31.9 7.6 11.1 36.9 12.6 100.0 1954 8,409 29,738 31.6 18.0 10.9 25.4 14.1 100.0 1955 5,500 21,389 30.3 14.8 9.1 25.5 20.3 100.0 1956 6,091 24,350 39.8 13.3 11.2 33.3 2.4 100.0 1957 4,421 23,230 32.9 8.3 9.0 20.4 29.3 100.0 1958 4,799 26,419 35.5 5.1 22.3 21.1 16.0 100.0 1959 11,439 46,096 33.2 13.0 5.8 31.5 16.5 100.0 1960 5,625 22,075 32.0 9.9 8.9 31.3 18.0 100.0 1961 5,064 19,609 43.2 26.1 7.0 22.0 1.8 100.0 1962 5,075 22,129 45.1 13.7 7.4 24.6 9.2 100.0 1963 7,327 32,159 14.4 2.6 2.2 9.8 71.1 100.0 1964 3,425 15,222 51.4 4.5 30.7 0.4 13.0 100.0 1965 13,249 53,225 49.8 7.9 14.1 25.9 2.2 100.0 1966 1,148 4,648 25.6 29.2 8.8 24.7 11.7 100.0 Source: Hardjono (1977); Oey & Astika (1982, p. 34–35).
from West Java. In 1951, 1952, 1964 and 1965 the percentage of transmigrants from Central Java was half of the total number transmigrants relocated in that particular year. This shows that Central Java was the main source of migrants over these years.
1.2.2.2 Population resettlement policy during the Soeharto administration (1966–1998)
During the Soeharto era, the objective of population resettlement was embedded into national development (Hugo et al., 1987, p. 289). The specific objectives of the transmigration program were included in the Five-Year Development Plan (Rencana Pembangunan Lima Tahun – REPELITA) as shown in Table 1.2 below. Soeharto underlined the need for family planning to control the population size of Java while at the same time continuing the policy of population resettlement.
Table 1.2 Objective of transmigration in each development plan
Plan Time span Objective of transmigration
REPELITA I 1969–1974 to utilise empty lands and to establish basic infrastructure in
regions outside Java
REPELITA II 1974–1979 to support employment of transmigrants and to financially
contribute to their daily lives
REPELITA III 1979–1984 to provide compensation for the indigenous people, to
establish cooperatives, and to vigorously promote family planning
REPELITA IV 1984–1989 to attract more spontaneous migrants
REPELITA V 1989–1994 to promote development of settlement regions through
improvement of the standard of living of transmigrants and local people and to re-organise the rights of land use and to reduce environment degradation and land misuse
REPELITA VI 1994–1999 to promote sustainable land use and natural resources and to
develop agro-business, agro-industry and other programs Source: Hugo et al., (1987).
ambitious and unachievable targets. In some years, the number of families transmigrated was greater than the target but this was due to the presence of spontaneous transmigrants that is, those who migrated with little or no help from government. According to Hardjono (1986), out of 535,474 families who transmigrated over the REPELITA III period, 32 per cent were spontaneous transmigrants, translating into 169,497 families who relocated themselves with no or limited government assistance. The other 365,955 families were part of the fully supported government transmigration. Within the general transmigrant category during REPELITA III, 22,284 families consisted of of local settlers and 42,414 families were transferred between receiving areas. Based on the impressive outcomes of REPELITA III, the government set another ambitious target for REPELITA IV. The program was expected to relocate 750,000 families outside Java, translating into around 3.6 million people. In reality, only one third of the targeted families actually transmigrated.
Figure 1.2 Target and realisation of transmigration in Indonesia (No. of
families)
Source: Compilation from several sources.
During REPELITA I (1969–1974), the largest proportion of transmigrants (32 per cent) originated from Central Java. It was recorded that 32 per cent of transmigrants relocated during the period came from Central Java. In second position was East Java, contributing 29 per cent of the total transmigrants (Hardjono, 1977). Over the REPELITAs, Central Java remained the main source of transmigrants. In the last period of the Soeharto administration, one out of four transmigrants was of Central Java origin.
0 100,000 200,000 300,000 400,000 500,000 600,000 700,000 800,000
In relation to the destination of transmigrants, there were substantial changes in the receiving islands of transmigrants as shown in Figure 1.3 below. It can be seen that Sumatra consistently absorbed the largest proportion of transmigrants but its percentage decreased over time. Lampung in the southern part of Sumatra, which had been the main focus of transmigration from the Dutch period onwards, became no longer was the main transmigration site. This can be explained by a shortage of land suitable for the transmigration program and it was expected that Lampung would be closed to transmigrants (Hugo et al., 1987). As an alternative, the receiving areas were shifted to provinces in eastern Indonesia. Kalimantan was home for 14 per cent of transmigrants during REPELITA I, accounting for 29,013 settlers relocating to the island. By the end of REPELITA VI, of the total transmigrants resettled, 28 per cent relocated to Kalimantan. The level of transmigration to Sulawesi, however, decreased over time. At the same time, other islands located in the eastern part of the archipelago, such as Maluku and Papua, experienced a substantial increase in the number of transmigrants.
Figure 1.3 Percentage of persons transmigrated by island of destinations
Source: Compilation from several sources.
1.2.2.3 Population resettlement policy during the Reform era (1998 – to date)
There is a dearth of up-to-date and complete published information on transmigration from the department responsible; however, I managed to get some data. These data indicate that the program achievement was low through to 2012. From an article written by Adhiati and Bobsien (2001), it was recorded that to November 1999, the government set
0 20 40 60 80 100
targets to resettle 16,235 families. The actual number resettled was 4,409 families, equal to 22,000 people. Out of the 4,409 families resettled, nearly half were spontaneous transmigrants (2,129 families). In the year 2000, there were only 2,265 families resettled, of which 1,260 were local transmigrants who moved within the resettlement areas. Information from the department responsible stated that there were 14,000 and 12,000 families who transmigrated in 2004 and 2005, respectively. During 2005 to 2009, 82,000 families were targeted to resettle; however, the target was not achieved. In 2010, the number of families who transmigrated was 8,875 but this fell to 7,274 families in 2011 and then slightly increased to 7,546 families in 2012.
Under the Jokowi administration, the transmigration program has been revived with more or less similar objectives to the previous administration. The transmigration program is seen as an alternative way to distribute levels of development evenly across provinces and to boost the domestic economy through the fishery and farm economic sectors. Under the Jokowi administration, the transmigration program aims to relocate four million transmigrants annually during the period 2015 to 2019. To support the plan, the government has allocated Rp. 1.4 trillion from the national budget to support land clearing costs, settlement, infrastructure and lump-sum (monthly income received by transmigrants). The amount of lump-sum is Rp. 3.5 million per head of household for a period of 18 months. The government also allocates 0.25 ha. free for all heads of household and another three ha. of plantation land that transmigrants should pay for in instalments (Aditiasari, 2015).
The current Minister of Villages, Development of Isolated Regions and Transmigration said that the transmigration program will promote a new concept of population resettlement. The Minister said that the concept of migration is not only to relocate people but also to widen employment opportunities for skilled workers. He added that the transmigration program will adopt a new concept of development, called an agro-district, in which transmigration sites are being converted to elite regions. The agro-district concept is based on a modern agriculture layout through establishing organic types of agriculture in each district. Through the channel of transmigration, the Minister argued, the Jokowi agenda on national food security for the nation can be achieved (Aditiasari, 2015).
The master plan for the 2015 transmigration program has been set up and is ready to implement. In an initial stage, 48 transmigration sites with potential for agriculture, fishery and plantation development would be established immediately after the approval of the budget. Potential transmigrants would be assessed on the basis of their skills in agriculture, fishery and plantation. At the same time, the program would also establish a housing complex for six thousand families of the armed forces in East Kalimantan and West Kalimantan. Kalimantan has been selected for political reasons, to protect national boundaries. The sites will be equipped with public infrastructure such as schools, public health centres, places of worship, and industrial zones if possible. Sulawesi is also being prepared as a transmigration site. Transmigrants will be relocated to regions in Sumatra, Sulawesi and Kalimantan. For Kalimantan in particular, the transmigration sites are border regions with Malaysia.
Transmigration candidates can participate in the program by applying online through official transmigration websites. There is a list of requirements that should be possessed by the potential transmigrants. They should be:
1. An Indonesian citizen
2. Married, approved by official marriage paper 3. Possess current population registration card (KTP) 4. Aged between 18 and 50 years old
5. Never participated in a previous transmigrant program 6. Healthy
8. Agree to obey all rules and procedures 9. Pass the selection process
Apart from the above requirements, there are three exceptions for persons who want to take part in the program. Firstly, it is allowed for an unmarried person to take part if he or she possesses specific expertise (teachers, paramedics and clergy). Secondly, it is allowed for a widow who is accompanied by her adult son and, thirdly, it covers those who are victims of natural disasters or social unrest.
The Minister of Villages, Development of Isolated Regions and Transmigration said that the transmigration program has improved the employment outcomes and welfare of 2.2 million families, the equivalent of 8.8 million transmigrants (Batubara, 2015). He added that the program has successfully established 1,168 villages, 385 districts and 104 regions/municipalities. An illustration of the success of the transmigration program was the designation of Mamuju, a former transmigration destination, as the capital city of West Sulawesi.
1.2.2.4 Summary
that is, their marital status. Only those who are married are eligible to apply as transmigrants. Under the Jokowi administration, an unmarried individual is allowed to join the program if he or she possesses specific expertise (teachers, paramedics and clergy). Apart from those occupations, there is no place for the unmarried. Unmarried people are considered as people with a high risk of creating conflicts or social unrest, in particular with local people at the place of destination, even though there is no statistical evidence to support this claim.
However, it is actually the young who have the greatest likelihood to migrate and to assimilate with the locals. One proxy of migration acculturation in receiving areas is in the form of inter-marriage between migrants and local people. Inter-marriage brings positive outcomes for both parties (Gordon, 1964; Kalmijn, 1998). It can reduce potential conflict between settlers and indigenous people and strengthen kinship and relationships. It also helps settlers to adapt and adjust easily to local culture, diet, attitudes and behaviours. Further, inter-marriage brings strong inter-region connectivity, creates a new form of culture, eliminates group boundaries and in the long run increases spontaneous migration.
Secondly, the objective of the program which is aimed at reducing population pressure on the inner islands needs to be reconsidered. Past experience has shown that this objective is unattainable. The only option for migration out of Java is to establish new economic geographies outside Java. The decentralisation system has provided avenues for this approach. Successful economic regions such as those in Batam Islands and Kalimantan have shown this to be the case. It can be said that new economic geography is a by-product of the decentralisation system. Employment possibilities offered by new economic sites automatically attract people either through the channel of government or spontaneously. This is good for the development of the region and its fringe areas, to attract more people to migrate out of Java and also as an alternative to migration to Jakarta, which has been the main destination for migrants.
Furthermore, in many instances transmigrants have had conflicts with local people. The main driver of conflict is the unwillingness of both transmigrants and local people to assimilate with each other. Different treatment received by both transmigrants and local people in terms of government assistance, access to local infrastructure and earnings are factors that fuel these conflicts. Also, there has been little effort made by the government or the ministry in charge to monitor and evaluate the program over time.
To sum up, it can be said that migration within Indonesia has a strong association with population policy. The term transmigration was introduced by the Soekarno administration. To date, the term is still being used by the Jokowi administration. The aim of transmigration policy has changed quite frequently. In the early stages, the demographic factor – the presence of population imbalances across provinces – was the main driver of transmigration policy. In the later stages, the aim of the transmigration policy has been to include economic, cultural and sovereignty factors. There has been an improvement in the recruitment process for potential transmigrants. The current administration has outlined a clear list of requirements and training for candidates who want to transmigrate. Apart from the fact that the current government seems ready to implement the transmigration policy, little is known, in particular from the ministry in charge of the policy, as to how it will monitor and evaluate the program consistently over time. Evaluation and monitoring of such policy is important to measure the degree of success of the policy and also to give insights as to how to maintain the momentum so that the policy can run effectively for the next five years.
the percentage in West Java reached 35 per cent, increasing more than threefold from 1971. If Central Javanese migrants going to Jakarta and West Java are combined because most of those in West Java are in the Jakarta Metropolitan Region, the number of recent migrants in 2010 reached more than half a million. Migrants move from Central Java to Jakarta and Batam mainly to gain access to job opportunities. They move voluntarily or through the help of the third parties. The number of Central Javanese-born people who live outside the province is much higher than the number of Central Javanese recent migrants over the same period of time. Therefore, it can be said that while the transmigration program has been an instrument for people to migrate from Central Java, other forms of migration contribute significantly to migration out of Central Java. Building on that, it is important to underline here that this thesis does not investigate transmigrants from Central Java specifically nor does it evaluate the transmigration program. Rather this thesis has a broader focus on migration out of Central Java between 1971 and 2010.
1.3 Organisation of the thesis
The thesis explores a series of topics in migration studies in Indonesia and relies upon both macro and micro approaches from the migration literature. The first two analytical chapters address the numbers, directions, patterns and changes over time of migration in Indonesia. The results from these two chapters lead to the third and fourth analytical chapters of the thesis that focus on the employment outcomes and marital assimilation of Central Java’s migrants in different places of destination using micro- approaches.
The thesis is organised into seven chapters. In Chapter 1, I begin with an introduction that contains the importance and the objective of the thesis. I outline the setting of the study and briefly discuss population resettlement policy from Indonesian independence to date. I provide the thesis outline and detail on research questions for each analytical chapter.
In Chapter 2, I provide a theoretical review of the thesis. The literature review encompasses the macro and micro approaches to migration in the context of internal migration and past studies in this field.
1. What are the inter-provincial migration patterns over time? 2. How do the patterns of spatial concentration change across time? 3. What are the structural patterns across provinces?
The aim of this chapter is to provide an overview of inter-provincial migration in Indonesia over the 40-year period. The chapter uses statistical approaches to measure population movements across time. The hypotheses in this chapter are that:
1. There has been no dramatic change in the patterns of internal migration in Indonesia over the 40 years of the analysis.
2. The direction of migration follows an economic pattern in which Jakarta remains the leading destination for migrants but other new geographies outside Java could attract substantial numbers of migrants.
3. Central Java contributes the main source of migrants for the nation.
Chapter 4 focuses on migration out of Central Java. Specifically this chapter investigates the conditional probabilities of migration among Central Java’s primary, onward and return migrants based on the 1971 to 2010 censuses. The chapter raises a series of research questions:
1. How many people have migrated from Central Java based on the 1971 to 2010 censuses?
2. Who are Central Java’s primary, onward and return migrants?
3. What are the conditional probabilities of migration of Central Java’s primary, onward and return migrants?
4. Are patterns of the conditional probabilities of migration different among Central Java’s primary, onward and return migrants?
5. Are there differences in the conditional probabilities of migration for Central Java’s primary, onward and return migrants according to their age and sex?
This chapter uses descriptive analysis to answer the research questions. The study assumes that there are age, sex and destination differences in rates of conditional probabilities to migrate among Central Java’s primary, onward and return migrants.
work in a particular sector for migrants who share the same origin but who migrate to different places of destination. The key research questions of the chapter are:
1. Are Central Java’s primary migrants more likely to find work than non-migrants? 2. Are employment outcomes different between Central Java’s primary male and
female migrants?
3. Are Central Java’s primary migrants more likely to work in manufacturing, trade or service sectors than non-migrants?
4. Are Central Java’s primary migrants in JMR more likely to work in manufacturing than migrants in other zones?
5. Are Central Java’s primary female migrant workers to BBK more likely to work in manufacturing than in other zones?
There is a series of hypotheses for this chapter:
1. Migration status influences the likelihood of being in work.
2. Central Java’s primary migrants are more likely to work than non-migrants in the destination areas.
3. Migrants are more likely to work in either manufacturing or trade or service sectors 4. The likelihood of Central Java’s primary migrants to be absorbed in the
manufacturing sector is higher than it is for other types of migrants. 5. Sex difference contributes to the sectoral outcomes of migrants.
This chapter utilises a binary logit regression model and a multinomial logit regression model to address the research questions.
Chapter 6 explores exogamous marriages and status exchange on education of Central Javanese people based on two approaches: ethno-migration status and type of ethnicity. The key research questions of the chapter are:
1. To what extent are Central Javanese people in exogamous marriages? 2. If they marry out, with what groups are they most likely to inter-marry?
3. How do Central Javanese couples compare with other groups in their degree of exogamy?
4. Among Central Javanese husbands/wives, who marries out?
6. Is status exchange in relation to education evident among Central Javanese people who inter-marry with local people?
For testing the exogamous marriages and status exchange on education, I assume that: 1. Central Javanese people are more likely to be in exogamous marriages than other
migrants’ groups.
2. Central Javanese people are more likely to inter-marry with local people.
3. Educational homogamy dominates Central Javanese inter-marriage with local people, but it is likely that Central Javanese husbands and wives marry better-educated local people.
A binary logit regression model and a multinomial logit regression model are used to answer the research questions in this chapter.
The aim of the thesis is to investigate patterns of migration from Central Java in the context of migration within Indonesia and how Central Javanese migrants adapt economically and socially at the host place. In relation to the aim of the thesis, the current chapter reviews relevant literature on the macro theory of migration that discusses the flows and aggregate numbers of migrants and the micro theory of migration that deals with employment outcomes and patterns of inter-marriages among Central Javanese migrants. The chapter provides past studies that have been conducted in this field and shows how this thesis fills the gaps in the migration literature. The chapter begins by providing a general concept of migration. The following section discusses the macro and micro theories of migration. The third section outlines forms of migrants’ adaptation at the place of destination. The last section provides conclusions of the chapter. Based upon the literature reviewed, a thorough knowledge of the patterns of migration and adjustments made by migrants is believed to be crucial in gaining an overall understanding of the process of migration out of Central Java.
2.1 Concept of migration
where reclassification takes place, a person may be considered to have moved from one type of location to another even though they have not moved at all, sometimes referred to as pseudo/fake migrants2 (Tan, 2008, p. 95).
With regard to the scope of migration, currently there are many more people who migrate internally than internationally (King & Skeldon, 2010). There is at least one pronounced factor that leads to more people crossing boundaries within a nation than people who are crossing international boundaries, that is, the costs of migrating. Travel costs are directly proportional with distance and so crossing national boundaries generally is more expensive when compared with moving internally (UNDP, 2009). The process of applying for passports and visas adds an extra monetary burden for potential international migrants. Cross-national regulations created by the host country can be considered to be another cost of international migration (Tirtosudarmo, 2009). Some destination countries restrict the inflow of migrants by selecting those who are highly skilled or those who already have an offer of work or study, while these conditions do not exist for internal movement. Non-pecuniary costs of migration that is, the physical and psychological costs, contribute to the total cost of migration. Accessible distance and sharing the same language with the host destination increase the propensity for people to move internally (Muhidin, 2003). To sum up, the costs of migration, both monetary and non-pecuniary, contribute to the preferences of people who are moving either internally or internationally.
According to King and Skeldon (2010), there are two avenues to distinguish between internal and international migration. Firstly, differences between internal and international migration can be seen from the volume of migration being measured. Relative to internal migration, it is easier to measure international migration. International migrants are a group of individuals who live in a nation different from their country of origin, while definitions of internal migration vary across countries. As a consequence, it is difficult to conduct cross-country comparisons of internal migration data. Secondly, internal migration differs from international migration in terms of the concept of distances and boundaries used in defining migration. It is likely that variations in sizes and shapes of regions affect migration rates across regions (Lee, 1957). Thus, squarish regions produce higher migrations both of
internal and international migration. Regions with a squarish shape tend to provide a shorter distance between regions because they are physically close to each other and allow individuals to cross regional boundaries in a shorter time than they would in non-squarish regions. As a consequence, the number of migrations produced from these regions is higher than the number of migrations produced from regions with other shapes.
In the Indonesian context, there is a huge disparity between provinces in terms of sizes and shapes with the size of provinces ranging from 664 square kilometres for Jakarta to 319,036 square kilometres for Papua (BPS, 2014). In terms of the shapes of provinces, there are provinces that consist of a group of small islands such as Maluku and Riau Islands and also provinces with squarish shapes such as provinces in Java. Thus, regardless of other factors, the number of inter-provincial migrants in Jakarta is not strictly comparable with the number in Papua because individuals moving to Papua must move much longer distances to be called migrants than those in Jakarta (UN, 1981). On the same note, if a group of countries forms a union such as Europe has, this reduces the number of national boundaries thus influencing the number of international migrants. Thirdly, there are differences in the factors influencing people to move internally or internationally. For example, King and Skeldon (2010) point out that there are differences in the economic factors that influence people to move either internally or internationally. In many cases, international migrants respond to the positive differences in the values of the origin and destination currencies while internal migrants respond to the economic disparities across regions without considering currency. The remainder of the chapter discusses theoretical and measurement aspects of internal migration.
cycle, economic and socio-cultural contexts and policy involved. The second question is related to macro theory because it relates to places rather than to people. The answer to this question is often related to macro-economic comparisons across regions and demographic dynamics that influence population composition or the number of potential migrants (White & Lindstrom, 2005).
2.2 Macro and micro theory in the migration literature
2.2.1 Macro theory in the migration literature
Mobility transition theory was first introduced by Zelinsky (1971). He proposed that there were five phases of mobility transition, namely, the pre-modern traditional society with limited residential migration; the early transition society with massive movements from the countryside to the cities; the late transitional society, where there was still major movement from the countryside to the cities; the advanced society with significant international migration; and a future super-advanced society with strong commuting patterns and more rigid procedures for internal and international migration. Zelinsky had made an effort to include modernization into the process, but that was not clearly specified (Skeldon, 1990). While considering Zelinsky’s mobility transition theory to be excessively universal and uni-linear, Skeldon (1990, 1992) proposed not to change it, but rather to propose some modifications to Zelinsky’s hypothesis in order to fit the experience of developing countries that encountered modernization in their transitions. Skeldon (1992) modified Zelinsky’s hypothesis by proposing that every region experiences different mobility transitions because they have different patterns of mobility, unless the regions were extremely homogenous in terms of settlement and social systems. In his more recent paper, Skeldon (2012) revisited mobility transition theory and proposed that patterns of mobility transition in the future will be associated with the unit being used to analyse the transition and its place in the global spatial system. Also, Skeldon (2012) argued that other variables should be taken into account such as agriculture, industry, and state structure as factors in the mobility transition.
argue that the migration literature on this issue touches less on the theoretical aspects and more on the statistics on the volume of migration (Etzo, 2008; White & Lindstrom, 2005). The reported statistics often provide separate information about the number of lifetime and recent migrants and overlook the number of migrations undertaken by migrants. Lifetime migrants may have moved many times between their birth and their enumeration in the survey/census but only the one move is observed. For movers in the last five years (recent migrants), three places are measured, place of birth, place of residence and current location, so at least two moves are potentially observable.
The dual-economic theory argues that differences between destinations can promote migration, and was introduced by Lewis (1954) and developed further by Ranis and Fei (1961). The theory argues that differences in the labour supply and wages in urban and rural sectors induce flows of workers from rural to urban areas. The process continues until there is no wage difference between urban and rural areas. In this regard, migration is seen as an equilibrating mechanism of development. The theory was then modified by Harris and Todaro (Harris & Todaro, 1970; Todaro, 1969) by adding the probability of finding a job in urban labour markets and the expected income of the migrants in the urban areas. The theory assumes that migration flows increase if the urban wage increases or the urban employment rate increases. The migration mechanism theory proposed by Ranis and Fei (1961) assumes that migration will disappear if wage equilibrium occurs between urban and rural areas. The argument proposed by Harris and Todaro (1970), which depicts migrants as having perfect knowledge and being economically rational individuals, is not always the case because some migrants move for non-economic reasons or they simply follow their relatives.
Greenwood (1997). He argues that travel costs present the current costs of migrating while benefits of migration are gained in the future. Based on this logic, the costs of migration will not influence migration strongly but the psychological costs attached to migration and information decrease as distance increases. Therefore, distance is not a sophisticated tool to determine migration flows and to depict connection between two places.
A recent study was conducted by Vidyattama (2014) regarding the impact of internal migration on provincial growth in Indonesia during the 1975 to 2005 period. The study used the economic approach in its analysis by applying the growth model. The aim of the study was to investigate whether or not inter-provincial migration flows were capable of creating a just development across provinces. Ideally, the process of inter-provincial migration leads to convergence of economic growth across provinces. The overall findings showed that inter-provincial migration played no role in regional convergence during the period of analysis. Vidyattama (2014) further estimated the impact of inter-provincial migration on provincial economic growth by conducting sub-period analysis from census data. He found similar findings to the study carried out by Lottum and Marks (2012) which showed that, prior to the 1980s, migration impeded the process of convergence, however, after that period, migration was found to have significantly facilitated the convergence of economic growth across provinces. Vidyattama (2014) argued that differences in the policy implementation during a particular time period produced differences in the impact of inter-provincial migration on inter-provincial economic growth. Therefore, it can be said that Indonesia’s inter-provincial migration flow is not purely influenced by wage differentials across provinces but is also due to government intervention on population movements and other related policies.
get an idea of whether or not someone migrates as part of a corrective movement or a primary movement.
A multi-regional perspective in migration patterns considers the system of origin-destination-specific migration. In short, a multi-regional perspective observes flows of migration from and to provinces within a closed internal migration system. It is important to adopt the multi-regional approach in analysing migration flows across regions within a nation because this approach provides insights about regions that experience continuous flows of in- or out-migration relative to the rest of the regions and about how migrants originating from a particular province distribute themselves across the remaining provinces (Raymer, Bonaguidi, & Valentini, 2006). By doing so, a broader picture of the migration streams can be captured. In addition, further analysis of migration, such as migration patterns of people who share the same place of origin but who migrate to different places of destination can be investigated precisely under the system of origin-destination-specific migration.
A multiplicative component model is a useful tool to measure connectedness between the place of origin and the place of destination with the absence of distance under the system of origin-destination-specific migration (Raymer et al., 2011; Raymer, Bonaguidi, & Valentini, 2006; Salzmann, Edmonston, & Raymer, 2010). According to this model, the volume of migrations between two places will be high if the two provinces are geographically close to each other. If the two places are sending and receiving a great number of migrants, it can thus be said that the two places are strongly connected. The level of connectedness between two provinces can be measured by the relative volume of in- and out-migrations between the two provinces. Thus, the multiplicative component model is useful in identifying the structures in the migration pattern (Raymer, Bonaguidi, & Valentini, 2006).