SOFTWARE MEASUREMENTS AND
METRICS: ROLE IN EFFECTIVE
SOFTWARE TESTING
Sheikh Umar Farooq*Research scholar, P.G. Department of Computer Sciences, University of Kashmir Srinagar, J&K – 190006.
S. M. K. Quadri
Head, P.G. Department of Computer Sciences, University of Kashmir Srinagar, J&K – 190006.
Nesar Ahmad
University Department of Statistics and Computer Applications, T. M. Bhagalpur University, Bhagalpur-812007.
Abstract:
Measurement has always been fundamental to the progress to any engineering discipline and software testing is no exception. Software metrics have been used in making quantitative/qualitative decisions as well as in risk assessment and reduction in software projects. In this paper we discuss software measurement and metrics and their fundamental role in software development life cycle. This paper focusing on software test metrics discusses their key role in software testing process and also classifies and systematically analyzes the various test metrics.
Keywords: Software Testing, Software Measurement, Measurement Scales, Software Metrics, Metrics Classification, Software Test Metrics.
1. Introduction
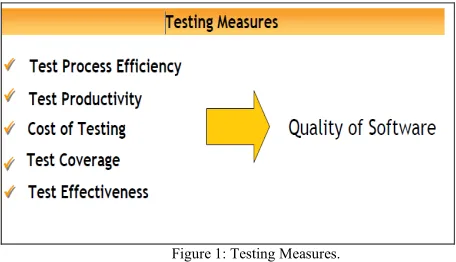
Software measurement has become a key aspect of good software engineering practice. Measurement activities adds value and keeps us actively involved in, and informed of, all phases of the development process. Measurement can help us to make specific characteristics of our processes and products more visible. Measurement encompasses quantitative evaluations that usually use metrics and measures which can be used to directly determine attainment of numerical quality goals. Despite all these advancements and envisaged benefits, software measurement does not seem to have fully penetrated into industrial practices. As far as the use of software measurement for quality evaluation is concerned, [1] have observed that its application has been as yet limited since most software metrics are still being used mainly for cost estimation. Hence, it is clear that everything should be measurable. If it is not measurable, we should make an effort to make it measurable [2]. Software testing is a vital element in the SDLC and can furnish excellent results if done properly and effectively [3] and software measurement can play a key role in increasing the effectiveness of testing process. The role of measurement in software testing has been exemplified by Munson [4]. He maintains that evaluating the test activities will give great insight into the adequacy of the test process and the expected time to produce a software product that can meet certain quality standards. But the first question is which testing artifacts can be and should be evaluated? Software metrics are used to evaluate the software development process and the quality of the resulting product [5]. Figure 1 shows the necessary measurements in testing which contribute to quality software. Software metrics aid evaluation of the testing process and the software product by providing objective criterion and measurements for management decision making. Their association with early detections and correction of problems make them important in software.
Corresponding author at; P. G. Department of Computer Sciences, University Of Kashmir, J&K (India) - 190006.
Software test metrics have found good number of applications during testing like reliability estimation, Source code coverage, test suite effectiveness etc. They provide meaningful and timely information, which may help us to take corrective actions as and when required. Effective implementation of metrics may improve the quality of the software and may help us to deliver the software in time and within budget.
Figure 1: Testing Measures.
2. Software Measurement
Measurement is a mapping from the empirical world to the formal, relational world. Consequently, a measure is the number or symbol assigned to an entity by this mapping in order to characterize an attribute [6]. This assignment of numbers or symbols to any entity is made according to unambiguous rule [7]. The rule of assignment can be any consistent rule excluding random assignment [8]. An entity may be an object, such as a person or a software specification, or an event, such as an organisation or a coded program. An atrrihute is a feature or property of the entity, such as size (of organisation) or number of lines (of coded program).
Characteristics of a good measurement are
Reliability- The outcome of the measurement process is reproducible. (Similar results are gotten over time
and across situations.)
Validity- The measurement process actually measures what it purports to measure.
Sensitivity- The measurement process shows variability in responses when it exists in the stimulus or
situation.
With respect to software, Measurement is the continuous process of defining, collecting, and analyzing data on the software development process and its products in order to understand and control the process and its products, and to supply meaningful information to improve that process and its products [9]. We cannot build quality software, or improve our process, without measurement. Measurement is essential to achieving the basic management objectives of prediction, progress, and process improvement.
Software is usually measured to serve following purposes.
Characterization,
i.e., the gathering of information about some characteristic of software processes andproducts, with the goal of acquiring a better idea of ``what's going on."
Evaluation, i.e., judging some characteristic of a software process or product, for instance based on historical
data in the same development environment or data available from external sources.
Improvement, i.e., using a cause-effect relationship to identify parts of the process or product that can be
changed to obtain positive effects on some characteristic of interest, and collecting data after the changes have been made to confirm or disconfirm whether the effect was positive and assess its extent.
Prediction, i.e., identifying a cause-effect relationship among product and process characteristics.
Tracking,
i.e., the (possibly constant and regular) acquisition of information on some characteristic ofsoftware processes and products over time, to understand if those characteristics are under control in on-going projects.
Validation, i.e., validating the identified best practices experimentally.2.1. Software Measurement process.
process and products. The measurement process is used to assess quality, progress, and performance throughout all life cycle phases. The key components of an effective measurement process are:
Clearly defined software development issues and the measure (data elements) needed to provide insight into those issues;
Processing of collected data into graphical or tabular reports (indicators) to aid in issue analysis;
Analysis of indicators to provide insight into development issues; and,
Use of analysis results to implement process improvements and identify new issues and problems.
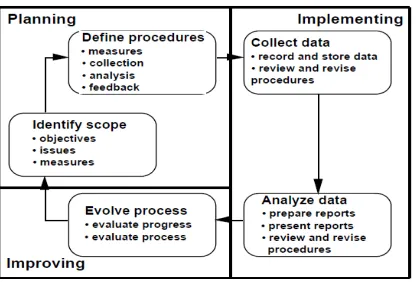
Figure 2 shows the software measurement process. The activities required to design a measurement process using this architecture are:
Developing a measurement process to be made available as part of the organization's standard software process;
Planning the process on projects and documenting procedures by tailoring and adapting the process asset;
Implementing the process on projects by executing the plans and procedures; and
Improving the process by evolving plans and procedures as the projects mature and their measurement needs change.
Figure 2 – Software Measurement Process.
2.2. Software Measurement Scales.
Five measurement levels are generally used in Measurement Theory which are applicable to software as well. Usually, the narrower the arrangement of acceptable changes, the smaller the number of scales, and the more informative the scale [10]. Measurement scales are hierarchal, and each level scale possesses all the properties of lower scales as shown below. We can convert higher level scales into lower level ones (i.e., ratio to interval or ordinal or nominal; or interval to ordinal or nominal; or ordinal to nominal). Powerful analysis can be applied to data with more informative scale of measurement.
• Nominal Scale
This is the most primitive form of measurement. A scale is a nominal one if it divides the set of entities into categories, with no particular ordering among them [10].
– E.g. IEEE 802.1, 802.2, 802.3…802.11. • Ordinal Scale
A scale is an ordinal one if it divides the set of entities into categories that are ordered according to some order [10]. There is no quantitative comparison.
– E.g. programmer skill (low, medium, high). • Interval Scale
– This scale captures information about the size of the intervals that separate classes. In an interval scale, the exact difference between two values is the basis for meaningful statements [10].
– E.g. programmer capability between: 60th and 80th percentile of population.
• Ratio Scale
– E.g. project A took twice as long as project B.
• Absolute Scale
Absolute scale is the most informative in the measurement scale hierarchy [10]. In absolute scale, measurement is done by counting method.
– E.g. number of failures observed during integration testing can be measured only by counting the number of failures observed.
2.3.Challenges with Software Measurement
Unambiguous measurement is vital in software development life cycle. There should be some standardized measures which can
Be used as a common baseline for measurement;
Offer a point of reference for software measurers to verify their measurement results and their ability to measure the same reference material;
Allow measurers to use the related reference concept, and thus to speak at the same level.
However measurement of software is challenging in nature Because of following reasons:
Software is an intangible product. It is an atypical product when compared to other industrial products, in that it varies greatly in terms of size, complexity, design techniques, test methods, applicability, etc [12].
There is little consensus on specific measures of software attributes, as illustrated by the scarcity of international standard measures for software attributes, such as software complexity and quality.
Software development is so complex that all models are weak approximations as they are hard to validate.
Measurements are not common to all projects, organizations. Measures that work for one project may not be applicable to another one.
3. Software Metrics
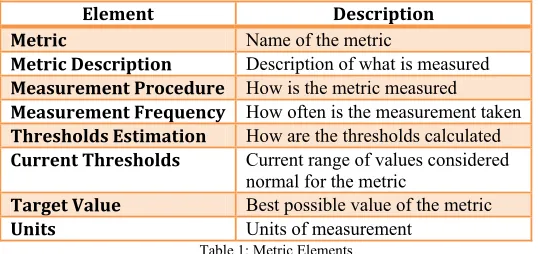
A metric is a quantifiable measurement of software product, process, or project that is directly observed, calculated, or predicted [13]. Metrics (or indicators) are computed from measures. Metrics facilitate the quantification of some particular characteristic. Metrics are measurements of different aspects of an endeavor that help us determine whether or not we are progressing toward the goal of that endeavor. Metrics are usually specialized by the subject area, in which case they are valid only within a certain domain and cannot be directly benchmarked or interpreted outside it. "Essentially, software metrics deals with the measurement of the software product and the process by which it is developed. They are quantifiable indices used to compare software products, processes, or projects or to predict their outcomes. Software Metrics should be well defined before they are utilized; Table 1 defines the elements that must be defined properly. With Software metrics, we can:
• Monitor requirements,
• Predict development resources, • Track development progress, and • Understand maintenance costs.
Element Description
Metric Name of the metric
Metric Description Description of what is measured
Measurement Procedure How is the metric measured
Measurement Frequency How often is the measurement taken
Thresholds Estimation How are the thresholds calculated
Current Thresholds Current range of values considered
normal for the metric
Target Value Best possible value of the metric
Units Units of measurement
Table 1: Metric Elements
3.1. Categories of Metrics.
From Commercial Perspective, Metrics can be classified into five classes to measure the quantity and quality of software.
Technical Metrics are used to determine whether the code is well-structured, that manuals for hardware and software use are adequate, that documentation is complete, correct, and up to date. Technical metrics also describe the external characteristics of the system’s implementation.
Defect Metrics are used to determine that the system does not erroneously process data, does not abnormally terminate, and does not do the many other things associated with the failure of a software-intensive system.
End-User Satisfaction Metrics are used to describe the value received from using the system.
Warranty Metrics reflect specific revenues and expenditures associated with correcting software defects on a case-by-case basis. These metrics are influenced by the level of defects, willingness of users to come forth with complaints, and the willingness and ability of the software developer to accommodate the user.
Reputation Metrics are used to assess perceived user satisfaction with the software and may generate the most value, since it can strongly influence what software is acquired. Reputation may differ significantly from actual satisfaction:
Because individual users may use only a small fraction of the functions provided in any software package; and
Because marketing and advertising often influence buyer perceptions of software quality more than actual use.
From significance perspective, Metrics can be grouped into two classes:
Core Metric is a required metric that is essential to support solution delivery test management on systems development projects. Example: Percentage of requirements met [14].
Non-Core Metric is an optional metric that can help to create a more balanced picture of the quality and effectiveness of test efforts. Example: Total number of defects by test phase [14].
From observation perspective, Metrics can also be categorized as:
Primitive metrics are those that can be directly observed, such as the program size (in LOC), number of defects observed in unit testing, or total development time for the project [15].
Computed metrics are those that cannot be directly observed but are computed in some manner from other metrics. Examples of computed metrics are those commonly used for productivity, such as LOC produced per person-month (LOC/person-month), or for product quality, such as the number of defects per thousand lines of code (defects/KLOC). Computed metrics are combinations of other metric values and thus are often more valuable in understanding or evaluating the software process than are simple metrics [15].
From measurement perspective, Metrics can be classified as:
Direct measurement of an attribute of an entity involves no other attribute or entity. Direct measurement is assessment of something existing [13]. E.g. number of lines of code.
Indirect/ derived measurement means calculation involving other attributes or entities by using some mathematical model (always contains a calculation of at least two metrics) [13].
E.g. defect density = no. of defects in a software product / total size of product.
Prediction System consists of a mathematical model together with a set of prediction procedures for determining unknown parameters and interpreting results [13]. E.g. Software Quality.
More often software metrics is categorized in a much broader sense as:
Process metrics are measures of the software development process, such as overall development time, type of methodology used, or the average level of experience of the programming staff. They can be classified as empirical, statistical, theory base and composite models.
Product metrics are measures of the software product at any stage of its development, from requirements to installed system. Product metrics may measure the complexity of the software design, the size of the final program (either source or object code), or the number of pages of documentation produced. They are often classified according with the size, complexity, and quality and data dependency.
Software metrics can also be classified as:
Subjective metrics may measure different values for a given metric, since their subjective judgment is involved in arriving at the measured value. For product metrics, the size of the product measured in lines of code (LOC) is an objective measure, for which any informed observer, working from the same definition of LOC, same measured value for a given program. An example of a subjective product metric is the classification of the software as “organic,” “semi-detached,” or “embedded,” as required in the COCOMO cost estimation model [9].
Although software metrics can be neatly categorized as primitive objective product metrics, primitive subjective product metrics, etc., this module does not strictly follow that organization.
3.2. Characteristics of Usable Metrics.
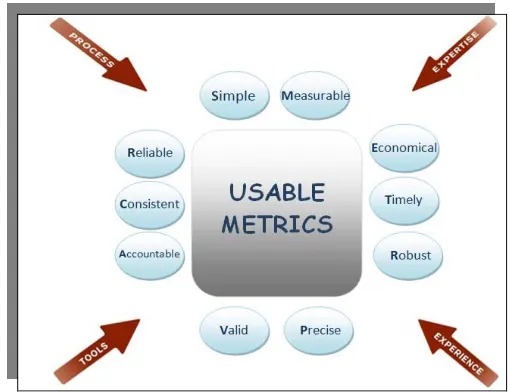
Metrics should not be collected because they are prescribed in the literature or because they are recognized as popular in some companies, but because they are helpful in decision-making on a particular project or within a given organization [13]. A useful metric is precisely defined (i.e., measurable or quantifiable), It also helps indicate whether an organization is achieving software goals [16]. There are several fundamental characteristics associated with useful software metrics. Useful software metrics must be (see figure 3)
Simple and easy to understand.
Measurable
Economical.
Metrics must be timely.
Robust.
Reliable and Valid.
Consistent and used over time.
Unobtrusively collected.
Independent.
Accountable.
Precise.
Useful metrics must be accompanied by data that is correct (correct according to the rules of the definition of the metric), accurate, exact and consistent (no large difference in the value occur, even if the person or measuring device changes). The measurement procedure must be clearly described clearly enough for someone else to be able to replicate the measurement.
Figure 3: Usable Metrics Characteristics.
4. Software Testing Metrics
test metrics. There are two broad categories of software metrics, namely product metrics and process metrics. Figure 5 shows the categories of Software testing metrics hierarchy.
Figure 4: Test Measures and Metrics Figure 5: Software Metrics Breakdown
Test process metrics provide information about preparation for testing, test execution and test progress. They
are utilized to monitor the progress of testing, status of design and development of test cases and outcome of test cases after execution. They don’t provide information about the test state of the product and are primarily of use in measuring progress of the Test Phase. Process metrics describe the effectiveness and quality of the processes that produce the software product. Examples are effort required in the process, time to produce the product, effectiveness of defect removal during development, number of defects found during testing, maturity of the process [18]. Some Test process metrics are:
(i.) Number of test cases designed. (ii.) Number of test cases executed. (iii.) % of test cases executed. (iv.) % of test cases passed. (v.) % of test cases failed.
(vi.) Total actual execution time / total estimated execution time (vii.) Average execution time of a test case.
Test product metrics provide information about the test state and testing status of a software product and are
generated by test execution and code fixes or deferment. The data for such metrics are also generated during testing and may help us to know the quality of the product. Using these metrics we can measure the products test state and indicative level of quality, useful for product release decisions. Product metrics describe the characteristics of the product such as size, complexity, design features, performance, efficiency, reliability, portability, etc [11]. Some Test product metrics are:
(i.) Estimated time for testing. (ii.) Actual testing time.
(iii.) % of time spent = (Actual time spent / Estimated testing time) * 100. (iv.) Average time interval between failures.
(v.) Maximum and minimum failures experienced in any time interval. (vi.) Average number of failures experienced in time intervals. (vii.) Time remaining to complete the testing.
4.1.Importance of Software Testing Metrics
that would be indicative of the stability of the process [18]. The essential step is establishing test metrics is to identify the key software testing processes that can be objectively measured. Measuring software development and testing projects is a challenging, but essential component of a professional organization. Software project may be running over time and over budget and still have a high number of defects. Or, it may be on time and on budget and have an even higher number of defects. Measuring allows you to quantify your schedule, development, and testing efforts. When you measure your current project performance, you become better equipped to schedule and budget for future projects. A major percentage of software projects suffer from quality problems, which in turn requires new testing metrics to measure test processes effectively. Test metrics are powerful risk management tool, help us to measure current performance. Test metrics are key “facts” and serve following purposes [19]:
Assists to understand the current position of the project.
Aids in prioritizing activities to reduce the risk of schedule over-runs on software releases.
Provides a basis for estimation and facilitates planning for closure of the performance gap.
Provides a means for control/status reporting.
Identify risk areas that require more testing.
Quickly identifies and helps to resolve potential problems and identifies areas of improvement.
Test metrics provide an objective measure of the effectiveness and efficiency of testing.
Setting quality benchmarks for several tasks and processes involved in development.
4.2.Notable Software Testing Metrics
Testing metrics may help us to measure the current performance of any project. The collected data may become historical data for future projects. This data is very important because in the absence of historical data, all estimates are just the guesses. Hence, it is essential to record the key information about the current projects. Test metrics may become an important indicator of the effectiveness and efficiency of a software testing process and may also identify risky areas that may need more testing. Table 2 lists some notable test Metrics. Metrics that are associated with software testing are broken up into three categories:
Coverage: Meaningful parameters for measuring test scope and success.
Progress: Parameters that help identify test progress to be matched against success criteria. Progress metrics are collected iteratively over time. They can be used to graph the process itself (e.g. time to fix defects, time to test, etc).
Quality: Meaningful measures of excellence, worth, value, etc. of the testing product. It is difficult to measure quality directly; however, measuring the effects of quality is easier and possible.
5. Conclusion
Metric Name
Description Category
Test
Coverage Total number of test procedures/total number of test requirements.
The Test Coverage metric will indicate planned test coverage. Higher values of this metric give confidence about the effectiveness of a test suite.
Coverage
System Coverage Analysis
The System Coverage Analysis measures the amount of coverage at the system interface level. Coverage
Test Procedure Execution Status
Executed number of test procedures/total number of test procedures
This Test Procedure Execution metric will indicate the extent of the testing effort still outstanding. Progress
Error Discovery Rate
Number total defects found/number of test procedures executed.
The Error Discovery Rate metric uses the same calculation as the defect density metric. Metric used to analyze and support a rational product release decision.
Progress
Defect
Acceptance This metric determine the number of valid defects that testing team has identified during execution. Defect Acceptance = (Number of Valid Defects /Total Number of Defects)*100 The value of this metric can be compared with previous release for getting better picture.
Progress
Bad Fix
Defect Defect whose resolution give rise to new defect(s) are bad fix defect. This metric determine the effectiveness of defect resolution process. Bad Fix Defect= (Number of Bad Fix Defect(s)/Total Number of Valid Defects)* 100. This metric gives the percentage of the bad defect resolution which needs to be controlled.
Progress
Defect Aging Date Defect was opened versus date defect was fixed
Defect Aging metric provides an indication of turnaround of the defect. Progress
Defect Fix
Retest Date defect was fixed & released in new build versus date defect was re-tested. The Defect Fix Retest metric provides an idea if the testing team is re-testing the fixes fast enough, in order to get an accurate progress metric
Progress
Test case
defect density This metric may help us to know the efficiency and effectiveness of our test cases. Test case defect density= (Number of failed tests/Number of executed test cases)*100
Where Failed test case: A test case that, when executed, produced an undesired output. Passed test case: A test case that, when executed, produced a desired output.
Higher values of this metric indicate that the test cases are effective and efficient, because they are able to detect more number of defects.
Quality
Current
Quality Ratio Number of test procedures successfully executed (without defects) versus the number of test procedures. Current Quality Ratio metric provides indications about the amount of functionality that has successfully been demonstrated.
Quality
Quality of Fixes
Number total defects reopened/total number of defects fixed
This Quality of Fixes metric will provide indications of development issues. Quality
Ratio of previously working functionality versus new errors introduced
The Quality of Fixes metric will keep track of how often previously working functionality was adversarial affected by software fixes.
Table 2: Notable Software Test Metrics
References
[1] Höfer, A. and Tichy, W. F. (2007). ,”Status of empirical research in software engineering.”, In Empirical Software Engineering Issues, volume 4336/2007, pages 10–19. Springer.
[2] Aggarwal, K.K and Singh, Yogesh “Software Engineering Programs Documentation Operating Procedures (Second Edition)” New Age International Publishers, 2005.
[3] Quadri, S.M.K and Farooq, SU, “Software Testing – Goals, Principles, and Limitations”, International Journal of Computer Applications (0975 – 8887) Volume 6– No.9, September 2010.
[4] Munson, J. C. (2003). “Software Engineering Measurement”. CRC Press, Inc., Boca Raton, FL, USA.
[5] Stark, George E; Durst, Robert C; and Pelnik, Tammy M. “An Evaluation of Software Testing metrics for NASA’s Mission Control Center” 1992.
[6] Fenton, N. E. and Pfleeger, S. L., "Software Metrics: A Rigorous and Practical Approach", 2nd Edition Revised ed. Boston: PWS Publishing, 1997.
[7] Stevens, S. S, "On the Theory of Scales of Measurement", Science, vol. 103, pp. 677-680, 1946.
[8] Stevens, S.S, “Psychophysics: Introduction to its Perceptual, Neural, and Social Prospects“, New York: John Wiley & Sons, 1975. [9] Boehm, Barry w. (1981), “Software Engineering Economics“, Englewood Cliffs, NJ. Prentice Hall.
[10] Farooq, SU and Quadri, S.M.K.,“Effectiveness of Software Testing Techniques on a Measurement Scale“, Oriental Journal of Computer Science & Technology, Vol. 3(1), 109-113 (2010).
[11] Kan, Stephen H, “Metrics and Models In Software Quality Engineering”, PEARSON, 2003
[12] Khelifi, Adel and Abran, Alain, “Software Measurement Standard Etalons: A Design Process”, INTERNATIONAL JOURNAL OF COMPUTERS, Issue 3, Volume 1, 2007
[13] Futrell, Robert T.: Futrell ,Donald F. And Shafer, Linda I., “Quality Software Project Management”, PEARSON [14] Test Metrics, www.chakkilaminc.com
[15] Mills, Everald E, “Software Metrics SEI Curriculum module SEI – CM – 12 – 1.1 , Carnegie Mellon University“, Software engineering Institute, December, 1988.
[16] Torn, Aimo: Professor, Department of Computer Science Abo, Akademi University; Faculty member Turku Centre for Computer Science (TUCS) Turku, Finland.
[17] Kaur, Arvinder; Suri, Bharti and Sharma, Abhilasha,”Software Testing Product Metrics - A Survey”, Proceedings of National Conference on Challenges & Opportunities in Information Technology (COIT-2007) RIMT-IET, Mandi Gobindgarh. March 23, 2007. [18] Ogasawara, Hideto, Yamada, Atsushi and Kojo, Michiko, “Experiences of software Quality Management Using Metrics through Life
cycle”, Proceedings of ICSE-18, 1996.
[19] Pusala, Ramesh “Operational Excellence through efficient Software Testing Metrics” Infosys, 2006.
Problem Reports Number of Software Problem Reports broken down by priority. The Problem Reports Resolved
measure counts the number of software problems reported, listed by priority. Quality
Test Effectiveness Test effectiveness needs to be assessed statistically to determine how well the test data has
exposed defects contained in the product. Quality
Test Efficiency Test Efficiency= (DT/ (DT+DU))*100
Where, DT = Number of valid defects identified during testing.
DU = Number of valid defects identified by user after release of application. The higher the value of this metric, the better is the review efficiency.