1982-2002
by
Zhibin Liu
A thesis submitted in partial fulfilment of the requirements for the degree of Master of Arts in Demography at The Australian National University.
Except where otherwise indicated, this thesis is my own work
ACKNOWLEDGEMENTS
I must acknowledge the debet I owe my supervisor, Dr. A. Gray and my adviser, Dr. L. Ruzicka for their invaluable suggestion and guidance in completing this thesis.
A special expression of gratitude is extended to Dr. D.W. Lucas, Dr. P. Meyer, Dr. P.K. Streatfield, Mrs Chris Mcmurry and Mrs Marian May for their help and sympathetic attitudes during the study.
I would also like to acknowledge my gratitude to Professor Jing-neng Li who was my supervisor in China. His help and guidance is so important for me that I cannot forget it.
I thank my classmates who helped me and made me an enjoyable time during the study.
ABSTRACT
The thesis analyses the current situation of the labour force in China, including its dimensions, composition, structure, distribution and participation patterns. Furthermore, based on this, a projection is made of the future supply of the labour force in China during 1982-2002. The analysis is based mainly on 1982 Population Census data.
CONTENTS
Pages
Acknowledgements... iii
Abstract... iv
List of Tables... vi
List of Figures... viii
CHAPTER ONE 1.0. INTRODUCTION... 1
1.1. Introduction... 1
1.2. Main Objectives and Structure of the Thesis... 2
1.3. Background... 4
1.4. Definition... 7
1.5. Data Sources and Their Limitations ...10
CHAPTER TWO 2.0. CURRENT SITUATION OF LABOUR FORCE IN CHINA... 13
2.1. Dimension, Composition and Growth...13
2.2. Sex-Age-Structure... 22
2.3. Studies of Types of Economic Activies... 28
2.4. Educational Level of the Labour Force...40
CHAPTER THREE 3.0. LABOUR FORCE PARTICIPATION RATES AND THEIR AFFECTING FACTORS... 43
3.1. Introduction... 43
3.2. Age-Specific Participation Rates...45
3.3. Selected Factors Affecting Labour Participation.... 51
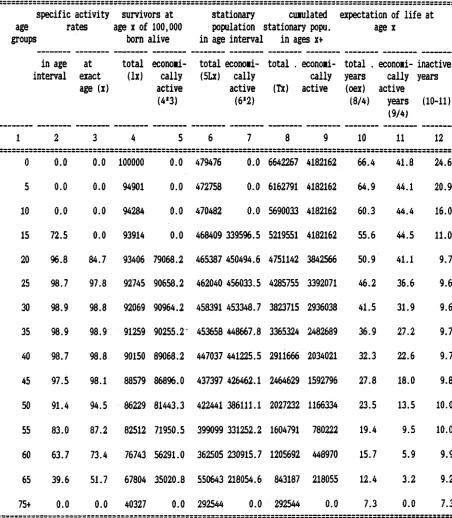
CHAPTER FOURE 4.0. THE TABLES OF ECONOMICALLY ACTIVE LIFE ... 55
4.1. The Tables of Economically Active Life... 55
4.2. The Length of Active Life... 62
4.3. Loss of Active Years by Mortality...65
4.4. Components of Change in Numbers of Economically Active Servivors... 68
4.5. Applications of the Table of Economically Active Life... 72
CHAPTER FIVE 5.0. PROJECTION OF LABOUR SUPPLY... 77
5.1. Introduction... 77
5.2. Assumptions... 79
5.3 Main Findings... 87
Tables Pages 1.1 Comparison Between Census and Statistics
Data on the Labour Force, China, 1982... 12 2.1 Labour Force for Selected Countries
(mid-year figures)... 14 2.2 Labour Force in China (end of year figure)... 17 2.3 Index of Dissimilarity of Sex-Differentials
for Selected Factors in Selected Countries... 24 2.4 Age and Sex Structure of the Labour Force
in China, 1982... 26 2.5 Classifications of Industry and Occupation,
1982 Populaltion Census, China... 30 2.6 Percentage Distribution of Labour Force
by Industry, China, 1982...32 2.7 Percentage Distribution of Labour Force
by Occupation, China, 1982...35 2.3 Percentage Distribution of Labour Force
by Industry and Occupation...38 2.9 Labour Force Distribution by Occupation
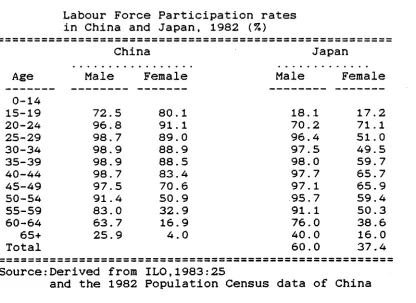
and Educational Level... 41 3.1 Labour Force Participation Rates in
China and Japan, 1982...47 4.1 Abridged Table of Economically Active
Life, Male Population of China, 1982... 56 4.2 Abridged Table of Economically Active
Life, Female Population of China, 1982... 58 4.3 Calculation of Average Remaining Years
of Active Life for Economically Active Survivors at Ages Under Thirty-five Years,
Male Population of China, 1982...64 4.4 Calculation of Average Remaining Years
of Active Life for Economically Active Survivors at Ages Under Thirty-five Years,
Female Population of China, 1982... 64 4.5 Calculation of Gross Years of Active Life
in Ages of Fifteen Years to Seventy-Five Years,
4.6 Calculation of Components of Change in Number of Economically Active Survivors During Five-Years Age Intervals, Table of Economically Active Life, Male Population
of China, 1982... 69 4.7 Calculation of Components of Channge in
Number of Economically Active Survivors During Five-Years Age Intervals, Table of Economicallyt Active Life, Female Population
of China, 1982... 70 4.8 Calculation of Annual Losses From Labour
Force by Death and Retirement and Gains by Entries from the Inactive Population, Male
Population of China, 1982 ... 74 4.9 Calculation of Annual Losses from Labour
Force by Death and Retirement and Gains by Entries from the Inactive Population, Female
Populaltion of China, 1982...75 5.1 Assumptions of Fertility and Mortality,
China, 1982-2002... 80 5.2 Assumptions of Participation Rates,
China, 1982-2002... 83 5.3 Projected Labour Force in China, 1982-2002... 88 5.4 Estimation of the Composition of Labour Force,
China, for Selected Years...93 5.5 Projected Labour Force by Age in China Based
LIST OF FIGURES
Figure Page
2.1 Labour Force in China, 1949-1985...18 2.2 Gross Participation Rate in China, 1949-1985... 18 2.3 Age and Sex Structure, Labour Force
in China, 1982... 27 2.4 Percentage Distribution, Labour Force
in China, 1982... 27 3.1 Participation Rate, Labour Force
in China, 1982... 47 3.2 Participation Rate, Male Labour in China
and Japan, 1982... 50 3.3 Participation Rate, Female Labour
in China and Japan 1982... 50 5.1 Projected Labour Force, Total,
China, 1982-2002... 89 5.2 Projected Labour Force, Males,
China, 1982-2002... 90 5.3 Projected Labour Force, Females,
CHAPTER 1 INTRODUCTION
1.1. INTRODUCTION
It is possible that rich resources can be destroyed or become a heavy burden without scientific management and utilization in the both short and long run. "Rapid economic development in China will entail the efficient use of its resources, including labour" (Orr, 1988:1).
Labour force, as one of the three most important inputs of production, occupies a critical position in the discussion of population growth and economic development. And it has become more and more important in recent years partly due to the extremely excessive supply of labour force which has resulted from the imbalance of rapid population growth from a large base population, and the slow development of economy in the developing countries (Stamper,
China is still a developing country and it has the largest population in the world. Its labour market is characterized by an excess supply of unskilled labour, which is worse than that of any other country, in its current stage of economic development (Orr, 1988:9). This is reflected in several aspects, such as: the existence of large underemployment, estimated at about one-third of total labour in rural areas, while unemployment is low (Feng:1985); predominance of agricultural labour in the total labour supply; low productivity in both agricultural and non-agricultural sectors (Orr, 1988:1).
Although China's government has been forced to implement a strict birth control policy to limit the rapid population growth, the working age population— the source of labour force--will still increase quickly at least in the period from 1982 to 2002 because of the high natural growth rate of population in the past. There is no choice for the Chinese government but to design reasonable economic and employment policies to take up the large labour pool, both current and future. Therefore, it is necessary for policy makers to estimate and analyse the labour supply including its growth, composition, distribution among categories of economic activities, and factors which influence these characteristics of manpower. This is the main aim of the thesis.
1.2 MAIN OBJECTIVES AND STRUCTURE OF THE THESIS
only a few studies about it have been done so far while a lot of demographic research has been done. This is partly due to unavailability of data. This thesis is written within an overall framework which would set out parameters of a solution to managing and utilizing the huge human resource in China through the study of both supply of and demand for labour. In this study, it is proposed to complete the first step, a study of labour supply. More specifically, the purposes of the thesis are:
(1) analyzing the current situation of labour including participation rates and finding out the trends of labour participation;
(2) projecting the labour force in China in the period from 1982 to 2002.
1.3 BASIC BACKGROUND
Before going to the studies of labour force, it is necessary to discuss some basic characteristics of the condition of China influencing the labour force, such as its geographic, economic, social and demographic conditions.
(1). Geographic Background
China is characterized by a large geographic area and high density of population. The territory of China is about 9.6 million square km, about 7 percent of the total dry land area of the world, while there were 1015 million people in 1982, constituting 22 per cent of world population. The density of population is about 107 people/square km, which is more than three times higher than the average density of population of the world while it is lower than some areas such as, middle-south Asia (145), Western Europe (154) (PRC.CASS, 1985:1119).
only 975,280 square km in 1982, about 10 per cent of the total area of China. Arable land per capita is only 0.1 hectare. This is only one-eighth of that of the Soviet Union or USA while it is close to that of Japan (0.08) and double that of South Korea (PRC.CASS, 1985:1190).
circumstances but also from the centralized economic system, and autocratical political system and corresponding policies, particularly the negative policy of limiting the mobility of population and labour force. In recent years, the government has paid more and more attention to it, but without action having been taken (Hu, 1985:276-282).
(2) . Economic Background
China is a less developed country with GNP (Gross National Production) in 1983 equivalent to US$ 236,344.3 million, ranged at the 9th in the world. That is about 22 per cent of GNP of Japan in 1982 ($1,062,866,9) and 7.3 per cent of GNP of the United States in 1983 ($3,256,500). Because China has the largest population in the world, GNP per capita is only US$ 230, ranged at 114th among 124 countries in the world. It is 2.6 per cent of that of Japan ($8973.1) and 1.7 per cent of that of the United States ($13887). All those figures indicate the weak national strength and low level of living standard of people (PRC.CASS, 1985:1167-1172). The combination of backward economy with big population makes development of China more difficult. Although the Chinese government has conducted a series of economic reforms and has made some achievement, major change of the current situation cannot be expected in the near future.
(3) . Demographic Background
about 542 million in 1949 and it increased to 1015 million in 1982. In only about 30 years it has nearly doubled. The proportion .of China's population in the world total population has remained for some time at about 22 per cent and is the largest population in the world (Liu, 1985:186). From the 1970s a strict population control policy has been conducted to lower the population growth and some achievements have been made. The natural growth rate decreased from 25.6 per thousand on average in the period 1962 to 1973 to 14.5 in 1982 and 10.8 in 1984 (PRC.CASS, 1985:851). But, due to the huge base population and population momentum, the total population will still increase growth quickly at least in next two decades.
China's population has many other features, like uneven distribution, young age structure, aging of population and so on. All of those, to different extent, will affect the labour supply in China, and they are going to be discussed in later chapters (Hu: 1985; Jiang and Zhu:1985; Yao:1985).
1.4. DEFINITIONS
1962:1), and even the same definitions may use different words.
According to internationally recommended standards, the term ’labour force' or 'economically active population’ refers to the total number of persons who want employment, whether or not their wish is satisfied (UN, 1971:5). That means the labour force comprises both employed persons and those seeking employment, or job seekers (UN, 1968:3).
The category of employed persons should comprise both full-time and part-time workers, while the unemployment should be defined (with some exceptions) as persons who are not at work and are seeking work for pay or profit during the period of reference. On the other hand, the category of persons not in the labour force (economically inactive population) should comprise persons engaged only in activities which do not contribute directly to the production of economic goods and services. This definition is used here while a different definition of labour force, an equivalent of employed people, used to be used in China. However, the previous use of "labour force" may cause some confusion and difficulties in practice, in interpreting official statistics.
are usually 55 years for females and 60 years for males in china, but they apply mainly to urban employment. The available data of age-sex-specific participation rates are for people aged 15 to 65 (L I ,1987:15-18).
The minimum working time which qualifies a person as a member of the labour force or economically active population, is subject to different standards in different countries. In the 1982 Population Census in China, the category of employed people referred to those who had a regular occupation when they were interviewed and those who had not a regular occupation but did 16 days or more casual work in the previous month (June) (Li, 1985:165).
Defining ’’unemployed people seeking employment” or job seekers is complicated too. It is probably easy to identify some people who are looking for job actively while it is difficult to identify the people who want jobs passively due to limited employment opportunity. The data on unemployed people seeking employment is only available for urban young people, so-called ’’young people waiting for jobs” , or young job seekers actually. Nevertheless, the over-supply of labour force in China exists prominently as underemployment but not unemployment.
despite the fact that an increasing number of them also undertake some supplementary work.
There is no clear-cut line between household chores and economic activity, particularly in a subsistence economy where the family is a basic production unit, such as in China now (UN, 1962:2). People (usually women) whose only work is keeping house are usually excluded from the labour force.
1.5 DATA SOURCE AND LIMITATION
The published data of the 1982 Population Census, in Almanac of China's population (PRC.CASS, 1985) and statistics on labour and wage (SSD.NSB, 1985) are the main sources for this study while some other data published in related books or on papers will be used too. However, given availability of Chinese statistics, empirical work on many aspects encounters difficulties and limitation with data. Therefore, some modification, adjustment and substitution probably are necessary (Orr, 1988:1).
Several limitations have been observed in the data for this thesis, although they are not so serious.
unavailable and both the depth and scope of this study are consequently limited. For example, due to the lack of age-sex specific participation rates by residence (urban and rural), the labour force projections can only be based on the whole country but not on urban and rural areas separately, although great difference between urban and rural participation exist. The age-sex participation rates for people aged over 65 have to be calculated by indirect methods because of the absence of these data. Missing data about job seekers may slightly understate the total number of the labour force in rural areas. •
Age-misreporting is a common problem in population censuses and surveys. The causes of age-misreporting in the 1982 Population Census of China are as follows: low educational level and the use of two kinds of calendar might induce unintentional age-misreporting. The stipulations of minimum marriage age and maximum age to enter advanced education cause deliberate age misreporting. Young people may over-report their age for getting married earlier and under-report their age for going to university. However, although the data suffer from these limitations of age-misreporting, they are still good enough for this thesis. According to calculations, Whipples index is 103.47, Myer's index is 3.00 and the UN index is 26.78. Ail of them show that the data are very reliable (Li, 1935:171).
some individual businessmen are still reluctant to report their real occupations but state they were unemployed instead when they ware interviewed. Another reason for their doing this is to evade paying taxes. In addition, problems may arise from misreporting between housewives and self-employed labour.
The 1982 Population Census was conducted in the peak agricultural season. In addition, there was more than 80 per cent of the labour force engaged in agriculture. While the peak season might result in the overstatement of employment, the timing may have been advantageous for estimating labour force supply. The problem can be shown by the comparison between census data and statistical data for employment in 1982 in the following table.
It can be seen that virtually all the over-statement of employment activity in the census occurred in rural areas, consistent with the supposition that it was due to harvest activity.
Table 1.1
Comparison Between Census And Statistics Data On The Labour Force, China, 1982
employment (10,000) census statistics difference % (June) (end 1982)
total 52,150.5 44,706 +16.65
urban 11,432.1 11,428 + o o sf
rural 40,718.4 33,278 +22.36
CHAPTER 2
CURRENT SITUATION OF THE LABOUR FORCE
The labour force provided by a population census can be viewed as an inventory of a nation's supply of labour engaged in or available for income-producing activities. Based on it, not only can the knowledge of dimension and age-sex-structure of the labour force be obtained, but the
types of economic activity also. These are the issues of
this chapter.
2.1 DIMENSION, COMPOSITION AND GROWTH
The size of the total labour force is one of the most
important indicators of demography and economy. It is
determined by the size of population, population age
structure and the labour force participation rates. It is
well known that China has a huge population with young age
structure. Besides, labour force participation rates are
very high in China (as will be shown later) due to the
predominant agricultural and centrally-planned economy.
According to the 1982 Population Census, the size of the
labour force was about 524.9 million while total population
size was more than 1000 million. China had plentiful
labour in terms of quantity.
However, the labour force comprises basically two
parts, one the employed and the other unemployed. Exactly
speaking, the labour force may be seen as only potential
producers. They are not real producers unless they are
II II II
1
l cs ▼H <N in
II II II
II P l CO co CO CD II
II 05 l cr> O' a i O' II
II 0 1 H rH tH rH II
II >h
II II 1 1 1 II II II II II II II
05 II II
OJ II II
P II II
3 II II
W II II
•H II II
4h II II
P
II
II 1
II II
03 II II 1 Pn O ' '3- 03 II
OJ M II frS 1 • . . II
>» II II 1 o i£> CS II
1 II -P II 05 1 II
T3 II C II -P l II
•H II (1) II 03 1 II
S II E II 05 1 II
■—• II >» II II
II O II 1 II
CQ II rH II P 1 O' i£> II
0) ii a II 0) 1 . . II
•H II E II H 1 on iO tH o II
P il 0) II E 1 rH II
-P II C II 3 1 II
c II 3 II 2 1 It
□ II II 1 II
0 II II II
tH o II
II II
CS 73 II
II IIII
0) II II
111 -P II II
rH O II C II
A Q ) II 0 II
m rH II -H II
H 05 II -P ll
W II 03 1 II
ii a e-s 1 O' CO <N II
c II -H 1 • . . • II
•H II Ü 05 1 tH in CO o II
II 05 -H -P 1 in on sr in II
II 73 -P 03 1 II
C ii 3 p as 1 II rH
0 II P 03 1 II p '
•H ii o a II m
rH II 1 II ..
pH II 1 m in p* cs II p^
•H II p 1 • • . • II cs sr
e II rH 3 0) 1 tH sr Pv Pv II m
v—/ II 03 0 Ü 1 <N m II CS ■- «n
II -P X5 P 1 un <N II tH on ••
05 II 0 03 0 1 II sr in
0 II H J Eh 1 II . . co
P II II m O O'
0 II 1 II <N CO rH
tH II 1 O' on m o II ■. ..
II 1 1 • • • II on ■n cn
p II 03 1 on in ao CN II CO co i n
3 II H H 1 o iD tH tH II 03 O' <
0 II 03 3 C 1 o iD tH II tH tH Ü
X l u p a o 1 tH II
ITJ II 0 0 -H 1 II o o u
J ii h a p II j as
ii 1 03 II w M QU
ii 1 •H II
ii >> 1 rH II • •
ii p 1 03 II 05
ii -p 1 03 03 c P II O
II c 1 C •H 03 -P II P
II 3 1 •H 73 a U3 II 3
II 0 1 C 03 3 II O
they are employed. An extraordinary feature of China' 3 labour force is that nearly all are in employment while only 3.4 million, that is 0.7 per cent, are unemployed. The unemployment rate is probably one of the lowest in the world; it is only 3 per cent of the largest one (22.8 per cent) in Puerto Rico in 1982 , and one-eleventh of that of Australia in 1985 (7.4 per cent) (ILO, 1983:23,25,411,417). Absolutely speaking, the total number unemployed in China is only 3.4 million in 1982, that is only 20 per cent of that in India in 1981 (16.9 million). Besides the still rather backward subsistence economy, the economic system and the ideology on which the employment policy is based are the main reasons for the above-mentioned phenomenon. China's Communist Party following Marxism believes that there should be no unemployment in socialist society; unemployment is only related to capitalist society. Therefore a policy of full employment with low productivity and low salary was practised in China, at least until the early 1980s.
is an urgent task for China to find a solution for this underemployment, particularly in rural areas.
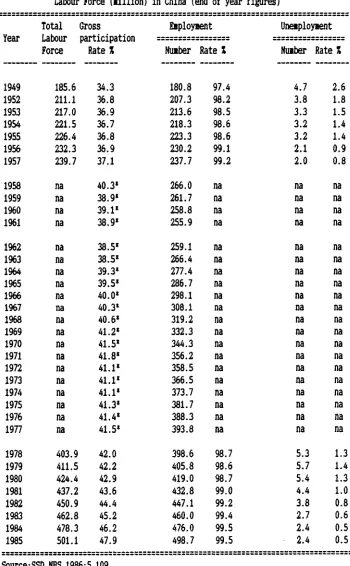
Another point to be mentioned here is change in the size of China's labour force between 1949 and 1985. Since there are no census data available except in 1982, published labour force statistics will be used here (Table 2.2). The definition of labour force in these statistics is the equivalent of labour aged 15-54 for female and 15-59 for males. It is different from the definition used in this thesis. Also, only the employment data but no unemployment figures are available for the period from 1958 to 1977. Despite those limitations the data are valid for observing the trends in labour force over time.
Labour Force (llllion) in China (end of year figures)
Year
Total Labour
Gross
participation
Eiployuent Une*ploy*ent
Force Rate X Nuiber Rate X Nuiber Rate X
1949 185.6 34.3 180.8 97.4 4.7 2.6
1952 211.1 36.8 207.3 98.2 3.8 1.8
1953 217.0 36.9 213.6 98.5 3.3 1.5
1954 221.5 36.7 218.3 98.6 3.2 1.4
1955 226.4 36.8 223.3 98.6 3.2 1.4
1956 232.3 36.9 230.2 99.1 2.1 0.9
1957 239.7 37.1 237.7 99.2 2.0 0.8
1958 na 40.3* 266.0 na na na
1959 na 38.9* 261.7 na na na
1960 na 39.1* 258.8 na na na
1961 na 38.9* 255.9 na na na
1962 na 38.5* 259.1 na na na
1963 na 38.5* 266.4 na na na
1964 na 39.3* 277.4 na na na
1965 na 39.5* 286.7 na na na
1966 na 40.0* 298.1 na na na
1967 na 40.3* 308.1 na na na
1968 na 40.6* 319.2 na na na
1969 na 41.2* 332.3 na na na
1970 na 41.5* 344.3 na na na
1971 na 41.8* 356.2 na na na
1972 na 41.1* 358.5 na na na
1973 na 41.1* 366.5 na na na
1974 na 41.1* 373.7 na na na
1975 na 41.3* 381.7 na na na
1976 na 41.4* 388.3 na na na
1977 na 41.5* 393.8 na na na
1978 403.9 42.0 398.6 98.7 5.3 1.3
1979 411.5 42.2 405.8 98.6 5.7 1.4
1980 424.4 42.9 419.0 98.7 5.4 1.3
1981 437.2 43.6 432.8 99.0 4.4 1.0
1982 450.9 44.4 447.1 99.2 3.8 0.8
1983 462.8 45.2 460.0 99.4 2.7 0.6
1984 478.3 46.2 476.0 99.5 2.4 0.5
1985 501.1 47.9 498.7 99.5 2.4 0.5
Source:SSD.NBS,1986:5,109
[image:25.550.102.452.127.693.2]P
e
rc
e
n
ta
g
e
P
c
tn
ts
N
u
m
o
e
r
o
f
"
h
o
L
a
to
u
r
F
o
t
s
(m
ll
ll
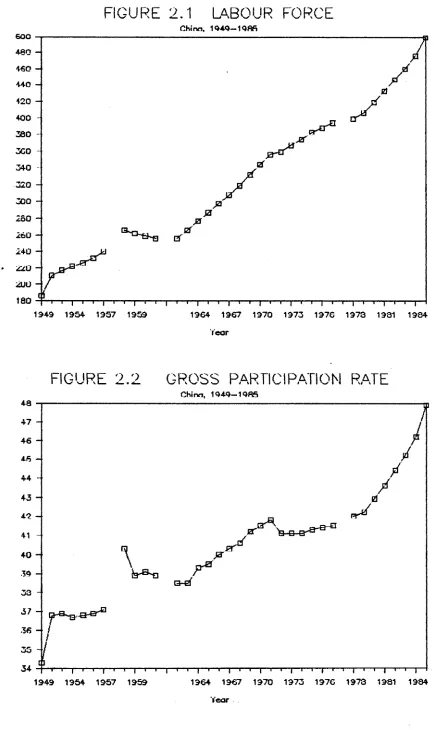
FIGURE 2.1
LABOUR FORCE
Chinn, 1 9 4 9 - 1 9 8 5
46 0 440
-420
-400 3 8 0 3C0 -3 4 0
3 0 0 2 5 0
Z 2 U
-19 4 9 19 5 4 19 57 1959 19C4 19 67 19 70 1973 197C 19 70 1931 1904
Year
FIGURE 2 .2
GROSS PARTICIPATION RATE
Chinn, 1 9 4 9 - 1 9 8 5
4 7
4 6
-44 -■
4 3
-4?
4 0
-39
3 3
3 7
-.36
-3 5 - i
19 6 4 1967 1970 19 73 19 76 19 73 1981 1934
19 49 19 5 4 19 5 7 19 59
[image:26.550.52.486.56.786.2]For reviewing the changing course in labour force, the 1949-1935 period can be divided into four segments: 1949 to 1957, 1958 to 1961, 1962 to 1977 and 1978 to 1985.
The highest growth rate of the labour force is found in the first period, 1949-1957. During this period, the average annual growth rate of labour was 3.3 per cent and the crude participation rate increased by 0.5 percentage points each year. Both figures were mainly affected by economic and political factors. In 1949, the Communist Party took power in China and a socialist society characterized by a centralized economy established gradually during this period. The full employment policy began to be implemented. At the same time, the government encouraged people to participate in economic activities in order to reconstruct the country which had been destroyed by war before 1949. So the demand for labour pushed more and more people to enter the labour force, especialy women. Additionally, many soldiers withdrew from the army and joined the labour force. This was an important reason for the fast growth of the labour force and of the crude participation rate in this period.
Another important characteristic is the high unemployment rate and its fast decline in the first period.
The second period is an unusual one. Not only did total workers (employed) decline from 1958 to 1961 but the crude participation rate did also. This is because of the 'great leap forward’ movement in 1958, in which the Communist Party called for all people to join in production, and, for a variety of reasons, the national economy suffered an extreme disaster. Although from 1959 China's government began to readjust its policy, the national economy continued worsening and this resulted in the most difficult period in China's recent history due firstly to the 'great leap forward' but also to natural disasters in this period (Kane,1988). However, despite these set-backs the labour force and crude participation rates were still higher than during the first period.
From 1978, an economic reform characterized by decentralization has been carried out in China. However this reform could not change the centralized economy into a free market economy completely. The centralized economy always occupies a predominant position in a socialist economy, even though some small individual businesses have been established due to the relaxation of control of individual economic activities. Some enterprising people who have special skills entered into or re-entered the labour force. The responsibility system in rural areas makes the family a unit of production. The members of a
family who had been dependents before may now join the self-employed labour force. As Table 2.2 shown, the total labour force grew by 13.9 million annually from 1978 to 1985, on average,- the average growth rate of labour force has been about 3.1 per cent per year in the fourth period, that is higher than that in the third period. In addition, the crude participation rate increased by 5.7 per cent in this period. The growth of population also contributed to the growth of labour force. Additionally, about one million soldiers were released in this period according to statements of the Chinese government and some of them entered into the labour force,- this is another reason for the fast growth of labour force in this period. (As defined in China, servicemen are not a part of the labour force).
this unemployment was a left-over from previous periods (or from the cultural revolution) and resulted from the return of educated young people who were sent to rural and mountain areas before. From 1981 unemployment decreased quickly to 2.4 million and the rate was reduced to only 0.5 per cent in 1984 and 1985. It can be said that nearly all the labour force was employed in 1984 and 1985.
In short, although unemployment fluctuated between 1949 and 1984, it has been always low compared with other countries in the world. Even if the definitions in China were different, this conclusion is not affected markedly.
2.2 SEX-AGE-STRUCTURE
The purpose of analysing census data on the labour
force is not merely to measure its size, composition
(employment and unemployment) and growth, but also to gain knowledge of its structure and distribution. This section sets out the sex and age structure of the labour force in China based on the 1982 Population Census Data.
A. Sex-structure and differentials
Due to differences of a physiologically intrinsic nature and social status between males and f e m a l e s , the
male and female labour force play different roles in
economic as well as social activities. In terms of the
labour force, this can be reflected by the pattern and
Generally speaking, the male labour force is larger than the female labour force in China as in almost all other countries. There were about 295 million male labour force and 230 million female labour force in China in 1982. They accounted for 56 and 44 percent of the total labour force respectively. However, the proportion of female labour force in the total labour force in China is ranged at the highest position in the world ( ILO, 1983, 1986).
It is more interesting to thoroughly analyse sex differentials taking the age, industry, occupation and province into account. This work has been done by Naohiro Ogawa and Yasuhiko stito (1987). So this thesis only briefly repeats some findings in this section and some other sections.
Based on the sex-specific percentage distribution of labour force as viewed from selected factors such as industry, occupation, province and age, Naohiro Ogawa and Yasuhiko Stito measured the degree of sex differentials by each of these factors using the index of dissimilarity, which is a summary measure of the total amount of difference between two percentage based distributions, as a main analytical tool. According to their results, they found
A
I n d e x o f Diss im il ar it y o f Sex -differentials f o r Sel ec te d F a c t o r s i n Se l e c t e d Countries p •H P iH 03 P •H S •H W W •H Q P O X 0 -O c M c o •H p 03 a 3 o o o >> p p M D T3 C M co tH o' 01 O 0 01 O
w CO
0 00 < CO Iß 01 CO 01 tH 01 rH rH co 01 CO O' O CO CO CO
01 vDcs
CO
O' in
▼H CO01
p 01 tH 0 co 0 0 tH 0 co
03 00 CO GO CO CO in (X)
0 O' O' O' O' O' O' O' O' O'
>- tH tH tH tH tH tH tH tH tH
o
M U3 P P 0
0 ^
X P
P O O 3 3
1—1
fN
CO O'
rH U)
- C 03 03
3 0
03 g
DO : w
ti 03 DO 0 03 II O :
it ■H T3 03 C O 03 p p II p
11 > P C •H 0 •H 0 0 03 II *•r
11 p 03 03 W 5* P P a 0 II 0
11 -p 03 01 c P rH > A O 03 N II Ü ••
11 c C •H 03 P •H 03 DO 3 5* DO II P 0
11 3 •H -O a m 03 P C a c 3 II 3 P
11 O -C c 03 3 x : 03 0 0 p •H 0 II O O
11 O 0 w n < H 2 X x 0 cn X crt x
One is the centrally-planned economy, another is the predominant size of the agricultural industry measured in terms of the number of workers. After removing the size effect of workers in the agricultural industry from their composition, however, considerably large sex differentials were observed. For instance, the index of dissimilarity increases from 8.01 including agriculture to 20.02 excluding agriculture.
B. Age-structure
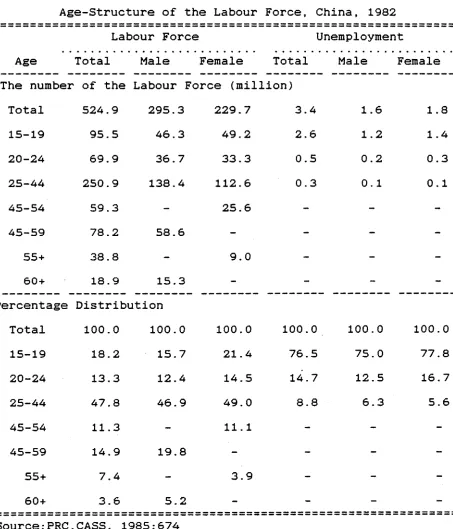
Table 2.4
Age-Structure of the Labour Force, China, 1982
Labour Force Unemployment
Age
The number
Total of the
Male Female Total Labour Force (million)
Male Female
Total 524.9 295.3 229.7 3.4 1.6 1.8
15-19 95.5 46.3 49.2 2.6 1.2 1.4
20-24 69.9 36.7 33.3 0.5 0.2 0.3
25-44 250.9 138.4 112.6 0.3 0.1 0.1
45-54 59.3 - 25.6 - -
-45-59 78.2 58.6 - - -
-55 + 38.8 - 9.0 - -
-60 + Percentage
18.9 15.3 Distribution
— —
Total 100.0 100.0 100.0 100.0 100.0 100.0
15-19 18.2 15.7 21.4 76.5 75.0 77.8
20-24 13.3 12.4 14.5 14.7 12.5 16.7
25-44 47.8 46.9 49.0 8.8 6.3 5.6
45-54 11.3 - 11.1 - -
-45-59 14.9 19.8 - - -
-55 + 7.4 - 3.9 - -
-60 + 3.6 5.2 - - -
-Source:PRC.CASS, 1985:674
[image:34.550.57.510.156.685.2]P
e
r
c
e
n
ta
g
e
P
o
in
t
N
u
m
o
e
r
o
f
T
h
e
L
a
to
u
r
F
o
rc
e
(m
il
ll
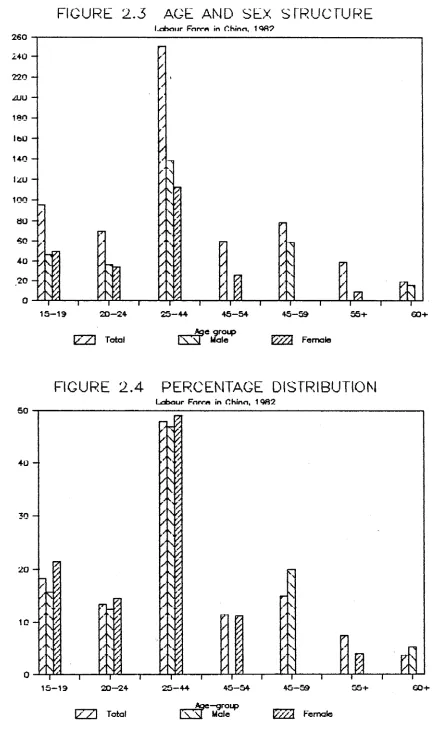
FIGURE 2 .3
AGE AND SEX STRUCTURE
Lriviijr Fnrc« in Chinn, 10R9
240 ~
220
-1«0
IbU
-140
-100
-40
20
-2 0 --2 4 2 0 -4 4 4 5-54
_____ .Age g ro u p _____
lx / \ T otal | ' \ ' \ j Male t‘/ / / A Fem ale
FIGURE 2 .4
PERCENTAGE DISTRIBUTION
L-iour Form in Chinn, 19ft2
40
-30
-2 0
-45-54
2 0 -2 4 2 5 -4 4
, JL .Age - g r o u p jr , , „
[image:35.550.55.490.57.803.2]following characteristics can be inferred from these figures.
First, both the male and female labour force had young age structures in 1982. About one-third of the male labour force and more than one-third of female labour were in age groups 15-19 and 20-24. There were about 95 percent of male labour force aged under 60 years and 96 per cent of female labour force aged under 55 years.
Second, the age structure of the labour force is younger for females than that for males. In those age groups between 15-19 and 25-44, particularly in age group 15-19, the percentage points are higher for females than for males. By contrast, the percentage points in age groups over 45 years old are lower for females than for males. This suggests that females entered and separated from the labour force earlier than males in China.
2.3. Types of economic activities
the qualities of manpower, raising productivity and minimizing unemployment and underemployment.
There are usually three primary classifications of workers used for studies of the types of economic activity. They are industry (the activity of the establishment or enterprise in which the individual works), occupation (the kind of work done by the individual) and status (as employer, employee and so on) (UN, 1968:64). In the present case, however, status is not clear in China due to the fact that China is a socialist country. Therefore, status will be omitted in the discussion here. In addition, due to the classification of industry and occupation varying from one country to another, international comparison is difficult.
Classifications of Industry and Occupation 1982 Population Census, China
Industry
Agriculture, hunting, forestry and fishing Mining and limbering
Electricity, gas, and water supply Manufacturing
Geological exploration Construction
Transport and coounication
Wholesale/retail trade, restaurants, hotels and storage
Real estate, business services and public utilities
Public health services
Educational and cultural services Natural and social science and general technical services Finance and insurance
National organization, coiaunist party and political groups Activities not adequately defined
Occupation
Professional and technical workers Adiinistrative and Managerial workers Clerical workers
Service workers
Agricultural and aniial husbandry
and forestry workers, fisheries and hunters Production-related workers, transport equipient operators and labourers Workers not classifiable by occupation
division of financing, insurance, real estate and business services.
Public health services, educational and cultural services, natural and social science, and general technical services and national organization, communist party and political groups are merged into one division--community, social and personal services. Other divisions have not been changed. The classification of occupation is unchanged.
A. Industrial distribution
The industrial distribution of the labour force is an indicator of not only the level of economic development but also the quality of the labour force in a nation. Meanwhile, the studies of the current situation of the industrial distribution of the labour force, along with empirical knowledge of change of the industrial distribution of the labour force in the developed countries together, some inferences for the trends of this distribution in the future may be drawn.
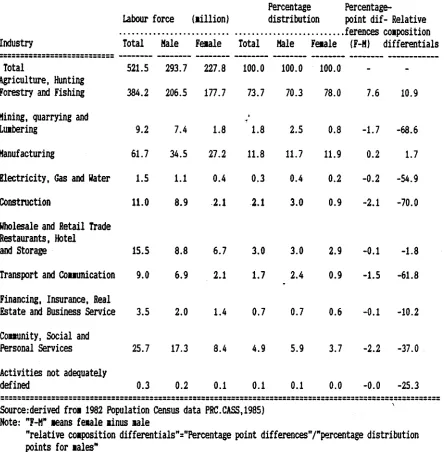
Derived from 1982 Population Census data, the percentage industrial distribution of the labour force is illustrated in Table 2.6. By drawing upon the figures in table 2.6, the following observation can be made.
China had an agriculture-oriented economy with about 73.7 per cent of the labour force engaged in agriculture. As one of the most widely used indicators of socio-economic development is the proportionate share of non-agricultural industries in the labour force, it is necessary for China's
Table 2.6
Percentage Distribution of Labour Force By Industry, China, 1982
Percentage
Percentage-Industry
Labour force Total Male
(million) Female Total
distribution Male Female
point dif- Relative ferences composition
(F-M) differentials
Total 521.5 293.7 227.8 100.0 100.0 100.0
-Agriculture, Hunting
Forestry and Fishing 384.2 206.5 177.7 73.7 70.3 78.0 7.6 10.9 Mining, quarrying and
Lumbering 9.2 7.4 1.8 1.8 2.5 0.8 -1.7 -68.6
Manufacturing 61.7 34.5 27.2 11.8 11.7 11.9 0.2 1.7
Electricity, Gas and Hater 1.5 1.1 0.4 0.3 0.4 0.2 -0.2 -54.9
Construction 11.0 8.9 2.1 2.1 3.0 0.9 -2.1 -70.0
Wholesale and Retail Trade Restaurants, Hotel
and Storage 15.5 8.8 6.7 3.0 3.0 2.9 -0.1 -1.8
Transport and Communication 9.0 6.9 2.1 1.7 2.4 0.9 -1.5 -61.8 Financing, Insurance, Real
Estate and Business Service 3.5 2.0 1.4 0.7 0.7 0.6 -0.1 -10.2 Community, Social and
Personal Services 25.7 17.3 8.4 4.9 5.9 3.7 -2.2 -37.0
Activities not adequately
defined 0.3 0.2 0.1 0.1 0.1 0.0 -0.0 -25.3
Source rderived fro« 1982 Population Census data PRC.CASS,1985) Note: "F-M" «eans female sinus aale
the labour force from agriculture to non-agricultural employments. This would accelerate the growth of output per capita and may be an aid in coping with underemployment in agriculture (UN, 1968:65-67).
If the non-agricultural industries are subdivided into a manufacturing, mining and construction sector ("M” sector) and a services sector ("S" sector) including all other non-agricultural industries, a three-sector classification is formed (UN, 1968:67).
Studies have found that a relative contraction in the share of agriculture and expansion in the share of the M sector are common phenomena in the course of economic development (UN, 1968:67). The computed results based on Table 2.6 reveal that about 15.7 per cent and 10.6 per cent of the labour force were in M sector and S sector, respectively. Both of them are far smaller than the percentage share of the labour force in the agricultural sector. With the development of the economy, the transfer of the labour force from agriculture to M sector is expected and also necessary in China.
services industries are only 3.0 and 1.7 per cent respectively in China. China's government should probably pay more attention to the development of these two service industries.
Third, the percentage share for females is higher than that for males in agriculture while a converse conclusion is found in all other divisions. This is probably evidence for the hypothesis that women were often assigned to underdeveloped labour-intensive sectors of the economy (Ogawa, 1987:2). In addition, mainly due to the physiological reasons, the percentage shares in mining, construction and transport divisions are much higher for males than for females.
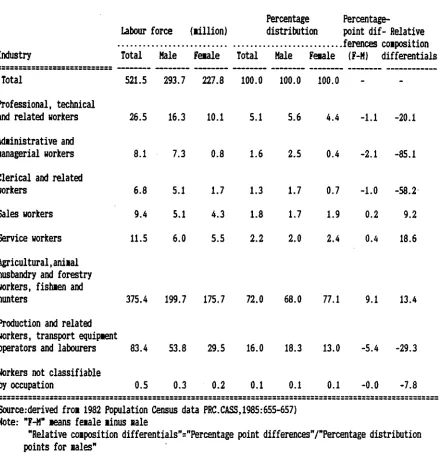
B. Occupational Distribution
Like the distribution of industries, the occupational distribution may also be used as a indicator of the economic development of a country. So far as assessing development needs in the educational system, vocational training and rehabilitation programmes is concerned, the study of occupational distribution is helpful to the planners. Additionally this study also provides a foundation for calibrating labour force supply and demand in the different occupational categories (UN, 1968:68-70).
Table 2.7
Percentage Distribution of Labour Force By Occupation, China, 1982
Percentage
Percentage-Labour force (iillion ) distribution point dif- Relative
Industry Total Male Fetale Total Male Fetale
leraiuss uuapusiuun
(F-M) differentials
Total 521.5 293.7 227.8 100.0 100.0 100.0 -
-Professional, technical
and related workers 26.5 16.3 10.1 5.1 5.6 4.4 -1.1 -20.1
Adtinistrative and
tanagerial workers 8.1 7.3 0.8 1.6 2.5 0.4 -2.1 -85.1
Clerical and related
workers 6.8 5.1 1.7 1.3 1.7 0.7 -1.0 -58.2
Sales workers 9.4 5.1 4.3 1.8 1.7 1.9 0.2 9.2
Service workers 11.5 6.0 5.5 2.2 2.0 2.4 0.4 18.6
Agricultural,anital husbandry and forestry workers, fishten and
hunters 375.4 199.7 175.7 72.0 68.0 77.1 9.1 13.4
Production and related workers, transport equiptent
operators and labourers 83.4 53.8 29.5 16.0 18.3 13.0 -5.4 -29.3
Workers not classifiable
by occupation 0.5 0.3 0.2 0.1 0.1 0.1 -0.0 -7.8
Source .-derived froi 1982 Population Census data PRC. CASS, 1985 .-655-657) Note.- "F-M" aeans fetale linus sale
[image:43.550.60.503.229.691.2]First, as the main producers, agricultural workers make up about 72.0 per cent of the total labour force. This implies a backward economy and the low level of the quality or the labour force because agricultural workers usually have less education and use backward modes of production in China.
Second, the professional and technical workers usually are the people who have got more training or have special talents and therefore, they usually perform more productive functions. However, they make up quite a small part of the labour force of China (about 5 per cent). The administrative and managerial workers who are usually recognized as decision makers play an important role in both economy and society. Unfortunately, many of them are not well qualified in China, partly due to the socialist system of China. The share of the labour force in this occupation group is smaller than for the occupation of professional and technical workers. The workers in the above two occupations with clerical workers together comprise the so called ’’white collar” workers (UN, 1968:70-71). There were about 9.7 per cent of the labour force who were white collar workers in China in 1982. According to previous studies (UN, 1968:70), the expansion of white collar workers, particularly within the major groups which reflects the increasing complexity of technology and economic organization, is possible and essential as economic development progresses.
transport equipment operators and labourers. People belonging to this occupation are production or manual workers, similar to the blue collar workers of capitalist society (UN, 1968:70). The labour force of China has been shifting and will continue to shift from agricultural occupations to this occupation group as well as to other non-agricultural occupations.
Last, the percentage shares of female labour force are higher than for males in occupations of sales workers, service workers and particularly, agricultural workers, while for all other occupations male workers exceed female workers relatively as well as absolutely. Fewer women are decision makers and professional and technical workers
partly due to less education and lower social status.
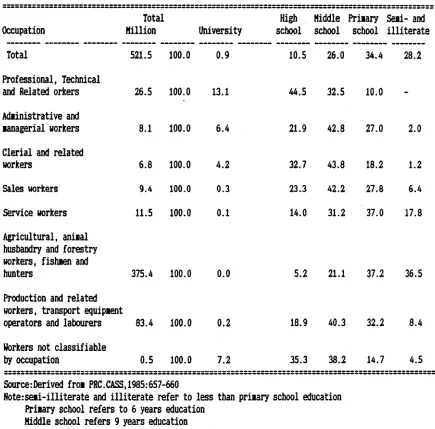
C. Cross-classification of industry and occupation.
In d u st ri e s an d O cc ui i» II jj II 4 4 II O JI e
II CO
II f-
tl OJ
II
o
'S
Q .O
I«
t* 4
ao CS 3
dl 5
—H (T3
-Q «—3 ra
I— d>
•^H s to ■ H & CO O) s £ •3CO «3 £ o 's t: s a
a £
3 "3a . o 8
2 I ä
a
C rtJ
«3 >. •3 I £ CU
= I
ai -o
3 "O sr a
£ CU
11
3 'Soo no«c « 8
■ co iu c-a> tu
>C 4U
. CO
O U-* <*4
o • £ 4 £
di
jt
jj Ij
jj -1-4
11 °
Jj II JI Jj Jj Ij II
jj <=>
II <sD
II -H Jj II II jj jj jj jj Jj O
II 0 3
it 11
co j p
co
s iS
I— I t-,
03 O CO 3
<— < CO
no (-■
O O) •1-C -M C_ a CU O
£ 4 *
a £<T» d>
| 1
ra »-H fr* ra 4-> *rH
co fr* • g
• g T g
’Sco CU
< * 1 £
0 3
ao -h
*-h <=>
jj jj jj jj jj jj jj
!! cn
:: 11 11 11 n 11 I« ii ji 11 03 11 4*4 ao II
an
SO - 4
on < 3 on <3 cs <3 on 3 on CD
—I -X»
CT* vO CSao
Ln 2
CT*
un
un un »-4 un
ST CD —H CD
un on p-.
r - i un on
■<-4 4-4 4-1 sO - 4 cs —« <3
xy 4-4 p^ cs
on cs >» cs
1— <3 p-. co cs 4» sy cs CT* ad co <3 on ad co c«! ao 4—4 CT* on
0 0 —H
on Li-i <3
un -r->
SD sy
un cs <3 CS cd vO SO ao ——*
—4 II ra 11 s-H .2 ss ud J§ !!
8 SS 4-»
r«. un on 4-4 0 un ao r^. on
<3 00 vO CD I-C ad SD socs CT*
un
!• 0 0 <3 <3 3 0 <3 <3 0 3
T
o
ta
l
10
0. 0 g> g CDO 0 g O <33 g
4-4 4—4 4—4 4-4 4*-* 1-1 4—* 4—4 4—4
jj JI «1
jj 8? »P "O03
8 ta 3 a CU a >-4 g •*u 0 •H 3 8 03 •<“! <u > as
s-- Ä
8 ca ara
ftt •~4 -r4 4-1 -C g •*-l
1CT- W3
03 4-» Cro —H D a e ca ca cu iH CO
ca cd
•rH O 1 £ ^ di 4-> »-H
In d u st ry T o ta l
c ca £ £
aT a t_ no 5 »
•rH ca no 3 ►» •44 g •j-4 0 CU OS -0 nö 4-» a
5c ca a
03 a
6 aro
4-1
(-> G
3 -<-l
£ 8
>—* 0Q aa a c no
*—1 a
3 4-*
0 ca -.-4 <u c i 0
<C C*.
&o a
.5 a
.5 5
SC - J ra 1 3C •r-4 4-1 8 ew £ 4-» a 3 03 8 *-H a3
a 0
m to
s a
as no
a £
ro H
cu
C 4—1 03 03 G 4-* •4-1 ca
CxJ
"S s3 0
a £
a a
CS on a3 "no3 f *3 -g G 3 •H
• 1 1
■H *H 3-» W-s
O Q)
<5 "a
jj jj jj jj ij jj jj jj jj jj jj jj jj jj jj jj jj jj ij jj jj jj jj jj jj jj jj jj jj ij jj jj jj 11 jj jj jj IJ jj jj jj jj jj jj jj JJ jl jj Jj jj IJ Jj Jj jj LH VO UO wn VO co Mp CO CO vx>
11 ao
11 er»
Ij -H Ii tn :: %
II o II 11 o 11 as 11 au
11 ••
!! 8
A cross-tabulation of workers distributions by industry and occupation is shown in table 2.8. By and large, the occupational structures are backward for all industries. Even for community, social and personal services, about only 59 per of workers are professional and technical workers. The most backward industry is agriculture, followed by construction and manufacturing.
Among nine industries there are six industries in which most of workers are manual workers or related to traditional modes of production.
Compared with the average level of occupational distribution for total labour force, the percentage shares are much lower for three occupations: professional and technical workers, clerical workers and service workers in agriculture while the percentage shares for the above three occupations are higher in all non-agricultural industries. An opposite conclusion is drawn from agricultural occupations.