Int. J. Electrochem. Sci., 5 (2010) 1008 - 1017
International Journal of
ELECTROCHEMICAL
SCIENCE
www.electrochemsci.org
Cholesterol Biosensor Based on MWCNTs-MnO
2Nanoparticles
Using FFT Continuous Cyclic Voltammetry
P. Norouzi1,2,*, F. Faridbod 2, E. Nasli-Esfahani,2 B. Larijani,2 M. R. Ganjali2,1
1
Center of Excellence in Electrochemistry, University of Tehran, Tehran, Iran
2
Endocrinology & Metabolism Research Center, Tehran University of Medical Sciences, Tehran, Iran
*
E-Mail: [email protected]
Received: 15 June 2010 / Accepted: 29 June 2010 / Published: 15 July 2010
A new electrochemical biosensor was designed for the cholesterol determination based on nanomaterials. Cholesterol oxidase was immobilized on to the MnO2 nanoparticles and Multiwall
cabon-nanotubes (MWCNTs) which they were placed on a glassy carbon electrode surface using nafion. The detection method was based on fast Fourier transformation (FFT) continuous cyclic voltammetry in a flow injection system. Under optimal conditions, the linear response range of the biosensor was 1 to 100 nM and the detection limit was 0.3 nM at a signal-to-noise ratio of 3. The biosensor showed an acceptable reproducibility, good stability and low interferences.
Keywords: Cholesterol, biosensor, nanoparticles, FFT Cyclic voltammetry
1. INTRODUCTION
HO
O2 H2O2
ChOx O
Cholesterol Cholest-4-en-3-one
Electrochemical biosensors have shown to be very effective tools for analysis of biological important molecules. They are very simple, fast, inexpensive, portable and capable of reliable response in wide concentration ranges.
This work introduces a new electrochemical biosensor for determination of cholesterol combine with FFT continuous cyclic voltammetry (FFTCCV) technique in a flow injection analysis [3-7]. To the best of our knowledge, this is the first application of FFTCCV method for cholesterol biosensor based on ChOx.
[image:2.612.118.493.242.432.2]Cholesterol oxidase (ChOx) is an enzyme that catalyzes the chemical reaction which is shown in Fig. 1.
Figure 1. Schematic diagram of cholesterol oxidase (ChOx) enzymatic reaction
This enzyme belongs to the family of oxidoreductases, specifically those acting on the CH-OH group of donor with oxygen as acceptor. The systematic name of this enzyme class is cholesterol:oxygen oxidoreductase.
The electrooxidation current of hydrogen peroxide which is produced at the same time, is detected after application of a suitable potential to the system.
In this new cholesterol biosensor, ChOx was immobilized onto the MnO2 nanoparticles (NPs)
and multiwalled carbon nanotubes (MWCNTs) on a glassy carbon (GC) electrode surface which was fixed by nafion. The important parameters were optimized for improving the detection method.
Nanomaterials prepared from metals, shaped into nanoparticles have been widely used for their ability as electrode modification materials to enhance the efficiencies of electrochemical biosensors. MnO2 NPs can catalyst the decomposition of hydrogen peroxide. Therefore, the produced O2 from the
Carbon nanotubes have many properties that make them ideal as components in electrical circuits, including their unique dimensions and their unusual current conduction mechanism. Using MWCNTs improves the conductivity and conversion of the chemical signal to an electrical one. By increasing the conductivity, the dynamic working range and response time of the sensor improve [10-12].
2. MATERIALS AND METHODS 2.1. Reagents
Cholesterol oxidase (ChOx) (28 U/mg) was purchased from Sigma-Aldrich. All other chemicals are of analytical grade form Merck Co. and are used without further purification. The solutions are prepared in deionized distilled water. MnO2 particles purchased from Sinopharm Henan
Bonzer Imp. & Exp. Co., Ltd. Nafion (5 wt.%) were purchased from Sigma–Aldrich. The multi-wall carbon nanotubes (MWCNTs) with 10-40 nm diameters, 1-25 µm length, SBET: 40-600 m2/g and with 95% purity were purchased from Research Institute of the Petroleum Industry (Iran).
2.2. Biosensor construction
For the construction of cholesterol biosensors, 0.5 µL solution of 20 mg/mL MnO2NPs was
deposited onto GC electrode surface (3.0 mm2) dried at room temperature for 10 min to form a thin NPs-layer. After this procedure, 0.4 µL solution of ChOx 30 mg/mL/MWCNTs 6 mg/mL (in a phosphate buffer pH=7.4 and 0.9% NaCl) was coated on the MnO2 NPs, and dried at room temperature
for 10 min to form a bio-catalytical enzyme layer. The electrode is kept overnight for ChOx immobilization and then washed with buffer solution. After drying the modified ChOx/MWNT/MnO2
-GC electrode (see Fig 2), a 10.0 µL nafion solution was dropped onto the electrode and dried for 12 h at 1.0 oC to form a film on the modified electrode. When, not in use, the MnO2 modified GC
electrodes) were stored in PB solution at 4.0 oC. The composition and quality of the mixture was analyzed by the FTIR, in the range of 400–4000 cm-1. Existence of 1640 and 1450 cm-1 peaks are corresponding to amide bands in the ChEt–ChOx can indicate immobilization of enzymes according to the previously reported paper [8]. A broad band in the range of 3350–3500 cm-1 and at 1635 cm-1 corresponds to OAH stretching and bending modes of vibrations, respectively [13]. The existence of bands about 880 cm-1 and 2360 cm-1 are related to the carbonate moieties observed when FTIR samples are measured in air [13].
2.3. Instrumentation
waveform and acquire current readings. In the measurements, the memory and CPU requirements of the computer were dictated by the condition of the data acquisition requirements electrochemical software was developed using Delphi 6.0. The potential waveform was repeatedly applied to the working electrode and then the data was acquired, and stored by the software. Also, in this electrochemical setup, the data could be processed and plotted in real time, or the stored data could be loaded and reanalyzed to generate voltammogram.
2.4. Flow Injection Setup
The flow injection analysis equipment integrated with an eight roller peristaltic pump (UltrateckLabs Co., Iran) and a four way injection valve (Supelco Rheodyne Model 5020) with 200 µL sample injection loop. The analyte solutions were introduced into the sample loop by means of a plastic syringe. The electrochemical cell used in flow injection analysis is shown in Fig. 2.
Figure 2. The diagram of cholesterol biosensor and the electrochemical cell used in flow injection analysis
Nafion
ChOx
MnO2 Nps
G
C
E
le
ct
ro
d
e
MWCNT
3. RESULTS AND DISCUSSION
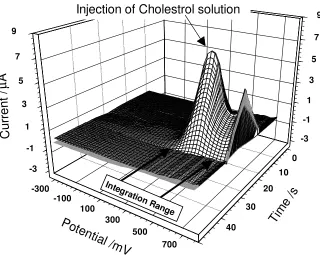
Fig. 3 shows FFT cyclic voltammograms and the changes in voltammetric of the MnO2NPs/MWNT/GC electrode in the potential range of -300 to 800 mV at potential sweep rate is 5
Vs-1. The potential axis on this graph represents potential applied to the working electrode during each sweep. The time axis represents the time passing between the beginning of the flow injection experiment and the beginning of a particular sweep (i.e. it represents a quantity proportional to the sweep number) [14-17]. The figure shows that before injection (in absent of cholesterol) there is no significant changes in the voltammograms, but by injection of 200 µL of 2.0×10⁻⁵ M cholesterol in 0.01 M PB buffer at pH=7.4 a signal appears at potential 380 mV.
The increase in the current of the electrode (at potential 380 mV) can be due to the generation of H2O2 during the oxidation of cholesterol at electrode surface by ChOx. However, the attachment of
the ChOx to high surface area of MWNT/MnO2 nanoparticles facilitates a higher rate of direct electron
transfer between the active sites of immobilized ChOx. This can increase the peak current at the recorded cyclic voltammograms when the sample was injected.
The results show that with increasing the concentration of cholesterol in the injected sample, the current increases. This confirms a good electrocatalytic and fast electron exchange behavior of modified electrode at high potential sweep rate.
-300 -100
100 300
500 700
0 10
20
30
40 -3
-1 1 3 5 7 9
-3 -1
1 3
5 7
9
T
im
e
/s
Pote
ntial
/mV
C
u
rr
e
n
t
/
µ
A
Injection of Cholestrol solution
Integratio
n Range
Figure 3. FFT cyclic voltamograms of the ChoX/MnO2NPs/MWNT-modified GC electrode without
[image:5.612.144.464.386.641.2]
Once FFTCCV is used to monitor a flowing system, cholesterol electrochemical processes will cause a measurable change in the peak current at the voltammograms. According to Fig. 1, the electrochemical reaction for the detection of cholesterol in presence of ChOx is proposed and the enzymatic reaction which produce H2O2.
In this detection method the current passing through the electrode was sampled only during the potential ramp. The integration of net current changes is applied over the selected scanned potential range. In this method, ∆Q is calculated based on the all-current changes at the CV. A total absolute difference function (∆Q) can be calculated by using the following equation:
(1)
Where, s is the sweep number, τ is the time period between subsequent potential scan, ∆t is the time difference between two subsequent points on the cyclic voltammograms, i (s, E) represents the current of the cyclic voltammograms recorded during the s-th scan and i (sr, E) is the reference current
of the cyclic voltammograms. Ei and Ef are the initial and the final potential, respectively, for
integrating of current. This integration range for the current is shown in Fig. 3. The reference cyclic voltammogram was obtained by averaging a 3 to 10 cyclic voltammograms, recorded at the beginning of the experiment (i.e. before injection of the analyte).
3.1. Optimizing the experimental parameters
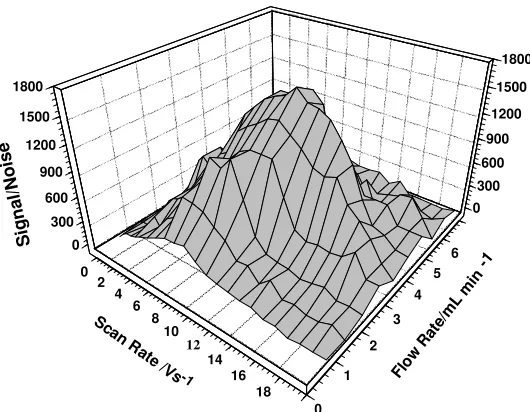
In fact, sensitivity of the detection system mainly depends on the potential sweep rate mainly due to kinetic factors of the electrode processes, and instrumental limitations [18-21]. From this point of view, checking how the sensitivity of the method is affected by the sweep rate is necessary. In order to investigate the influence of scan rates and the elunet flow rate on the sensitivity of the detector response, at different scan rates (from 0.5 to 20 V/s) and the eluent flow, solutions having a concentration of 2.0×10⁻⁵ M of Cholesterol were injected, and the responses of the detector were recorded.
The obtained results are presented in Fig. 4. As it is clear from the Fig. 4, the detector exhibits the maximum sensitivity at 5 V/s of scan rate and 3.5 mL/min of the flow rate. The effects of the sweep rate on the detection performance can be taken into consideration from three different aspects: first, speed in data acquisition, second, kinetic factors of electrochemical processes, and finally the flow rate of the eluent which controls the time retention of the solution zone in the detector.
The main reason for application of high scan rates can have a negative effect on electrochemical processes during the potential scanning.
( )
(
) (
)
− ∆
=
∆
∑
=
= f
i
E E
E E
r E
s i E s i t s
0 2 4 6 8 10 12 14 16 18 0 1 2 3 4 5 6 0 300 600 900 1200 1500 1800 0 300 600 900 1200 1500 1800 Scan R
ate /V
s-1 Flo
w R ate/ mL min -1 S ig n a l/ N o is e
Figure 4. Effect of the sweep rate and effect of flow rate on the response of the ChoX/MnO2NPs/MWNT-modified GC electrode to injections of 2.0×10⁻⁵ M cholesterol
3.2. Calibration curve and biosensor characterization
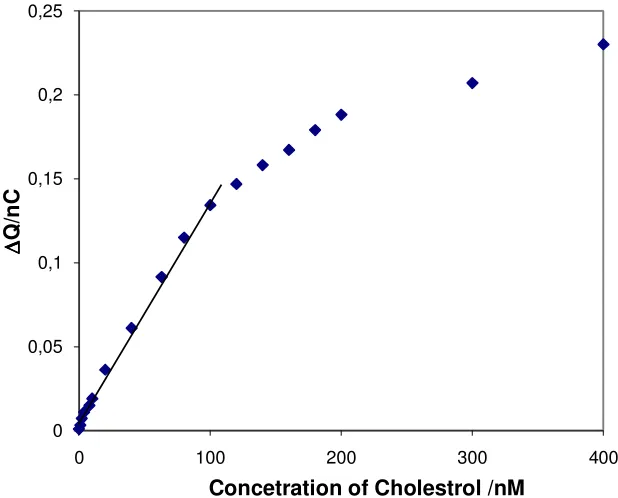
Fig. 5 illustrates a typical ∆Q response of the modified electrode on a standard solution of cholesterol (from 1.0 to 25.0 nM in 0.01 M PB solution, pH=7.4). The experimental conditions were set at optimum values in order to obtain the best detection limits.
Figure 5. Response of the ChoX/MnO2NPs/MWNT-modified GC electrode to cholesterol in upon the
following concentrations: a, 1; b, 2; c, 4; d, 8; e, 15; f, 25 nM.
0 0.005 0.01 0.015 0.02 0.025 0.03 0.035 0.04 0.045 0.05
0 500 1000 1500
[image:7.612.175.440.67.273.2] [image:7.612.148.441.456.671.2]
Results shown in this figure represent the integrated signal for 3 to 5 consecutive flow injections of the standard solution. Under optimized conditions, the steady-state voltammetry showed a linear dynamic range of 1 to 100 nM (Fig. 6). A correlation coefficient of R=0.993 with %R.S.D. values ranging from 0.24–3.5% across the concentration range studied were obtained following linear regression analysis. Typically, the regression equation for the calibration curve was found to be Y= 0.782X + 3.34.
As mentioned above the electrode response could be expressed in various ways as peak heights or peak areas. For this reason, the magnitude of the flow-injection peaks depends on the choice of the data processing methods. Measurements carried out for small analyte concentrations allow the estimation of the detection limit CDL:
slope s
C b
DL 3
= (2)
Where sb is the standard deviation (or noise) of the baseline around the flow-injection peak.
The linearity was evaluated by linear regression analysis, which calculated by the least square regression method. The detection limit, estimated based on signal to noise ratio (S/N=3), was found to be 0.3±0.01 nM.
0 0,05 0,1 0,15 0,2 0,25
0 100 200 300 400
∆∆∆∆
Q
/n
C
[image:8.612.145.454.398.647.2]Concetration of Cholestrol /nM
The long-term storage stability of the sensor was tested for 30 days. The sensitivity retained 92.3% of initial sensitivity up to 54 days which gradually decreases afterwards might be due to the loss of the catalytic activity.
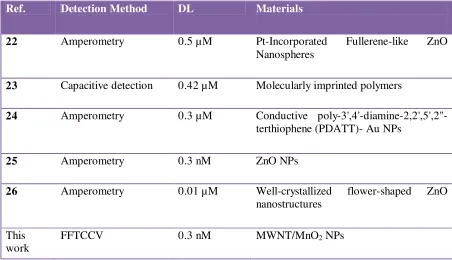
In evaluation, the performances of the fabricated biosensor is compared with some of the best previously reported cholesterol biosensors based on the utilization of different materials as the working electrode and different detection techniques (Table 1) and it was confirmed that the presented MWCNTs and MnO2 NPs based cholesterol biosensor with FFT continuous cyclic voltammetry
[image:9.612.79.531.248.508.2]exhibited an excellent and reproducible sensitivity [22–26].
Table 1. The comparison of the proposed biosensor with the best previously reported ones based on the utilization of different materials
Ref. Detection Method DL Materials
22 Amperometry 0.5 µM Pt-Incorporated Fullerene-like ZnO
Nanospheres
23 Capacitive detection 0.42 µM Molecularly imprinted polymers
24 Amperometry 0.3 µM Conductive
poly-3',4'-diamine-2,2',5',2''-terthiophene (PDATT)- Au NPs
25 Amperometry 0.3 nM ZnO NPs
26 Amperometry 0.01 µM Well-crystallized flower-shaped ZnO
nanostructures
This work
FFTCCV 0.3 nM MWNT/MnO2 NPs
4. CONCLUSIONS
An ultra-sensitive cholesterol biosensor has been fabricated by modifying the GC electrode surface with MWNT/MnO2 NPs. A higher producible sensitivity of 1.8 nCnM/cm-2, response time less
than 5 s and detection limit of 0.3 nM was observed from the fabricated biosensor. To the best of our knowledge, this is the first time that a very high-sensitivity and low detection limit detector is used for cholesterol biosensors based on MWNT/MnO2 NPs modified electrodes.
References
1. J. W. Baynes, M. Dominiczak, Medical Biochemistry, Second edition, Elsevier, 2005.
2. White, A.; Handler, P.; Smith, E.L.; Hill, R.L.; Lehman, I.R. Principles of Biochemistry, 6th Ed.; McGraw-Hill Book: New York, 1987; p. 903.
3. P. Norouzi, H. Rashedi, T. Mirzaei Garakani, R. Mirshafian and M. R. Ganjali, Int. J. Electrochem. Sci. 5 (2010) 377.
4. P. Norouzi, M. R. Ganjali, B. Larijani, A. Mirabi-Semnakolaii, F. S. Mirnaghi, and A. Mohammadi, Pharmazie 63 (2008) 633.
5. P. Daneshgar, P. Norouzi, F. Dousty, M. R. Ganjali, and A. A. Moosavi-Movahedi, Curr. Pharm. Anal. 5 (2009) 246.
6. P. Norouzi, M. R. Ganjali, S. Shirvani-Arani, and A. Mohammadi, J. Pharm. Sci. 95 (2007) 893. 7. M. R. Pourjavid, P. Norouzi, and M. R. Ganjali, Int. J. Electrochem. Sci. 4 (2009) 923.
8. L. T. Yin, J. C. Chou, W. Y. Chung, T. P. Sun, K. P. Hsiung, and S. K. Hsiung, Sens. Actuators B
76 (2001) 187.
9. Xi-Liang Luo, Jing-Juan Xu, Wei Zhao, and Hong-Yuan Chen, Biosensors and Bioelectronics 19 (2004) 1295.
10.F. Faridbod, M. R. Ganjali, B. Larijani, and P. Norouzi, Electrochim. Acta 55 (2009) 234.
11.M. R. Ganjali, H. Khoshsafar, F. Faridbod, A. Shirzadmehr, M. Javanbakht, and P. Norouzi,
Electroanalysis 21 (2009) 2175.
12.M. R. Ganjali, N. Motakef-Kazemi, F. Faridbod, S. Khoee, and P. Norouzi, J. Hazard. Mater. 173 (2010) 415.
13.W. Lili, W. Youshi, S. Yuanchang, and W. Huiying, Rare Metal. 25 (2006) 68
14.P. Norouzi, M. R. Ganjali, M. Zare, and A. Mohammadi, J. Pharm. Sci. 96 (2007) 2009. 15.P. Norouzi, M. Qomi, A. Nemati, and M. R. Ganjali, Int. J. Electrochem Sci. 4 (2009) 1248. 16.P. Norouzi, B. Larijani, M. Ezoddin and M. R. Ganjali, Mater. Sci. Eng. C 28(2008)87.
17.M. R. Ganjali, P. Norouzi, R. Dinarvand, R. Farrokhi, and A. A. Moosavi-Movahedi, Mater. Sci. Eng. C 28 (2008) 1311.
18.P. Norouzi, M. R. Ganjali, and L. Hajiaghababaei, Anal. Lett., 39 (2006) 1941.
19.P. Norouzi, G. R. Nabi Bidhendi, M.R. Ganjali, A. Sepehri, M. Ghorbani, Microchim. Acta, 152 (2005) 123.
20.P. Norouzi, M. R. Ganjali, T. Alizadeh, and P. Daneshgar, Electroanalysis, 18 (2006) 947. 21.M. R. Ganjali, P. Norouzi, M. Ghorbani, and A. Sepehri, Talanta, 66 (2005) 1225.
22.M. Ahmad, C. F. Pan, L. Gan, Z. Nawaz, and J. Zhu, J. Phys. Chem. C 114 (2010) 243. A. Aghaei, M. R. M. Hosseini, and M. Najafi, Electrochim. Acta 55 (2010) 1503.
23.A. Abdelwahab, M. S. Won, and Y. B. Shim, Electroanalysis 22 (2010) 21.
24.Umar, M. M. Rahman, M. Vaseem, and Y. B. Hahn, Electrochem. Commun. 11 (2009) 118. 25.Umar, M. M. Rahman, A. Al-Hajry, and Y. B. Hahn, Talanta 78 (2009) 284.