by
Uzair Suhaimi
A thesis submitted in partial fulfillment for the degree of Master of Arts in Demography
Graduate Program in Demography National Centre for Development Studies
Australian Natijial University Canberra.
Except where otherwise indicated, this thesis is my own work.
AKNOWLEDGEMENTS
I am deeply grateful for his constructive guidance to Dr. Alan Gray, my supervisor. To Dr. Terence Hull, I am indebted for opinion, method and style.
To all GPD Staff, for invaluable discussion on early drafts of this thesis, I should like to express my thanks. To Marian May, for her patient guidance in improving my English, I should give my special thanks.
Thanks are due to Bapak Sugito, M .A ., Deputy Director General of the Indonesian Central Bureau of Statistics (CBS), Bapak I. Gde. Mamas, M.A., Ibu Sri Poedjastoeti, M.A., Ibu Dr. Soedarti Surbakti, Bapak Dr. Y.B. Sunyoto and other CBS staff for their advice, encouragement and great help before and during my study in the program.
A B S T R A C T
The aim of the study is to analyse and interpret fertility decline in West Java. While empirical data derived from various surveys and censuses are used for the analysis, the available literature supplements information for the interpretation. It is argued that the geographic setting and sociocultural environment of West Java explain the relatively high level of fertility for the province.
Consistent fertility decline and significant socioeconomic differentials in fertility have been found for West Java. Yet, fertility levels of the province have always been the highest among those of the provinces of Java and Bali. The study suggests that changes and differences in a number of intermediate variables (such as age at marriage and contraceptive practice) have been largely responsible for the observed phenomena.
Examination of the major components of the crude birth rate (CBR) indicates that age structure and the proportion of the population in childbearing ages have hindered the CBR decline. In contrast, marital status and marital fertility have been strongly conducive to the decline.
The study also suggests that fertility decline in West Java has occurred in the presence of significant
CONTENTS
Page
Declaration i
Acknowledgments ii
Abstract iii
Contents v
List of Tables vii
List of Figures x
Chapter One: INTRODUCTION 1
1.1. Provincial Variation in Fertility: Overview 1
1.2. Geographical Setting 3
1.3. Demographic Characteristics 6
1.4. Sociocultural Setting 8
1.5. Objectives and Outline of the Study 12
1.6. Data and Methodology 13
Chapter Two: TRENDS AND DIFFERENTIALS IN FERTILITY 16
2.1. Trends in Fertility 16
2.1.1. Average Parity 17
2.1.2. Age-specific and Total Fertility 19 2.1.3. Standardized Fertility 22 2.2. Some Explanations of the Decline and
the Variation in Fertility 24
2.3. Differentials in Fertility 26 2.3.1. Age at Marriage and Fertility 27 2.3.2. Education and Fertility 29 2.3.3. Socioeconomic Status and Fertility 31 Chapter Three: CHANGES IN THE CRUDE BIRTH RATE AND
ITS COMPONENTS 34
3.1. Decline in the Crude Birth Rate 34 3.2. Changes in the Components of the CBR 37
3.2.1. Female Age Structure 37
3.2.2. Marriage Patterns of Females 39 3.3. Contribution of the CBR Components 42 3.4. Hypothetical Births Averted 47 Chapter Four: SOCIOECONOMIC CONTEXT OF FERTILITY
DECLINE 49
4.1. Development and Fertility: Overview 49 4.1.1. Major Dimensions of Development 49
4.1.2. Problems of Analysis 51
Chapter Five: SUMMARY AND CONCLUSIONS 70
5.1. Summary Findings 70
5.1.1. Geographic and Sociocultural Settings 70 5.1.2. Trend and Differential in Fertility 71 5.1.3. Relative Influences of the CBR
Components 72
5.1.4. Development and Fertility 73
5.2. Conclusions 73
Appendix One: Standardization Approach 76 Appendix Two: Some Notes on the Estimation of
Fertility Levels 84
LIST OF TABLES.
No. : T i t l e : Page:
1.1. Some West
Basic Demographic Characteristics of
Java and Indonesia ... 7 2.1. Mean Number of Children Ever Born Per Woman
in West Java by Birth Cohort and Age Group,
1980 and 1985 17
2.2. Mean Parity Per Woman Aged 45-49 for Provinces of Java and Bali, 1980 and 1985 ... 20 2.3. Age Specific Fertility Rates (ASFR) and Total
Fertility Rates (TFR) for West Java,
1967-1985 21
2.4. Mean Age of Childbearing in Java and Bali by Province, 1967-70 and 1981-84 22 2.5. Indices of Overall Fertility (If), Marital
Fertility (Ig) and Proportion Married (Im ) for Java and Bali by Province, 1971, 1980 and
1985 24
2.6. Mean Number of Children Ever Born to Ever Married Women by Age at Marriage for Selected Birth Cohorts of Women, West Java,
1980 28
2.7. Percentage of Ever Married Women who Completed Primary School, Lived in Urban Areas and Ever Used Any Contraceptive Method by Age at
Marriage, West Java, 1980 29
2.8. Mean Number of Children Ever Born to Ever Married Women by Educational Level and Birth Cohort of Women, West Java, 1980 31 2.9. Mean Parity of Ever Married Women by
Land Holding Area Own by Household,
West Java, 1980 32
2.10 Mean Parity of Ever Married Women in Households Where the Main Earner is an Agricultural Operator Working in Food Production and Living in
Rural Area, by Agricultural Land Area and
Selected Birth Cohort, West Java, 1980... 33 3.1. Estimated Crude Birth rate (CBR), West Java,
3.2. Standardized Crude Birth Rates for Provinces of Java and Bali, 1967-1985 (per thousand
population) 36
3.3. Indexes of Ratios of Females Aged 15-49 to Total Population (fPis-Ag/P) and of Females Aged 20-29 to Those Aged 15-49 (fPon-^q/fPic_a q)
for Provinces of Java and Bali,
1971, 1980 and 1985 38
3.4. Percentage of Women Currently Married by
Age Group, West Java, 1971-1985 39 3.5. Some Selected Marriage Indicators for Java and
Bali by Province, 1971, 1980 and 1985 .... 41 3.6. Changes in Crude Birth Rate (CBR) and in
General Fertility Rate (GFR) in West Java in 1980-1985: Results of Decomposition into Factors (1980 and 1985 Bases) ... 44 3.7. Standardized Changes in Crude Birth Rate by
Factors in Provinces of Java and Bali in
1980-1985 (Base Population, 1980) 45 3.8. Contraceptive Prevalence Rate for Married Women
Aged 15-44 for Selected Provinces in 1980
and 1985 (percentage) 46
3.9. Contributions of Standardized Changes in CBR Factors to Hypothetical Number of Births Averted, West Java, 1985
(Base Population, 1980) 48
4.1. Estimated Per Capita Expenditure Distribution and Gini Coefficients for Selected Provinces in Java, 1978 and 1984 ... 57 4.2. Area Harvested and Production of Paddy in
West Java, Java and Bali, and Indonesia,
1980 and 1984. . 60
4.3. Number of Hospitals, Hospital Beds and Public Health Centres, West Java,
1980 and 1984 64
4.4. Physical Quality of Life Index (PQLI) and Its Components in Selected Provinces of Java,
1971, 1980 and 1985 68
Al.l Formulae for Decomposition of Changes in
Al.2 Adjusted Influence of Each Factor on Changes
in the GFR ... 81
A 1 .3 Individual and Joint Effect Terms for
Determining Contributions of Each Factor of CBR to Changes in the CBR ... 8 2 A1.4 Formulae for Decomposition into Factors
of Changes in the CBR (adjusted) ... 8 3 A1.5 The Results of Calculations Required for the
Standardization Applied to the Data
of Java and Bali by Province ... 83 A 2 .1 P/F Ratios and Age Specific Fertility Rates
LIST OF FIGURES
N o .: T i t l e : Page:
CHAPTER ONE: INTRODUCTION
This study analyzes and interprets fertility decline in the province of West Java, Indonesia. This province is interesting not only because it has the highest level of fertility among the provinces of Java and Bali, but also because it has different socioeconomic and sociocultural backgrounds from other provinces. Since the demographic profiles of the provinces of Java and Bali are similar to some extent, a brief comparative study of the provinces, the inner islands as a contrast to the outer islands of the country, is undertaken.
The analysis is based on secondary data derived from censuses and surveys, mainly the 1980 Population Census and the 1985 Intercensal Survey of the country. The available literature supplements the author's knowledge of the socieconomic and sociocultural contexts of demographic phenomena analyzed. Such contexts are of special interest in this study because they enrich our understanding of human fertility. The background materials are presented in this chapter.
1.1 Provincial Variation in Fertility: Overview
Knowledge about fertility levels and their trends for Indonesia is incomplete or even misleading if it does not consider the great variation among provinces. In Jakarta and West Nusa Tenggara, for example, during the period 1967-70 to 1985 the TFRs declined from 5.2 to 2.2 and from 6.7 to 5.6 respectively (Hull and Hatmadji, 1988: 19). Furthermore, it should be noted that fertility at the national level is highly biased toward levels found in the inner islands which have much lower levels of fertility than the outer islands. This is because about two-thirds of Indonesians are located in Java and Bali (Biro Pusat Statistik (BPS) [Central Bureau of Statistics], 1987b).
The great variation in fertility in Indonesia is not surprising if the geographical setting of the country is considered. As Hugo et al. (1987: 11) write, 'Its
[Indonesia's] people are distributed between more than 300 distinct ethnolinguistic groups and live in an archipelago of over 13 000 islands extending over some 40 degrees of longitude' . On the other hand if we are to believe that the family planning programme has been responsible for fertility decline in the country, the three different phases (five years apart) in the execution of the programme (National Family Planning Coordinating Board, 1986: 14) may provide some explanation of the current variation in fertility. A systematic study of fertility at the provincial level, of which there are very few, may be of interest for population policy planners in the country.
between the two provinces. Furthermore, the social structure of both provinces, as Parsons (1984: 18) observed, is quite distinct from those of other provinces of Java. However, Hull’s suggestion is not completely appropriate for the type of analysis proposed in this study as will become clear later.
1.2 Geographical Setting
This section briefly discusses the geographical setting of the study area, the province of West Java. This province is bordered by Central Java in the east and the Sunda Straits (Selat Sunda) in the west. The national capital of the country, Jakarta, is an enclave in the northern part of West Java while the Indian ocean is the southern border of the province. Because of its location next to West Java, Jakarta, as the centre of public administration, business and communication activities of the country greatly influences the socioeconomic activities of the people of the province (see Figure
1.1).
With an area about 46 300 square kilometres, West Java consists of 20 regencies and four municipalities (see Figure 1.2). The regencies of Serang, Tangerang, Bekasi, Karawang, Purwakarta, Indramayu and Cirebon are located in the lowlands of the coastal plain forming the northern part of the province. The southern part of the province, including the regencies of Sukabumi, Cianjur, Garut, Tasikmalaya and Ciamis, has a common steep coastal area running down to the Indian ocean.
NORTH
F
i
g
u
re
1
.
1
:
The
Republic
o
f
In
donesia
a
n
d
I
t
s
Pr
ovi
nc
[image:14.553.42.493.50.720.2]NO
this area are the regencies of Pandeglang, Lebak, Bogor, Subang, Bandung, Sumedang, Majalengka and Kuningan. All of these regencies, except the first two, are inland areas. Such a geographical setting, with the current state of communications, is claimed to be an obstacle to the success of various public services such as health and family planning services. If this is true, the relatively poor success of the family planning programme in West Java compared to other provinces in Java is understandable. For more detailed information about the geographic conditions of West Java see Rusli (1978: 21- 26) .
1.3 Demographic Characteristics
In terms of population, West Java is the second largest province in Indonesia after East Java. In 1985, the population of West Java was 30.8 million as compared with 31.3 million for East Java (BPS, 1987b).
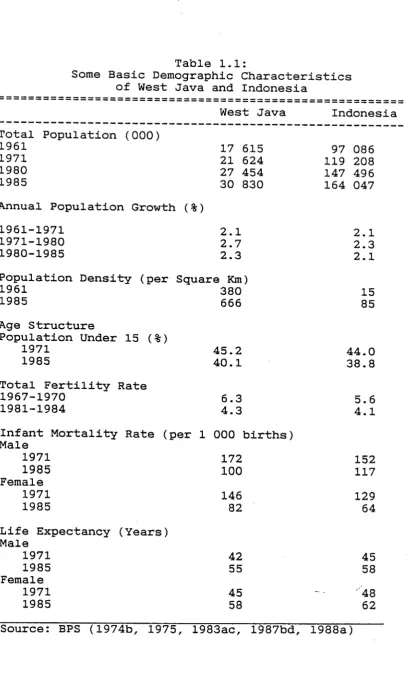
The population of West Java almost doubled between 1961 and 1985 and its annual growth rate was very rapid compared to the national rate (see Table 1.1). The rapid growth was largely due to a high fertility rate, although this was counterbalanced by relatively high mortality. The influence of decline in the mortality rate on population growth is reflected in the increase in the annual population growth rate during the period 1961-1971 to 1971-1980.
A comparatively high infant mortality rate (Table 1.1) may provide some explanation of the relatively high rate of fertility in West Java. Here we would be dealing with a replacement effect (Preston, 1975, cited by Heer,
■
“
= = = = = = = = = =: = = = =:=: = ==
=
=
=
=
:
=
=
=
=
=
=
=
=
=
=
=
=
:
=
=
=
=
:
=
=
=
=
=
=
=
=
:
=
:
=
=
=
=
=
=
=
West Java Indonesia Total Population (000)1961 1971 1980 1985
17 615 21 624 27 454 30 830 Annual Population Growth (%)
1961-1971 1971-1980 1980-1985 2.1 2.7 2.3 Population Density (per Square Km)
1961 380
1985 666
Age Structure
Population Under 15 (%)
1971 45.2
1985 40.1
Total Fertility Rate
1967-1970 6.3
1981-1984 4.3
Infant Mortality Rate (per 1 Male 1971 1985 Female 1971 1985
000 births) 172
100 146 82 Life Expectancy (Years)
Male
1971 42
1985 55
Female
1971 45
1985 58
97 086 119 208 147 496 164 047
[image:17.553.52.468.53.733.2]perceived advantages or disadvantages of children' for parents in West and Central Java.
Net migration for West Java can be assumed to be negligible as a component of population growth. BPS (1988b: 9), for example, estimates the net migration rate
the province to have been only +0.7 per cent as compared to -6.9 per cent for Central Java and -2.8 per cent for East Java in the period 1980-1985. This comparison implicitly suggests a relatively low level of population mobility for West Java.
Another demographic characteristic of West Java is its age structure. Following Weeks' (1978: 160) categorization, the population of West Java should be considered a young population because the percentage aged below 15 is more than 35 (see Table 1.1). This is of course a typical feature of a high fertility population. Its implication for population growth in the near future is clear; the population will expand even if the fertility level is lowered.
1.4 Sociocultural Setting
To map out the sociocultural setting of any society is important for understanding its fertility behaviour. This is because, as Knodel et al. (1987: 143) write, 'the impact of social and economic change on reproductive behaviour is mediated through the cultural setting'. For the majority of Indonesian societies, at least three elements should be mentioned in sociocultural descriptions. These are the Western, Islamic and ethnic traditions.
schooling and other related institutions which are principally uniform. In contrast, the extent to which Islam influences the way of life of Indonesians seems to vary. Tan and Soeradji (1986: 31), for example, consider the Sundanese, the major ethnic group in West Java, to be 'strict Moslems'. This is not to say that all Sundanese are strict Moslems since traces of pre-Islamic culture can also be found in the southern part of West Java. This culture, however, is reflected only in various ceremonial practices and is not manifested in the structure of the society.
The relevant questions to be answered immediately are how and why Islam is associated with fertility. Kirk (1966) probably answered the first question when he wrote that low age at marriage is more common in Moslem countries than elsewhere. In addition, resistance to family planning in Islamic society is more effective than in Catholic society (Kirk, 1966: 561). These mechanisms through which Moslem practices determine fertility may explain, to some extent, a comparatively high level of
fertility for West Java.
One may argue, and this is a 'more common view' , that religion, including Islam, 'is a kind of cultural impediment to rational reproductive behaviour, an impediment that will disappear in response to education and other sources of enlightenment' (Simons, 1980: 4). However, a more careful inquiry indicates that the issue is not that simple. Citing Parsons (1966), Simons
(1980:3) writes:
Cultural value patterns provide the most direct link between the social and cultural systems in legitimating the normative order of the
society. The mode of legitimation in turn is grounded in religious orientation.
Here religion should be considered not merely as a variable in a conventional way but more importantly as the grounds for legitimation of a social norm. Knodel
likely to show continuity and a fair degree of persistence even when social and economic change is rapid'. This clearly challenges the more common view mentioned before.
Simons (1980) believes that a fertility rite as found in Hutterite society is a religious representation of a sacred ideology. He shows that a conventional demographic explanation (age at marriage and mortality rate) does not work to justify the very high average family size of this society (over ten children). Rather he argues that 'the sacred ideology designates a particular form of reproductive behaviour as sacred'
(1980: 8), and 'in substantial as well as structural respects, Moslem ideas about reproductive behaviour resemble Hutterite ideas' (1980: 10).
Turning finally to ethnic tradition, as mentioned before, the major ethnic group in West Java is the Sundanese. They are the second largest ethnic group in Indonesia after the Javanese who inhabit Central Java, Yogyakarta and East Java. Between the two ethnic groups there are many similarities. For example, 'both groups have a bilateral kinship system and are predominantly Moslem' (Tan and Soeradji, 1986: 135), though their Moslems are widely believed to be different in degree of strictness. More importantly, because it may explain the fertility differential between these societies, there are some dissimilarities between the two ethnic groups.
...can help gain acceptance for family planning even in a socioeconomic situation which is not particularly conducive to an individual recognition of the value of fertility limitation.... This is why, in part, the greatest achievements of the programme have been experienced in East and Central Java and perhaps a factor accounting for the relative lack of programme success in West Java which is predominantly Sundanese in ethnicity and social structure (Parsons, 1984: 13).
In contrast to the Javanese, the Sundanese seem to be more egalitarian and democratic. Although in the past a few kingdoms have also ruled over the Sundanese
...there is no evidence indicating the
existence of the social division into castes as found in Hindu society. Neither is there evidence showing that among the Sundanese there had ever been a strong and rooted feudal
bureaucracy, nor showing the existence of the palace which became the centre of cultural and social life for the people (translated from Rosidi, 1980: 132).
The egalitarianism found among the Sundanese may be favourable to fertility decline in the long run. However, in the current stage where adoption of family planning is much more the result of external influences (the government) than of individual motivation as implicitly stated by Warwick (1986: 453), the egalitarianism is not having an effect.
Another feature of the Sundanese which seems to differentiate them from the Javanese is the lack of solidarity among them. Wessing (1974: 147) has concisely explained this by saying:
... peer group, in the sense of solidarity
between equals, is not really applicable to the Sundanese. The group of lower status people may be large, but solidarity can not really be said to exist among them. On the other hand, the higher one rises in status the fewer 'peers’ one has, but even among those few no solidarity can be said to exist.
practical consequences for the family planning programme mentioned before.
The sociocultural setting of the Sundanese in contrast to the Javanese has been mapped out. The setting of the Balinese, another society which is also included in the analysis, is well-documented. While the Sundanese and the Javanese are mainly Moslems, the Balinese are predominantly Hindu. More importantly, the Balinese have a distinctive social organization known as the banjar, a small community made up primarily of kin-related family which is equivalent in size but different in function to the hamlet in Java (Parsons, 1984: 7). Through this organization, family planning among the Balinese has been very successful (Streatfield, 1987), though 'there are significant variations in population growth patterns and contraceptive use in different regions of Bali' (Poffenberger, 1983: 59).
1.5 Objectives and Outline of the Study
The major concerns of the study can be stated in the following two questions: (1) why has the fertility level in West Java not remained constant, and (2) why has the level been comparatively high? A reasonable comparative context for answering the second question is provided by Java and Bali.
data, the comparison with other provinces is not given, but a comparison between different birth cohorts is included.
In Chapter Three, the change in crude birth rate (CBR) and in its major components is evaluated. The influence of change in CBR components on change in the CBR in West Java is examined and compared with that of other provinces.
Acknowledging the important association between socioeconomic variables and fertility and accepting the complexity of the issue, in Chapter Four the socioeconomic context of fertility decline in West Java is explored. This exercise is undertaken largely to evaluate an argument that fertility decline in Indonesia has occurred in the absence of significant improvement in socioeconomic development. In Chapter Five, the last chapter, the major findings of the study are summarized. Recommendations for further study are also presented in this chapter.
1.6 Data and Methodology
The analysis is based on secondary data various censuses and surveys though there are only two which are extensively used - the 1980 Population Census (the 1980 census) and the 1985 Intercensal Survey (the 1985 survey). This section discusses only these two major sources. Details for other sources used can be found in McNicoll and Singarimbun (1983, Appendix).
The 1985 survey was a sample survey and was conducted in October-November 1985. Unlike the 1980 census, the sampling fraction of the survey varied widely from province to province, and was based on the population density of each province. As examples, the sampling fraction for West Java was 0.3 per cent (urban) and 0.3 per cent (rural), while for Bali the percentages were 1.3 per cent (urban) and 0.5 per cent (rural) (BPS,
1986b: 18). For the type of analysis proposed, the size of data sets is not a problem. However, the sampling design of the survey does not allow any demographic parameters to be estimated at regency level or below (BPS, 1986b: 11-18). Mainly for this reason, this study does not analyze regency level variation in the fertility of West Java, though the variation has been quite substantial (see Cho et al.,1980: 61).
There is no coverage problem in the 1980 census and the 1985 survey; both were designed to cover all households in Indonesia. There are also no problems in the quality of interviewers or in the level of supervision in either the census or the survey (see, for example, Hull and Dasvarma, 1987). These assertions all suggest, at first glance, that the 1980 census and the 1985 survey data can safely be compared. However, a more careful examination suggests that comparison problems do still exist.
Probably the most serious problem that should be considered in using these sources is the accuracy of age data. The U.N. Age-Sex Accuracy Index for West Java was 48.1 for the 1980 census and 51.6 for the 1985 survey (Larson, 1987:9). These figures indicate how unreliable the data are. However, it is not proposed to adjust the data since any effort to do so will obviously affect related measures (mostly cross-classified by age) used in this study. Inspection of other sources of data used indicates that the problem of accuracy in age data is even worse. Given this limitation, the results of analysis in this study should be treated as tentative.
The type of analysis undertaken is basically descriptive, through tabulations. To examine the relative influence of age structure, marital fertility and the other major components of the crude birth rate (CBR) on change in the CBR, the standardization approach developed by the U.N.Secretariat (1979) is employed. A summary of the method is given in Appendix One of this study.
One may argue that Bongaarts’ model (1978) may be used for a similar purpose; that is 'to estimate the relative importance of each of the four variables of which it [the-TFR] is constituted' (Handwerker, 1986: 8). Mainly because there are not sufficient data available
for such an analysis, this model is not employed in this study. Furthermore, as Handwerker (1986: 8-9) writes,
Although fertility, especially in developing countries, is a complex phenomenon (Wrong, 1964: 42; Bulatao, 1983 : 1), at least two aspects of this phenomenon have been broadly understood. These are that fertility in developing countries has declined since the mid-1960s and that the pattern of the decline has varied across the strata of societies (see U.N., 1978). Variation in this very general picture is sometimes substantial. For this reason, a study of such issues is still of interest for both policy makers and researchers. This chapter provides a descriptive analysis of trends and differentials in fertility in West Java.
2.1 Trends in Fertility
Fertility levels can be described in terms either of current or period fertility, or of cumulative or cohort fertility. While period fertility refers to childbearing during a specified time, cohort fertility refers to childbearing of the individual or a group during her/its reproductive span.
2.1.1 Average Parity
Fertility decline in West Java can be shown by, among other things, the 1980 census and the 1985 survey data. The two sources permit paired comparisons of average parity, in this case the mean number of children ever born per woman, for adjacent five-year birth cohorts. The comparisons are presented in Table 2.1.
Table 2.1 Mean Number of Children Ever Born Per Woman in West Java by Birth Cohort and Age Group, 1980 and 1985
Birth Cohort
Age Group (years)
15-19 20-24 25-29 30-34 35-39 40-44 45-49 50-54
1925-30 5.57
1930-35 5.93 5.07
1935-40 5.76 5.04
1940-45 5.32 5.08
1945-50 4.25 4.45
1950-55 2.86 3.47
1955-60 1.46 2.39
1960-65 0.28 1.11 1965-70 0.16
Source: Note :
Calculated from BPS (1983c, 1987d).
The upper diagonal is the 1980 census data, the lower, the 1985 survey.
[image:27.553.46.477.227.764.2]that 1985 figures may be systematicaly biased downward compared to 1980 ones for all birth cohorts.
Table 2.1 also shows that, based on the 1980 data, average parity was lower for age group 50-54 than for age group 45-49. A conventional explanation for this is memory lapse; that is, older women tend to forget the total number of children they have borne. It is, however, conceivable that 'older women actually experienced smaller numbers of children ever born than younger women' because of 'higher mortality and morbidity during their reproductive period' (Cho et al, 1980: 33), even though
'the effects of mortality on average parity are likely to be very small' (U.N., 1983: 29).
In general it can be said that average parity is not reliable as an estimate of fertility level because of errors in either the number of children reported or errors in the classification of women in particular groups. The most important source of the former errors, as mentioned before, is omission. This omission has the result that 'the proportion of omitted tends to increase with age of mother', and accordingly 'average parities... fail to increase rapidly enough as age increases' (U.N., 1983: 28). Errors in the classification of women are very likely substantial for West Java given the very poor quality of age data.
A few attempts to estimate the TFR completely based on parity have been made. Coale and Demeney (19 67, cited in Brass, 1980: 35) have shown from empirical study that the TFR may be approximated as:
TFR = (P3)2/(P2)
Another formula has been proposed by Brass (1980: 35), based on Gompertz's equation as follows:
where P2 denotes the mean number of children to the cohort of women in age group 20-24, P3 the number to women aged 25-29, etc.
Applying these formulae to the data for West Java provides the following figures for the TFR in 1980 and 1985 : 5.6 and 5.2 (Coale and Demeney's formula), and 7.9 and 4.9 (Brass' formula). These big differences suggest that both formulae can not be applied confidently to the data for West Java probably because of poor guality of the data
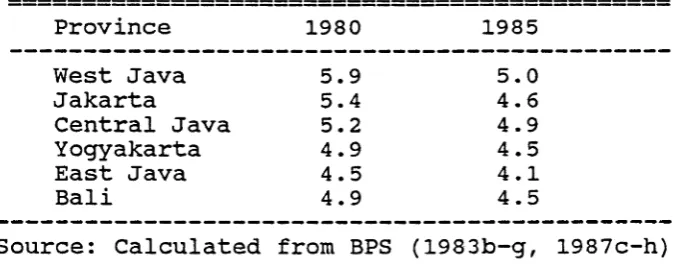
For an immediate comparison between geographic areas, the mean parity per woman aged 45-49 can probably be used. Using this measure fertility for West Java was higher than that for any other province of Java and Bali, as Table 2.2 shows.
Table 2.2: Mean Parity per Woman Aged 45-49 for Provinces of Java and Bali, 1980 and 1985
Province 1980 1985
West Java 5.9 5.0
Jakarta 5.4 4.6
Central Java 5.2 4.9
Yogyakarta 4.9 4.5
East Java 4.5 4.1
Bali 4.9 4.5
Source: Calculated from BPS (1983b-g, 1987c-h)
2.1.2 Age Specific and Total Fertility
[image:29.553.90.433.427.561.2]The TFR can be estimated by various methods. Two of these are the Own Children and the Last Birth methods, on which the TFR figures reported here (and also the crude birth rate figures discussed in the next chapter) are based. The Own Children method is quite widely applied to data for several ESCAP countries (Ogawa, 1980: 65). It calls for a reasonably accurate age classification and relatively low mortality during the estimation period prior to enumeration. Although these requirements 'can be flexible to a certain extent' (Ogawa, 1980: 79), failure to meet them may seriously affect the accuracy of the results.
The Last Birth method, on the other hand, is relatively free of the various assumptions, some of which are unrealistic for Indonesia, which usually underlie indirect methods of estimating fertility (Hull and Dasvarma, 1987: 1). Unfortunately, this method also has possibly serious limitations when applied to data of poor quality like Indonesia has (see Appendix Two) . For these reasons one should be extra cautious in interpreting fertility levels in this thesis.
[image:30.553.49.474.61.464.2]Table 2.3: Age Specific Fertility Rates (ASFR) and Total Fertility Rates (TFR), West Java, 1967-1985
Age Group 1967-70 1971-75 1976-79 1981-84 1980 1985
(1) (2) (3) (4) (5) (6)
15-19 208 164 157 120 119 70
20-24 305 285 264 224 236 179
25-29 280 271 237 206 209 170
30-34 211 211 185 155 161 138
35-39 199 119 109 100 108 73
40-44 50 59 49 44 45 30
45-49 14 19 13 12 14 9
TFR (per
thousand) 6335 5640 5070 4305 4465 3340
Source : BPS (1988) , Hull (personal communication) Note : Except for the last two columns which are the
results of the Last Birth method, the figures are calculated applying the Own Children method.
A brief inspection of the age-specific fertility shown by the table indicates that fertility has declined at all ages almost without exception throughout the observed period. The most striking decline is shown in age group 15-19. This very likely is associated with upward movement in female ages at first marriage. Comparing closely the age-specific fertility rates
(ASFRs) for provinces of Java and Bali indicates the existence of a very similar pattern throughout the region
(BPS, 1988a).
[image:31.553.41.471.66.491.2]...by lengthening the time it takes newborn daughters to become mothers, by allowing more chance for mortality to deplete cohorts before they complete their childbearing, and by temporarily depleting the number of births during the period of transition from early childbearing to late childbearing (Yaukey, 1973: 12)
Table 2.4 illustrates how the mean age of childbearing for Java and Bali has been constant or has even decreased (except for Jakarta) during the observed period. This probably has happened because a sharp decline in fertility for the younger age group, 15-19, which tends to increase the mean age of childbearing has been counterbalanced by quite substantial declines in fertility for older age groups (25-29 to 35-39) that tend to depress the mean age. The TFRs for West Java, as Table 2.4 shows (figures in parentheses), are highest.
Table 2.4: Mean Age of Childbearing in Java and Bali by Province, 1967-70 and 1981-84
Province 1967 -70 1981-84
West Java 27.4 (6.3) 27.4 (4.3)
Jakarta 27.2 (5.2) 27.4 (3.2)
Central Java 27.2 (5.3) 27.2 (3.8) Yogyakarta 28.2 (4.8) 27.9 (2.9)
East Java 27.0 (4.7) 26.5 (3.2)
Bali 27.8 (6.0) 27.2 (3.1)
Source: Calculated from BPS (1988a).
Note : Figures in parentheses indicate the TFRs.
2.1.3 Standardized Fertility
[image:32.553.79.450.419.564.2]from zero to one. If lg=0 it means zero fertility while a value of 1 means natural fertility as observed among the Hutterites of North America. Im also ranges from 0 to 1 and reflects the fertility impact of the proportion married at different ages. Ignoring illegitimate fertility, If = Ig x Im and therefore also ranges from 0 to 1 (see Coale, 1965).
Indexes of overall (If) and marital (Ig) fertility for West Java in comparison with those of other provinces of Java and Bali are presented in Table 2.5. It can be seen from the table that the level of overall fertility (If) for West Java is at all dates the highest. However, as in other provinces it has declined considerably over the observed period.
Marital fertility (Ig) more accurately expresses fertility where most fertility takes place within marriage because it controls for the age-specific proportion married. Marital fertility reflects couples' contraceptive use (including abortion) and their desires for children within marriage (Thapa et al.,1988: 12). Table 2.5 shows that the level of marital fertility for West Java in 1971 was two-thirds of natural fertility and slightly lower than that for Bali (note that in that year the family planning programme was not yet officially operating in Indonesia). The table also demonstrates that as in other provinces of Java and Bali, marital fertility has sharply decreased in the observed period.
Hiroshima (1986) has mathematically proved that decline in marital fertility does not necessarily mean decline in fertility of couples. Whether or not it is true for Indonesia, calls for further investigation.
Table 2.5: Indices of Overall Fertility (If), Marital Fertility(Ig) and Proportion Married (Im) for Java and Bali by Provinces, 1971, 1980 and 1985
If ig H
1
3
1 1 1 1
province —
1971 1980 1985 1971 1980 1985 1971 1980 1985 West Java . 53 .37 . 28 . 67 .48 . 37 .79 .77 .76 Jakarta . 44 .33 . 17 . 64 .52 . 29 . 69 . 63 .59 Central Java .44 . 34 . 25 .58 .46 .36 .76 .73 . 69 Yogyakarta . 38 . 28 .20 .57 .45 .33 . 67 . 62 . 61 East Java . 39 . 28 .22 .52 . 37 .30 .75 .76 .73 Bali . 49 . 29 .21 .70 .42 . 32 .70 . 69 . 66
Source: Hull and Dasvarma (1987, Table 2). Note : (Im) is calculated by dividing (If) by
corresponding (Ig).
the proportion married does not correspond to that of differences in marital fertility. Rather the relationship seems to be an inverse one with differentials in proportion married 'offsetting those of marital fertility and hence narrowing the range of variation in overall fertility' (Cho et a l ., 1980: 43).
2.2 Some Explanations of the Decline and the Variation in Fertility
From the previous discussion two things are clear: (1) the fertility level in West Java has declined, and (2) the level has been the highest among the provinces of Java and Bali. These phenomena call for explanation.
prevalence in West. Java have certainly been favourable for fertility decline in the province. The former is believed to be associated with the expansion in educational participation by younger birth cohorts, while the latter is a result of easier access to "modern" contraception. On the other hand, the fact that West Java has the lowest age at marriage and the lowest contraceptive prevalence might explain, to an extent, its relatively high fertility level compared with the Java-Bali standard.
Breastfeeding and associated postpartum abstinence which are major determinants of overall fertility in Java and Bali 'are probably important in determining regional and socioeconomic fertility differentials' (McNicoll and
Singarimbun, 1983: 60). Unfortunately, there has been some decline in the mean duration of breastfeeding and of postpartum abstinence (see, for example, McNicoll and Singarimbun, 1983: 60). Following Rosa (1979: 13), this condition is associated with 'modernization' or 'pseudomodernization' and is certainly unfavourable for fertility decline. McNicoll and Singarimbun (1983:60) write that the decline in the duration of postpartum abstinence among the Javanese is associated with 'the rapidly expanding use of "modern" program-supplied contraceptive techniques' and with 'the erosion of taboos' against resumption of intercourse during breastfeeding.
In 197 6, the mean duration of breastfeeding for West Java was 16.1 months, a shorter duration by 1-2 months than in other provinces of Java and Bali aside from Jakarta (Indonesian Fertility Survey, 1978: 49). Breastfeeding 'protects against pregnancy mainly because it delays the return of ovulation during the postpartum period' (Nag, 1980: 8). This is, however, 'largely a function of intensity of breastfeeding' (McNicoll and Singarimbun, 1983: 60).
therefore 'we must rely on intensive village studies' (McNicoll and Singarimbun, 1983: 56). Citing Zuidberg (1978) and Singarimbun and Manning (1974), McNicoll and Singarimbun
(1983: 59) write that the duration of postpartum abstinence for women in Serpong, a district in West Java, was shorter than for women in Mojolama, a village in Yogyakarta. In addition, according to Zuidberg, there was 'no taboo against resumption of intercourse prior to weaning' for the observed women in Serpong. The influence of Islam is seen here. As Hull et a l . (1977: 34) write, the duration of postpartum abstinence among the Sundanese 'apparently conforms fairly closely to the perfunctory 40 days prescribed by the Holy Qur'an with the result that birth intervals are shorter than among the ethnic Javanese'.
2.3 Differentials in Fertility
Age at marriage, as already mentioned, is one variable that explains the decline and the variation in fertility in Java and Bali. This section evaluates how this variable affected fertility in West Java in 1980. It is well documented that fertility performance varies if cross- classified by socioeconomic variables. This section also evaluates how women's education and landholding area are associated with fertility in West Java using special tabulations from the 1980 census.
2.3.1 Age at Marriage and Fertility
Age at marriage is expected to be associated with fertility. However, the mechanisms linking these variables, in aggregate and at individual levels of analysis, are not always clear. In addition, the direction of the causal influence is frequently elusive. For example, while it is widely believed that age at marriage influences fertility
(U.N., 1987), Smith (1983: 479) writes that it is often argued 'at least implicitly, that the marriage timing is guided by fertility intention'.
Whatever the reasons and mechanisms are, the 1980 census data indicate a strong and negative relationship between age at marriage and fertility in West Java (Table 2.6) . This is true for all cohorts, but the pattern of the relationship cannot be compared across birth cohorts because of different periods of exposure to the risk of marital childbearing.
A tendency to delay marriage for more recent birth cohorts of women is also seen in the table. This is evidenced by decreases in the percentage of women who married at early ages. Putting this in another way, the median ages at marriage for birth cohorts 1931-1935 and
1951-1955, for example, were 14.9 and 15.6 respectively.
Table 2.6: Mean Parity of Ever Married Women by Age at Marriage for Selected Birth Cohorts of Women, West Java,
1980
Age at
Marriage
Birth Cohort
1931-1935 1936-1940 1941-1945 1946-1950 1951-1955 <14 6.6(14.9) 6.3(15.0) 6.1(14.3) 5.0(15.0) 3.8(13.0) 14-15 6.0(36.6) 5.9(35.3) 5.6(34.9) 4.6(34.0) 3.3(29.2) 16-17 6.0(24.6) 5.9(24.4) 5.4(25.9) 4.3 (25.3) 3.0(27.4) 18-19 6.0(10.8) 5.8(12.1) 5.2(12.8) 4.1(12.9) 2.7(15.4) 20-21 5.4 ( 6.9) 5.0 ( 7.6) 4.7 ( 6.5) 3.4( 6.7) 2.1( 8.0) 22-24 5.6 ( 2.6) 5.1( 2.8) 4.2 ( 3.0) 3.0( 3.5) 1.5( 5.0) 2 5+ 4.2 ( 3.6) 4.0 ( 2.8) 3.3 ( 2.6) 1.8( 2.6) 0.8( 2.0)
Total 6.0 5.8 5.4 4.3 3.0
(N) (532 935) (670 786) (798 425) (750 275)(1020 989) Source: Special tabulation of the 1980 census (unpublished) Note : Figures in parentheses represent the percentage of
ever married women.
At a societal level, the socioeconomic characteristics of populations with later age at marriage are more likely to be associated with higher contraceptive use. They tend to be more educated and more urbanized. Their lower fertility is therefore 'not only because of their lost reproductive years but because of deliberate limitation of marital fertility' (U.N. , 1987: 90). Such relations, to some extent, are also found in West Java as Table 2.7 shows.
[image:38.553.40.478.121.347.2]Table 2.7: Percentage of Ever Married Women who Completed Primary School, Lived in Urban Areas and Ever Used Any Contraceptive Method by Age at Marriage, West Java, 1980.
Age at marriage:
Below 14 18-19 25 or above Completed Primary
School or above 1.4 19.8 22.1
Living in Urban
Area 16.7 24.2 33.6
Ever Used Any Contra
ceptive Method 18.8 31.6 30.4
Source: Special tabulation of the 1980 census (unpublished)
married at ages 25 or above (Adioetomo, 1981: Tables 5.1- 5.4). In effect, fertility rates during the first few years of marriage are higher for women who married at older ages than for women who married at younger ages (U.N., 1987: 92). Nonetheless, the long run effect of age at marriage on
fertility should be reflected in the mean number of children ever born to women who have nearly completed childbearing (U.N., 1987: 95). Table 2.6 clearly shows that for the birth cohort 1931-1935, aged 45-49 at the time of observation, the negative effect is quite powerful.
2.3.2 Education and Fertility
[image:39.553.36.464.107.297.2]Table 2.8: Mean Number of Children Ever Born to Ever Married Women by Educational Level and Birth Cohort of Women, West Java, 1980
Educational Birth Cohort =
Completed < 1946 1946-55 > 1955 Unstandardized
No Schooling 5.3 (61.5) 3.7 (25.5) 1.3 (19.1) Some ES 5.8 (26.1) 3.7 (39.2) 1.3 (44.4)
ES 5.7 ( 9.3) 3.4 (26.7) 1.2 (30.8)
JHS or above 5.5 ( 3.1) 2.8 ( 8.6) 1.2 ( 5.6)
Total 5.5 3.5 1.3
(N) (3 544 296) (1 808 787) (1 826 375) Standardized by Age at Marriage
No Schooling 5.4 3.6 1.3
Some ES 5.8 3.6 1.3
ES 5.8 3.4 1.3
JHS or above 6.3 3.9 1.6
Total 5.6 3.6 1.3
Source: Note :
Calculated from special tabulation of the 1980 census (unpublished).
(1) All birth cohorts included 'not stated' birth cohort.
(2) Numbers in parentheses represent percentage of ever married women.
(3) Total for the first panel included 'not stated' educational level
(4) ES: Elementary School; J H S : Junior High School
(5) Distribution of age at marriage used in the standardization is as presented in Table 2.6
(see text).
1979: 5; U.N., 1987: 214). For West Java, the relationship is quite strong as shown by Table 2.8, but is not always linear as hypothesized above. The cohorts shown in the Table 2.8 are not the same as for Tables 2.6 and -2.10'because the source tabulation did not contain enough detail.
[image:40.553.35.469.112.386.2]education and age at marriage on fertility. Comparison among different birth cohorts also indicates quite different patterns of the relationship. However, the patterns are not comparable because of differential exposure to risk of marital childbearing among birth cohorts.
Table 2.8 also shows that mean parity for the oldest cohort of women with no schooling is relatively low. Among other possible explanations, this is probably because these women reported parity poorly (assuming the quality of the data is not uniform across education groups).
Another important issue regarding the relationship between education and fertility is that breastfeeding, abstinence and mortality effects 'act to increase the supply of children, raising the possibility that the net effect of education' on fertility 'may not always be negative' (U.N., 1987:-215). It is well documented that shorter duration of breastfeeding and postpartum abstinence practices (tend to increase fertility) and lower infant mortality (tends to decrease fertility) are more likely to be found among well educated than less educated women. However, there is no sufficient evidence for these processes being active in West Java.
2.3.3 Socioeconomic Status and Fertility.
The relation between socioeconomic status and fertility seems not to be uniform and probably varies according to cultural context and level of development of a society. Rainwater (1960: 2), using data from America, finds a negative correlation between socioeconomic status and fertility. In a stronger statement, Wrong (1967: 71) writes that 'the existence of a negative correlation between fertility and class or socioeconomic status has virtually acquired the force of a sociodemographic law'.
from Poland, for example, indicates a positive correlation between the holding size of farms and fertility, and the regularity 'is marked and applied in all twenty villages in the sample7 (1957: 136). Data from Indonesia provide similar findings (Hull, 1976; Supraptilah and Soeradji, 1979). While Hull (1976) uses the data from a case study in rural Java as the basis of her study, Supraptilah and Soeradji use aggregate data for the whole country. Yet both studies use a similar composite index for the socioeconomic status of households (incorporating educational level of the mother or the head of household, household possessions, income, etc.).
Using a single indicator, that is land holdings that are owned by households, 1980 census data indicate the existence of the positive relation between socioeconomic status and fertility in West Java. Table 2.9 shows that the positive correlation is very strong. Note that the figures in the table are for both urban and rural areas regardless of the main occupations of the main earners of household.
Table 2.9: Mean Parity of Ever Married Women by Land Holding Area Own by Household, West Java, 1980
Land Holding (Ha) Mean Parity
0.00 3.9
0.01 - 0.25 4.5
0.26 - 0.50 4.8
0.51+ 5.3
Source: Special tabulation of the 1980 census (unpublished).
[image:42.553.92.467.465.586.2]T a b l e 2.10: M e a n Par i t y of E ver M a r r i e d W o m e n in H o u s e h o l d s W h e r e the M a i n E a r n e r is an A g r i c u l t u r a l O p e r a t o r W o r k i n g in
Food P r o d u c t i o n and Living in a Rural Area, by A g r i c u l t u r a l Land A r e a and S e l e c t e d Birth Cohort, W e s t Java, 1980
A g r i c u l t u r a l Birth C ohort
Land ---A rea (Ha) 1931-1935 1936-1940 1941-1945 1946-1950 1951- 1955
0.00 0.0 1-0.10 0.11-0.20
0 . 2 1-0.25 0.26-0.30 0.31-0.40 0.41-0.50 0.51-0.75 0.76-1.00 1 . 0 1 - 1.50 1.51-2.00 2 . 0 1 - 3.00 3 . 0 1 - 5.00 5 . 0 1 - 25.00
5.6(31.4) 5.9(18.9) 5.5(18.1) 5.7(19.6)
5.8( 8.6) 5.9( 8.6) 6.0(24.8) 5.9(13.5) 6.3(15.5)
6.6 ( 8.2)
6.3 ( 6.2) 7.0 ( 4.2) 6.2 ( 2.4) 7.9 ( 0.7)
5.6(45.3) 5.7(21.2) 5.4(22.2) 5.7(23.8) 5.4(10.0) 5.5( 9.2) 5.7(28.7) 5.6(16.6) 6.1(19.0) 6 . 1( 9.8)
6.2( 6.8)
6.3( 3.9) 6.7( 2.3)
6.2( 0.2)
5.2(53.0) 5.2(24.7) 5.1(24.1) 5.2(27.5) 5.1(11.4) 5.3(10.1) 5.3(33.0) 5.2(17.1) 5.7(19.5) 5.5( 9.4)
6.0( 6.2)
5.5( 4.6) 5.8( 2.3) 6.3( 0.4)
4.2(54.4) 4.2(21.7) 4.1(21.9) 4.4(24.3) 4.0( 8.9) 4.3( 8.3) 4.5(26.9) 4.3(13.7) 4.6(14.5) 4.4( 7.4) 4.9( 4.7) 4.8( 3.6) 4.9( 1.3) 4.2( 0.2)
2.9(80.3) 2.9(28.3) 2.8(27.0) 3.0(32.3) 2.8(10.3) 2.9(10.2) 3.0(30.3) 3.0(13.7) 3.1(16.6)
3 .0 ( 6 .2 )
3.3( 4.6) 3.1( 3.2) 3.1( 1.4)
2.0 ( 0 .2 )
C o r r e l a t i o n
C o e f f i c i e n t +0.86**) +0.10 +0.79**) +0.49*) +0.77**)
Source: S p e cial T a b u l a t i o n of the 1980 c ensus ( u n p u b l i s h e d ) . Note : (1) F i g u r e s in p a r e n t h e s e s indicate the n u m b e r of
w o m e n (in thousands).
(2) C o r r e l a t i o n c o e f f i c i e n t s are s i g n i f i c a n t l y d i f f e r e n t from zero at five (*) or one
(**)p e r c e n t levels of significance. The c o e f f i c i e n t for c o h o r t 1946-1950 is
s t a t i s t i c a l l y not s i g n i f i c a n t l y d i f f e r e n t from z e r o .
enumeration. The tab l e c l e a r l y shows a h i g h and p o s i t i v e
c o r r e l a t i o n b e t w e e n a g r i c u l t u r a l area own e d by h o u s e h o l d s
and m e a n p a r i t y of w o m e n living in those h o u s e h o l d s ex c e p t
for c o h o r t 1946-1950, for w h i c h the r e l a t i o n s h i p is not
s t a t i s t i c a l l y significant. The e x p l a n a t i o n for this p a t t e r n
[image:43.553.60.501.209.430.2]CHAPTER THREE:
CHANGES IN THE CRUDE BIRTH RATE AND ITS COMPONENTS
Various measures used in the previous chapter have consistently indicated fertility decline in West Java. Yet this does not necessarily imply decline in the crude birth rate (CBR), simply because this measure is a composite indicator. Change in the CBR occurs not only because of fertility movement but also because of change in its other components. This chapter evaluates changes in the CBR and its components in West Java and examines the contribution of the components to overall CBR change in that province for the period 1980-1985.
The CBR, because of its composite nature, can be analyzed by way of division into four major components. It can be expressed as a multiple of the four as follows:
CBR = (W/P) 5 Ai.Mi.Fj_
where (W/P) : proportion of women at child bearing ages to total population; Ai : proportion of women at age i;
Mi : proportion of currently married women at age i ;
Fi : marital fertility of ever-married women at age i ; and
i : childbearing age group i.
Appendix One of this study discusses further the logic and development of the expression above (based on U.N. Secretariat, 1979).
3.1 Decline in the Crude Birth Rate
that the CBR can be directly related to population growth and it is relatively easy to calculate (Cho et a l . , 1980: 36) .
The CBR for West Java has consistently declined since the period 1967-70 as shown by Table 3.1. The last
Table 3.1: Estimated Crude Birth Rate (CBR), West Java, 1967-1985
Period/Year Model 1 Model 2
1967-1970 49.81) 44.7
1971-1975 42.92) 40.8
1976-1979 40.03) 37.7
1981-1984 35.24 ) 33.4
1980 34.83) 34.2
1985 27.24 ) 28.0
Source: Calculated from BPS (1974b; 1983c; 1987d; 1988a) and Kantor Statistik Jawa Barat (1980).
Note : a) The formula used for Model 1: fPi
CBR =
a
ASFRj_ (-- ) Pwhere ASFRj_ : age-specific fertility rate age i ;
(fPi/P): ratio between female popula- lation aged i and total
population.
Different data sources for the ratios are the 1971 census (1), the 1976 Intercensal Survey
(2), the 1980 census (3) and the 1985 intercensal survey (4).
b) The formula for Model 2 is adopted from BPS (1988a:35) as follows:
CBR = 9.48968 + 0.00555 TFR.
Model 2 are very likely less reliable simply because the latter model ignores different age structures for different periods/years of estimation (see note for Table 3.1). Nonetheless, one thing is clear. The figures in the table provide a quite convincing picture of the consistent decline in the CBR in West Java.
The decline in the CBR, as expected, was not as rapid as the decline in the total fertility rate. For example, while the TFR declined by 3 2 per cent in the period 1967-70 to 1981-1984, the CBR declined by only 16 per cent (see Tables 2.3 and 3.1).
For comparison purposes the CBR should be standardized; that is, adjusted by using a common age structure. Standardized CBRs for the provinces of Java and Bali are given in Table 3.2, the age structure of the Indonesian population in 1980 being used as the standard age structure. Again, the last two columns would be better treated separately because of the methodological problem mentioned before. It is clear from the table that CBRs for West Java were always the highest.
Table 3.2; Standardized Crude Birth Rates for Provinces of Java and Bali, 1967-1985 (per thousand population)
Province
1967-1970
1971-1975
1976-1979
1981-1984
1980 1985
West Java 50 44 40 34 35 26
Jakarta 41 37 31 25 31 16
Central Java 40 38 34 30 32 23
Yogyakarta 36 33 26 22 24 18
East Java 37 34 29 26 26 20
Bali 46 39 31 24 , 27 19
Source: Calculated from BPS (1975; 1977b; 1983a;
3.2 Changes in the Components of the CBR
As mentioned before, there are four major components of the CBR which are mathematically interrelated. Since one of them (marital fertility) has been discussed in Chapter Two (2.1.3), this section evaluates changes in the other three components.
3.2.1 Female Age Structure
The age structure of women in any society is associated with fertility because only women at certain ages (childbearing ages) are able to give birth. In general, age structure is mainly a function of past fertility rates, though past mortality rates also determine current age structure in less important respects (see, for example, Mauldin, 1981). For a few societies migration also plays a significant role in determining age structure.
Female age structure, in turn, determines fertility. A rise in the proportion of females of childbearing ages
in the total population will result in a higher CBR if other factors remain constant. Furthermore, a rise in the proportion of women at the most fertile ages, typically 20-29, will also logically result in higher fertility all other things being equal (Mauldin, 1981).