Type of the Paper: Research Article 1
Title: Components of Diet Quality Explain the
2Association between Acculturation and Increased
3Body Mass Index in Mexican Americans
4Yilin Yoshida 1, Richard Scribner 2, Liwei Chen 3, Stephanie Broyles 4,5, Stephen Phillippi 4,
5
Eduardo J. Simoes 1, and Tung-Sung Tseng 4 *
6
1 Department of Health Management and Informatics, School of Medicine, University of Missouri 7
2 Program of Epidemiology, School of Public Health, Louisiana State University Health Sciences 8
Center at New Orleans 9
3 Department of Public Health Sciences, Clemson University 10
4 Program of Behavioral and Community Health Sciences, School of Public Health, Louisiana State 11
University Health Sciences Center at New Orleans 12
5 Pennington Biomedical Research Center* 13
14
Correspondence Email: [email protected]. Mailing address: 2020 Gravier Street, 3rd Floor New Orleans, LA 15
70112. Phone: 504-568-6022. 16
17
18
Abstract: 19
Background and Objectives: Acculturation is associated with excessive weight gain among 20
immigrants to the U.S. Whether dietary factors mediate this association is unclear. This study aimed 21
to examine whether overall diet quality or specific component(s) of diet quality mediate the 22
association between acculturation and Body Mass Index (BMI) among Mexican American (MA) men 23
and women. 24
Material and Methods: This is a secondary data analysis using dietary intake data from 24-hour 25
dietary recalls, measured height and weight, and self-reported acculturation from the National 26
Health and Nutrition Examination Survey (NHANES) cycles 1999-2000 to 2011-2012. A total of 6848 27
MA adults (≥20 yrs) with reliable dietary recall status and body measures were included in the 28
study. Path analyses was performed in Mplus with complex survey design effects adjusted. 29
Results: HEI components of whole grains and sodium were found to play meditating roles in the 30
acculturation-BMI association, and their effects on BMI were opposing [indirect effect were -0.01 31
(SE 0.00) and 0.02 (0.01), respectively]. In gender-specific analysis, sodium [0.01 (0.00)] was a 32
significant mediator only in MA men; whereas, whole grains [-0.01 (0.00)] was a significant mediator 33
only in MA women. 34
Conclusions: HEI components of whole grains and sodium appeared to be significant dietary 35
mediators in the acculturation-BMI association. Understanding the variations of dietary 36
components and their relationship with acculturation as well as BMI is useful for developing dietary 37
interventions and obesity reduction. 38
Keywords: 1 Acculturation; 2 Diet Quality; 3 Healthy Eating Index; 4 Body Mass Index; 5 Mexican 39
Americans; 6 NHANES 40
1. Introduction 41
The burden of obesity in Mexican Americans (MAs) varies by the level of acculturation [1-6] — 42
a process in which immigrants adopt the customs and behaviors of a new culture [7]. Research 43
showed that MAs’ risks for obesity increase with the increase of acculturation [1-6]. Compared to 44
U.S.-born individuals, foreign-born MAs have lower body weight, regardless of their 45
socioeconomic status [1, 3-5]. Additionally, duration of U.S. residency and English fluency were 46
also found to be positively associated with obesity [2, 3, 6]. 47
The differences in obesity status by acculturation are likely to be attributable to changes in 48
lifestyles, including dietary changes [8, 9]. Current findings regarding the relationship between 49
acculturation and diet are equivocal. Some studies suggested that acculturation to U.S. society was 50
associated with adverse nutritional profiles and unhealthful dietary behavior [9, 10]. Such that, a 51
higher degree of acculturation was related to lower intake of fruit and vegetables, but higher intake 52
of total fat, saturated fat, sodium, sugar, and sugar-sweetened beverages [9, 11]. Acculturation was 53
also associated with more consumption of commercially prepared foods [9, 11, 12], which often are 54
high in sodium, sugar, and saturated fat, but low in fibers [13]. Others, however, demonstrated 55
protective effects of acculturation on aspects of diet, such as increased intake of whole- or multi-56
grains products [12, 14]. Compared to individuals living in Mexico, acculturated MAs are more 57
likely to take advantage of the wide varieties of whole-grain foods in the U.S. food environment 58
[14]. The relationship between acculturation and diet seems complex as the previous studies 59
suggest opposite association and often only involved outcome of a single nutrient or a food group. 60
Further investigation equipped with comprehensive dietary assessment that enables evaluating diet 61
quality and variety of dietary components is therefore warranted. 62
Diet quality reflects the combination of nutrients and foods, rather than inclusion of food(s) or 63
nutrient(s) in isolation from one another or caloric intake exclusively [17]. Studies have shown a 64
possible link between diet quality and weight outcomes [15-17]. The Healthy Eating Index (HEI) is 65
developed by the U.S. Department of Agriculture for monitoring dietary intake and nutrition 66
promotion activities for the U.S. population [18]. The total HEI score examines the overall dietary 67
quality; while the component scores used to calculate the total HEI score can be used to study 68
components of dietary intake and their relationship with obesity or disease risk [19]. Previous 69
research has shown inverse associations between the HEI and risks for obesity, central obesity and 70
obesity-related conditions in general adult populations [16, 19-22]. A low total HEI score was 71
associated with overweight and obesity among U.S. adults including Mas [19, 21]. A high 72
consumption of proteins, sodium and empty calories was associated with increased risk for 73
overweight and obesity [16]. 74
While evidence has undertaken the association between the HEI and weight outcomes [16-75
22], as well as the association between acculturation and diet quality or weight outcomes [3, 6, 7], 76
little is known whether the overall diet quality or specific component(s) of diet quality mediates the 77
association between acculturation and body mass index (BMI). Using weight and dietary data in a 78
national sample of MAs, the current study aimed to 1) examine whether the overall diet quality 79
(i.e., HEI total score) mediates the association between acculturation and BMI; 2) which aspect(s) of 80
diet quality (i.e., HEI component scores) mediate the association between acculturation and BMI 81
among MAs. Gender disparities of obesity among MAs exist [23-26]. While national age-adjusted 82
prevalence of overall obesity were 45% vs 47% for MA women and men, respectively; in California 83
and on Texas border, researchers reported MA men have almost the same likelihood to be obese as 84
their women counterparts [23-25]. In addition, effect of acculturation on dietary changes and weight 85
gain varies between genders [24, 26]. For example, MA men were reported to consume more 86
western style fast food than women due to acculturation [24, 26]. For these reasons, we performed 87
2. Materials and Methods 89
Data. Cross-sectional data from the Continuous NHANES cycle 1999-2000 to cycle 2010-2012 were 90
obtained for the analysis. The NHANES is a complex, multistage probability sample of U.S. 91
noninstitutionalized civilians that started in 1999 (detailed information NHANES is described 92
somewhere else and the data can be found on NHANES website) [26]. The National Center for 93
Health Statistics Research Ethnic Review Board approved NHANES, and informed consent was 94
obtained from all participants [27]. Data from the United States Department of Agriculture (USDA) 95
Food Pattern Equivalents Databases (FPED) were utilized to translate NHANES dietary data into 96
equivalent servings of the major food groups and subgroups according to the HEI2010. 97
Measures. Weight status. The primary outcome, BMI, was calculated as weight divided by the 98
square of height (kg/m2). The body measurement data was collected in the Mobile Examination 99
Center (MEC), by trained health technicians. NHANES used digital scales and stadiometers to 100
measure height and weight. Detailed measurement procedures were documented somewhere else 101
[28]. 102
Acculturation. The main predictor of interest, acculturation was constructed as an acculturation 103
score, which was based on three proxy measures: country of birth, language spoken at home, and 104
length of time in the U.S. Combining country of birth and length of time in the U.S., a score of 0-3 105
score was assigned based on four categories (3=U.S. born, 2=foreign born and lived in the U.S.≥20 106
years, 1=foreign born and lived in the U.S. 10-19 years, 0=foreign born and lived in the U.S.<10 107
years). A score of 0-2 was assigned to language spoken at home (2=English only or pro-English, 1= 108
both equally, 0=Spanish or pro-Spanish). These scores were summed to yield a total acculturation 109
score, ranging from 0 (least acculturated) to 5 (most acculturated). This is a validated scale that has 110
been tested in Hispanic and Chinese populations in the U.S. [28]. Instead of using the three 111
components as separate variables, it is argued that an acculturation score gives a more accurate 112
representation of acculturation status than each independent indicator, in that these characteristics 113
are usually clustered within an individual and they are inseparable [29]. 114
Diet quality. The study mediators, the HEI2010 scores, were composed based on dietary intake data 115
from NHANES in-person 24-hour recall interview. Detailed descriptions of the dietary recalls and 116
data collection are available elsewhere [30]. FPED from USDA then translated dietary recall data 117
into equivalent servings of the major food groups and subgroups. The HEI2010 has 12 categories, 118
including 9 “adequacy” (total vegetables, greens and beans, total fruit, whole fruit, total proteins, 119
seafood and plant proteins, whole grains, dairy, and fatty acids) and 3 “moderation” (refined 120
grains, sodium and empty calories) components. For all components, higher scores indicate closer 121
conformance with dietary guidelines [18]. The scores assigned for the 9 adequacy and the 3 122
(reverse-scored) moderation components were summed to yield a total score ranging from 1 to 100, 123
with higher score indicating a better diet quality [18]. 124
Covariates. The following sociodemographic covariates were considered: gender, age (20-40, 41-60, 125
or >60), education (less than high school, high school or equivalent, or more than high school), 126
marital status (yes or no), poverty-income ratio (PIR<1, 1≤PIR<3, or PIR≥3), and insurance coverages 127
(public insurance including Medicare, Medicaid or other forms of government insurance, private 128
insurance, or no health insurance). Potential confounding effects from other behavioral factors were 129
also adjusted, such as smoking (never, former, or current), alcohol drinking (never, former, or 130
current), and physical activity (PA). PA was assessed by using the physical activity questionnaire 131
(PAQ) items employed in NHANES. Participants were asked their engagement in moderate-to-132
vigorous physical activity (MVPA) during the past 30 days related to transportation, 133
household/domestic tasks, and leisure-time activities. Their responses were translated to 134
into one of two categories (<150 or ≥150 minutes/week) based upon their achievement of the current 136
activity guidelines [31]. Lastly, Data Release Number (SDDSRVRY) was taken into account in the 137
analysis to adjust for potential different distributions of sampled populations in different survey 138
cycles. 139
Analysis. A final 6847 Mexican Americans ≥20 years with non-missing dietary and non-pregnancy 140
status were included in the study. Path analyses were used to test whether the HEI2010 mediates 141
the association between acculturation and BMI. Because whole fruit, greens and beans, seafood and 142
plant proteins are parts of total fruit, total vegetables, and total proteins, respectively, they were 143
excluded from the analysis to avoid collinearity. Acculturation and a set of sociodemographic 144
factors were modeled as being correlated and as having both direct and indirect (through 145
mediators, HEI component scores) effects on the dependent variable, BMI. Mediation proportion 146
[indirect effect/ (indirect+direct effects)]×100 were used to determine the mediation effect size.32 A 147
mediation proportion of 10% or more is considered as statistically significant mediation effect, and 148
5% to 10% as moderate mediation effect. 33 All analyses were conducted using Mplus version 7.3 149
(Muthen & Muthen, Los Angeles, CA) with complex survey design effects adjusted. 150
151
3. Results 152
Table 1 presents descriptive results of the study. The mean acculturation index was 2.4, mean 153
BMI was 29, and mean HEI total score was 29.1 for MAs in NHANES cycles 1999-2000 to 2010-2012. 154
In gender-specific analyses, women appeared less likely to be current smokers (12% vs. 27%, 155
P<.001) and current drinkers (53% vs. 79%, P<.001), but more likely to achieve the Physical Activity 156
Guidelines for Americans (PAGA) (63% vs. 52%, P<.001), and have better diet quality (HEI total 157
score 51.1 vs. 48.4, P<.001). However, in comparison to men, women were more likely to be 158
acculturated (mean acculturation index 2.6 vs. 2.3, P<.001) and to have higher BMI (mean BMI 29.5 159
vs. 28.6, P<.001). 160
Table 1. Sociodemographic and Behavioral Characteristics by Gender Group among MAs, 161
NHANES 1999-2012 162
All Men Women
n (%) P
Age (years) **
20-40 3096 (61.5) 1382 (63.6) 1590 (59.2)
41-60 1948 (29.0) 941 (28.5) 940 (29.6)
>60 1803 (9.5) 788 (8.0) 899 (11.2)
Education **
Less than high school 4047 (53.0) 1896 (55.1) 1954 (50.6) High school or equiv. 1235 (20.7) 563 (21.4) 622 (20.0) More than high school 1550 (26.3) 649 (23.4) 844 (29.4)
Income1 **
PIR<1.0 1929 (31.3) 830 (29.1) 1026 (33.7)
1≤PIR<3 2039 (47.8) 1413 (49.9) 1422 (45.5)
PIR≥3 1550 (20.9) 567 (21.9) 587 (20.8)
Marital status *
Married 3971 (56.6) 1953 (58.5) 1849 (54.5)
No 2944 (51.1) 1451 (54.9) 1387 (46.9) **
Public 1544 (14.0) 573 (9.9) 888 (18.6)
Private 2257 (34.9) 1052 (35.2) 1106 (34.5)
Smoking **
Non-smoker 4120 (61.5) 1391 (49.4) 2539 (74.9)
Former 1494 (18.6) 923 (23.5) 506 (13.2)
Current 1224 (19.9) 795 (27.1) 378 (12.0)
Alcohol drinking **
Non-drinker 997 (15.4) 111 (4.4) 886 (27.6)
Former 1164 (17.7) 555 (16.5) 609 (19.2)
Current 3437 (66.9) 2001 (79.2) 1436 (53.2)
Physical activity 2 **
Met PAGA (≥150 min/wk) 4084 (56.7) 1703 (51.5) 2192 (62.5) Mean score (SE)
Acculturation (index 0-5) 3 2.4 (0.1) 2.3 (0.1) 2.6 (0.1) **
BMI 4 29.0 (0.1) 28.6 (0.2) 29.5 (0.2) **
HEI total score (0-100) 5 49.7 (0.3) 48.4 (0.3) 51.1 (0.4) **
Total vegetables (0-5) 5 3.5 (0.0) 3.4 (0.0) 3.6 (0.0)
** Greens and beans (0-5) 5 2.1 (0.0) 2.1 (0.0) 2.0 (0.1)
** Total fruit (0-5) 5 2.1 (0.0) 1.9 (0.1) 2.4 (0.0)
**
Whole fruit (0-5) 5 2.0 (0.0) 1.8 (0.1) 2.2 (0.1) **
Whole grains (0-10) 5 1.4 (0.0) 1.1 (0.1) 1.6 (0.1) **
Total dairy (0-10) 5 4.7 (0.1) 4.2 (0.1) 5.2 (0.1) ** Total proteins (0-5) 5 4.4 (0.0) 4.5 (0.0) 4.3 (0.0) ** Seafood & plant protein (0-5) 5 2.0 (0.0) 1.9 (0.1) 2.0 (0.0) * Fatty acids (0-10) 5 5.2 (0.1) 5.2 (0.1) 5.1 (0.1) **
Sodium (0-10) 5 5.4 (0.1) 4.5 (0.1) 5.2 (0.1) **
Refined grains (0-10) 5 4.6 (0.1) 4.6 (0.1) 4.7 (0.1) 0.06 Empty calories (0-20) 5,6 12.4 (0.1) 12.1 (0.1) 12.8 (0.2) **
1 PIR: Poverty-to-Income Ratio
163
2 PAGA: Physical Activity Guidelines for Americans. According to PAGA, moderate-intensity physical activities of ≥150
164
minutes per week is needed. 165
3 Acculturation is an index of 0-5 (0 is the lowest acculturation and 5 is the highest acculturation). The index derived from
166
information of length of stay, nativity, and language spoken at home. 167
4 BMI: Body Mass Index (kg/m2)
168
5 Maximum score for each HEI category is in paraphrase; higher score means better quality.
169
6 Empty calories are from solid fats, alcohol, and added sugars.
170
missing: age 307; education 319; PIR 1005; married 430; insurance status 390; PA 1249; smoking 315 171
*=P<0.05, **=P<0.001. P is from chi-square test for difference between genders. 172
173
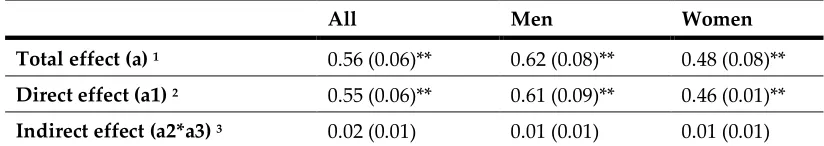
Table 2 and Figure 1.A and 1.B present results from the first set of path analyses— the 174
relationship between acculturation and BMI through the overall diet quality (i.e., HEI total score). 175
Among all MAs, the total effect of acculturation on BMI before adjusting the mediator was 176
significant [total effect a=.56 (SE .06), P<.001] (Table 2). The direct effect of acculturation on BMI (i.e., 177
independent of all measured mediators and confounders) remained significant [direct effect a1=.55 178
(SE.06), P<.001] (Table 2). However, the indirect effect of HEI total score was not significant [indirect 179
effect. This effect size was small considering the criterion of significance is 10% 32. In gender-181
specific analyses, total and direct effects of acculturation on BMI were significant in both gender 182
groups (all P-values <.001) (Table 2 and Figure 1.A. and 1.B.). However, the indirect effects of HEI 183
total score was not significant in either group (P=0.21 and P=.17 for men and women, respectively) 184
(Table 2 and Figure 1.A. and 1.B.). 185
186
Table 2. Path Analysis for the Association between Acculturation and BMI through HEI2010 187
Total Score (Coefficient, SE) 188
All Men Women
Total effect (a) 1 0.56 (0.06)** 0.62 (0.08)** 0.48 (0.08)**
Direct effect (a1) 2 0.55 (0.06)** 0.61 (0.09)** 0.46 (0.01)**
Indirect effect (a2*a3) 3 0.02 (0.01) 0.01 (0.01) 0.01 (0.01)
1 Total effect is the effect of acculturation on BMI before adjusting for the mediator (i.e., HEI total score) and all confounders,
189
including age, gender, education, income, marriage status, insurance status, smoking status, alcohol drinking status, and 190
physical activity. 191
2 Direct effect is the effect of acculturation on BMI after adjusting for the mediator and all confounders.
192
3 Indirect effect is the mediating effect of HEI total score on the association between acculturation and BMI after adjusting for
193
all confounders. 194
*=P<0.05, **=P<0.001. P is from the bootstrap approach. 195
196
197
198
*=P<.05, **=P<.001. P is from the bootstrap approach. 199
200
Figure 1.A. Mediating Effect of HEI2010 Total Score in the Association between Acculturation 201
and BMI among MA Men 202
203
204
*=P<.05, **=P<.001. P is from the bootstrap approach. 205
206
Figure 1.B. Mediating Effect of HEI2010 Total Score on the Association between Acculturation 207
and BMI among MA Women 208
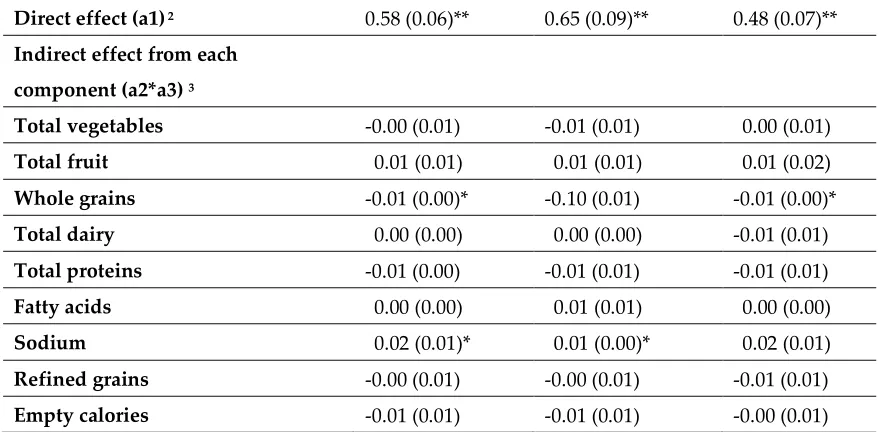
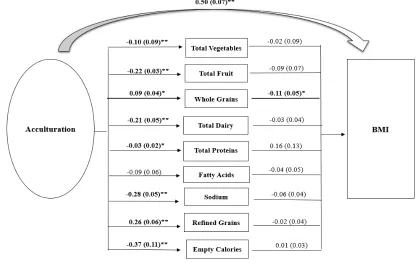
Table 3 and Figure 2.A. and 2.B. present results from the second set of mediation analyses, 210
where HEI component scores mediate the relationship between acculturation and BMI were 211
examined. Among all MAs, the total effect of acculturation on BMI [total effect a=.59 (SE .06), 212
P<.001] was significant (Table 3). After adjusting for all covariates, scores of whole grains [indirect 213
effect a2*a3=-.01 (SE .00), P<.05] and sodium [indirect effect a2*a3=.02 (SE .01), P<.05] had 214
statistically significant indirect effects on BMI (Table 3). The direct effect of acculturation on BMI, 215
independent of all measured mediators and confounders remained significant [direct effect a1=.58 216
(SE.06), P<.001] (Table 3). 217
218
Table 3. Path Analysis for the Association between Acculturation and BMI through HEI-2010 219
Component Scores (Coefficient, SE) 220
HEI components All Men Women
Total effect (a) 1 0.59 (0.06)** 0.66 (0.10)** 0.50 (0.07)**
Direct effect (a1) 2 0.58 (0.06)** 0.65 (0.09)** 0.48 (0.07)**
Indirect effect from each
component (a2*a3) 3
Total vegetables -0.00 (0.01) -0.01 (0.01) 0.00 (0.01)
Total fruit 0.01 (0.01) 0.01 (0.01) 0.01 (0.02)
Whole grains -0.01 (0.00)* -0.10 (0.01) -0.01 (0.00)*
Total dairy 0.00 (0.00) 0.00 (0.00) -0.01 (0.01)
Total proteins -0.01 (0.00) -0.01 (0.01) -0.01 (0.01)
Fatty acids 0.00 (0.00) 0.01 (0.01) 0.00 (0.00)
Sodium 0.02 (0.01)* 0.01 (0.00)* 0.02 (0.01)
Refined grains -0.00 (0.01) -0.00 (0.01) -0.01 (0.01)
Empty calories -0.01 (0.01) -0.01 (0.01) -0.00 (0.01)
1 Total effect is the effect of acculturation on BMI before adjusting for the mediators (i.e., HEI component scores) and all
221
confounders, including age, gender, education, income, marriage status, insurance status, smoking status, alcohol drinking 222
status, and physical activity. 223
2 Direct effect is the effect of acculturation on BMI after adjusting for the mediators and all confounders.
224
3 Indirect effect is the mediating effect of each HEI component score on the association between acculturation and BMI after
225
adjusting for all confounders. 226
*=P<0.05, **=P<0.001. P is from the bootstrap approach. 227
228
229
231
*=P<.05, **=P<.001. P is from the bootstrap approach. 232
Figure 2.A. Mediating Effect of HEI2010 Component Scores on the Association between 233
Acculturation and BMI among MA Men 234
235
236
*=P<.05, **=P<.001. P is from the bootstrap approach. 237
Figure 2.B. Mediating Effect of HEI2010 Component Scores on the Association between 238
When stratifying gender groups, in men, sodium appeared have a statistically significant 240
mediating effect in the association between acculturation and BMI [indirect effect a2*a3=.01 (SE .00), 241
P<.05] (Table 3 and Figure 2.A.). The score of whole grains, however, was the only component that 242
significantly mediated the association between acculturation and BMI [indirect effect a2*a3=- .01 (SE 243
.00), P< .05] in MA women (Table 3 and Figure 2.B.). The overall and gender-specific models fit well 244
given the model fit indices were within threshold levels (i.e., Root mean square error 245
approximation (RMSEA) <0.1; Standardized root mean square residual (SRMSR) <.08; Comparative 246
fit index/Tucker Lewis Index (CFI/TLI)>.9) (Tables are not presented). 247
248
4. Discussion 249
The present study examined whether the HEI total or component scores mediate the 250
association between acculturation and BMI. To our knowledge, this study is among the first that 251
explored these relationships through path analyses. The study found that the HEI total score was 252
not a significant mediator of the acculturation-BMI association. However, HEI components of 253
whole grains and sodium were found to play a significant mediating role in the relationship of the 254
interest. The findings suggest that acculturation is positively associated with a higher score of 255
whole grains (reflects a higher level intake of whole grains) among men; it was also associated with 256
a lower score of sodium (reflects a higher level intake of sodium) among women. In other words, 257
compared to those who scored lower in acculturation, MA men with a higher degree of 258
acculturation may have a diet higher in whole grains, which is protective to BMI. Whereas among 259
women, compared to those less acculturated, those who are more acculturated may have a diet 260
higher in sodium, which is associated with higher BMI. 261
The association between acculturation and increased consumption of whole grains was 262
supported by studies targeting Hispanic populations in the U.S., including Mas [34, 35]. According 263
to Winkley et al., a greater level of acculturation, as measured by English fluency, was associated 264
with increased intake of whole-grain foods [32]. Liu et al. also found that generation status, 265
reflecting the level of acculturation, was associated with increased intake of whole grains, where the 266
second and third generations of MAs have significantly higher intake of whole grains as compared 267
to the first generation [35]. A significant inverse relationship between the intake of whole grains 268
and BMI has been reported previously [36]. Whole grains provide dietary fibers, which have 269
appetite-suppressant qualities that helps one feels satiated, thereby preventing unhealthy snacking 270
[37]. Moreover, the health effect of whole grains is also attributable to micronutrients, antioxidants 271
and non-nutritive dietary constituents such as phyto-estrogens in wheat bran, and beta-glucans in 272
oats [38]. 273
With respect to sodium intake, increased acculturation was found to be associated with its 274
increased consumption [11, 41, 44]. Behaviors associated with sodium consumption include eating-275
away-from-home, consumption of meals at fast-food outlets and consumption of salty snacks [11]. 276
Researchers have studied the link between sodium intake and weight gain [11, 39-41] and there are 277
several hypotheses for this association. Karppanen and Mervaala suggested that increasing intake 278
of sodium obligatorily produced a progressive increase in thirst [40]. The increase in salt intake may 279
contribute to increased intake of sugar sweetened or alcoholic beverages, which is a source of 280
excessive calories. Alternatively, a high level of sodium intake is correlated with a high 281
consumption of processed foods, which are generally of higher energy density [11, 39]. Most 282
sodium in the U.S. diet comes from commercially processed and restaurant foods [40]. According to 283
U.S. Centers for Disease Control and Prevention, more than seventy-five percent of sodium 284
Americans consume comes from processed and restaurant foods — not the salt shaker [43]. It has 285
fast-paced life in the U.S., or the pressure to integrate into American society by eating American 287
style fast-food [44]. Consequently, sodium intake may be a marker for consumption of unhealthy 288
processed foods, which may explain the link between high level of sodium intake and elevated 289
BMI. 290
No study that we are aware of that has conducted a similar mediation analysis by gender 291
groups. Using a gender-mixed sample, Flores et al. found that “refined foods and sweets” and 292
“diverse” dietary patterns were associated with increased risks for overweight and obesity, in 293
comparison to “traditional” dietary pattern [45]. It was reported that immigrant men consume fast 294
food more frequently than their female counterparts, possibly due to their preference of its ease and 295
convenience, and their cooking and time limitations [46]. Fast foods that contain excessive amount 296
of sodium and other unhealthy ingredients that are associated with weight gain. Wolongevicz et al. 297
found that a diet high in refined carbohydrates was associated with obesity in a women-only 298
sample [47]. Other studies suggested that intake of whole grains was related to lower odds of 299
obesity in both men and women [47, 48], though sample characteristics, dietary measurements and 300
analytical methods in those studies are not comparable to the current one. The limited findings 301
regarding specific HEI components and weight outcomes by gender group warrant more gender-302
specific analysis to explore the differences regarding diet quality and its association with weight 303
outcomes. 304
HEI total score was not a significant mediator in the acculturation-BMI association in the 305
current study. It was previously reported that HEI total score was inversely associated with body 306
fat in a sample of young men aged 21 to 35 years old [14]. The absence of significant difference may 307
be due to the different sample composition where the current one includes adults from all age 308
groups and focuses exclusively on MAs. Further, a challenging issue of using the HEI2010 total 309
score to predict BMI in MAs is that the relative contribution of the components to the total score is 310
possibly different in MAs from the general U.S. population [49]. It would be better to ascribe greater 311
weights to those items that affect BMI of MAs to a greater extent [49]. Research is therefore needed 312
to study the health effect of different HEI components in MAs and assign proper weights to them. 313
The statistically insignificant mediating effect of the HEI total score may be also due to other 314
unmeasured factors. Such factors could include the following: beliefs and norms regarding ideal 315
body images that are related to U.S. and/or Mexican culture [50]; food insecurity, a state in which 316
availability of nutritionally adequate foods or one’s ability to acquire food, is limited or uncertain 317
[51, 52]; or other contextual factors, such as density of a Hispanic/Latino population in a given 318
neighborhood, the history of migration to the U.S. and social network influences [11]. Indeed, it is 319
difficult to draw a clear pathway of acculturation-diet quality-BMI given that acculturation is 320
influenced, in part, by these contextual factors [11]. The close relationship between diet and BMI, as 321
well as the significant impact of acculturation on diet and weight changes, compelled us to examine 322
the acculturation-BMI path through diet quality. However, the study findings may also indicate 323
unexplained mechanism between acculturation and BMI. Additional studies are warranted to 324
assess the relative contributions of psychosocial and contextual factors of acculturation that account 325
for changes in BMI. 326
The study has several limitations. The study used cross-sectional data, which precludes 327
assessment of changes in diet quality and BMI in MAs over time. It is possible that some foreign-328
born participants had nutritionally poor diets and were overweight or obese before moving to the 329
U.S. The nutritional transition has been observed in Mexico, where processed food consumption 330
and away-from-home food intakes are rapidly increasing in urban areas and obesity rates and 331
related chronic conditions are following the trend [53]. A causal relationship between acculturation 332
and dietary changes cannot be established due to the cross-sectional nature of the data. In addition, 333
chronic diseases [49]. For example, the HEI-2010 considers alcohol above a threshold level 335
indicative of moderate drinking as empty calories. This approach does not directly address other 336
potential positive and negative biological effects of alcohol, nor does it account for specific 337
questions related to frequency of consumption and amounts consumed on drinking occasions. This 338
probably can serve as a reason why we did not detect the significant mediating effect of empty 339
calorie as expected. Further, the measure of acculturation was based on proxies of language, length 340
of stay and nativity. Even though they are well-validated measures in the literature and only 341
available acculturation information in NHANES data, they may not capture all aspects of culture 342
adaptation that impact diet and weight. Future studies should incorporate more comprehensive 343
scales to study the relationships between acculturation, diet quality and BMI. Further, potential 344
biases may exist in measuring diet. Underreporting by participants is common in nutritional 345
studies, especially among those who are overweight or obese [54]; thus, the potential bias toward 346
the null, resulting from underreporting was acknowledged. 347
348
5. Conclusions 349
The current study found HEI components of whole grains and sodium, appear to be 350
significant dietary mediators in the acculturation-BMI association. These results present insights 351
with respect to heterogeneity in the relative influence of HEI components on the path between 352
acculturation and BMI, adjusting sociodemographic and behavioral factors simultaneously. More 353
studies, especially perspective studies, are needed to further clarify the path of acculturation, diet 354
quality and BMI. 355
Acculturation is associated with increased consumption of whole grains, which may 356
contribute to a better weight status. Health messages may be important in delivering information to 357
those who are less acculturated with traditional preference for refined grains. The benefits of 358
including whole- and multi-grain foods in one’s diet should be empathized. Another strategy may 359
be to increase awareness of recent immigrants to the wide varieties of whole-grain alternatives, 360
such as whole-grain tortilla and whole-grain bread by highlighting their health benefits and flavor. 361
Promoting a moderation on sodium intake is also essential as it was found to be another 362
dietary mediator to acculturation and BMI. Promoting home cooking as a strategy for reducing 363
sodium intake may be particularly beneficial for MA men, who tend to consume more fast food and 364
have poorer cooking skills compared to MA women [44, 55]. It is also important to enhance the 365
understanding of food labels, of nutritional merits of different foods and of food preparation 366
methods and to incorporate this information into the dietary interventions. A regulatory approach 367
supporting the food industry in the reformulation of foods would also be necessary [56]. If these 368
efforts were implemented, they would reduce barriers for meeting the sodium intake guideline 369
when individuals consume commercially prepared foods. 370
371 372
Author Contributions: Conceptualization, Y.Y.; Methodology, Y.Y., T.S.T.; Software, Y.Y.; Validation, Y.Y.,
373
T.S.T., R.S., L.W., S.B., S.P., and E.J.S; Analysis, Y.Y.; Writing-Original Draft Preparation, Y.Y.; Writing-Review 374
& Editing, Y.Y., T.S.T., R.S., L.W., S.B., S.P., and E.J.S. 375
Funding: This research received no external funding.
376
Acknowledgments: none.
377
Conflicts of Interest: The authors declare no conflict of interest.
378
References 380
381
1. Akresh IR. Overweight and obesity among foreign-born and U.S.-born Hispanics. Biodemography Soc Biol. 382
2008;54(2):183-199. doi:10.1080/19485565.2008.9989141. 383
2. Wolin KY, Colangelo LA, Chiu BCH, Gapstur SM. Obesity and immigration among Latina women. J 384
Immigr Minor Heal. 2009;11(5):428-431. doi:10.1007/s10903-007-9115-1. 385
3. Barcenas CH, Wilkinson A V, Strom SS, et al. Birthplace, years of residence in the United States, and obesity 386
among Mexican-American adults. Obesity (Silver Spring). 2007;15(4):1043-1052. doi:10.1038/oby.2007.537 387
4. Oza-Frank R, Cunningham SA. The weight of US residence among immigrants: A systematic review. Obes 388
Rev. 2010;11(4):271-280. doi:10.1111/j.1467-789X.2009.00610.x. 389
5. Albrecht SS, Diez Roux A V., Aiello AE, Schulz AJ, Abraido-Lanza AF. Secular trends in the association 390
between nativity/length of US residence with body mass index and waist circumference among Mexican-391
Americans, 1988-2008. Int J Public Health. 2013;58(4):573-581. doi:10.1007/s00038-012-0414-5. 392
6. Guendelman SD, Ritterman-Weintraub ML, Fernald LCH, Kaufer-Horwitz M. Weight status of Mexican 393
immigrant women: A comparison with women in Mexico and with US-born Mexican American women. 394
Am J Public Health. 2013;103(9):1634-1640. doi:10.2105/AJPH.2012.301171. 395
7. Pérez-Escamilla R, Putnik P. The role of acculturation in nutrition, lifestyle, and incidence of type 2 diabetes 396
among Latinos. J Nutr. 2007;137(4):860-870. 397
8. Nicolaou M, Van Dam RM, Stronks K. Acculturation and education level in relation to quality of the diet: 398
A study of Surinamese South Asian and Afro-Caribbean residents of the Netherlands. J Hum Nutr Diet. 399
2006;19(5):383-393. doi:10.1111/j.1365-277X.2006.00720.x. 400
9. Pérez-Escamilla R. Acculturation, nutrition, and health disparities in Latinos. Am J Clin Nutr. 2011;93(5). 401
doi:10.3945/ajcn.110.003467. 402
10. Neuhouser ML, Thompson B, Coronado GD, Solomon CC. Higher fat intake and lower fruit and vegetables 403
intakes are associated with greater acculturation among Mexicans living in Washington State. J Am Diet 404
Assoc. 2004;104(1):51-57. doi:10.1016/j.jada.2003.10.015. 405
11. Ayala GX, Baquero B, Klinger S. A systematic review of the relationship between acculturation and diet 406
among Latinos in the United States: implications for future research. J Am Diet Assoc. 2008;108(8):1330-407
1344. doi:10.1016/j.jada.2008.05.009. 408
12. Monroe KR, Hankin JH, Pike MC, et al. Correlation of dietary intake and colorectal cancer incidence among 409
Mexican-American migrants: the multiethnic cohort study. Nutr Cancer. 2003;45(2):133-147. 410
doi:10.1207/S15327914NC4502_01. 411
13. Glanz K, Sallis JF, Saelens BE, Frank LD. Healthy nutrition environments: Concepts and measures. Am J 412
Heal Promot. 2005;19(5):330-333. doi:10.4278/0890-1171-19.5.330. 413
14. Sharma S, Murphy SP, Wilkens LR, et al. Adherence to the food guide pyramid recommendations among 414
African Americans and Latinos: Results from the multiethnic cohort. J Am Diet Assoc. 2004;104(12):1873-415
1877. doi:10.1016/j.jada.2004.08.033. 416
15. Beydoun MA, Gary TL, Caballero BH, Lawrence RS, Cheskin LJ, Wang Y. Ethnic differences in dairy and 417
related nutrient consumption among US adults and their association with obesity, central obesity, and the 418
metabolic syndrome. Am J Clin Nutr. 2008;87(6):1914-1925. doi:10.1016/j.drugalcdep.2008.02.002.A. 419
16. Drenowatz C, Shook RP, Hand G a, Hébert JR, Blair SN. The independent association between diet quality 420
and body composition. Sci Rep. 2014;4:4928. doi:10.1038/srep04928. 421
17. Jennings A, Welch A, van Sluijs EMF, Griffin SJ, Cassidy A. Diet quality is independently associated with 422
weight status in children aged 9-10 years. J Nutr. 2011;141(3):453-459. doi:10.3945/jn.110.131441. 423
18. Guenther PM, Casavale KO, Reedy J, et al. Update of the Healthy Eating Index: HEI-2010. J Acad Nutr Diet. 424
2013;113(4):569-580. doi:10.1016/j.jand.2012.12.016. 425
19. Tande DL, Magel R, Strand BN. Healthy Eating Index and abdominal obesity. Public Health Nutr. 426
2010;13(2):208-214. doi:10.1017/S1368980009990723. 427
20. Gao SK, Beresford SAA, Frank LL, Schreiner PJ, Burke GL, Fitzpatrick AL. Modifications to the healthy 428
eating index and its ability to predict obesity: The multi-ethnic study of atherosclerosis. Am J Clin Nutr. 429
21. Yoshida Y, Scribner R, Chen L, Broyles S, Phillippi S, Tseng TS. Diet quality and its relationship with central 431
obesity among Mexican Americans: findings from National Health and Nutrition Examination Survey 432
(NHANES) 1999–2012. Public Health Nutr 2017;20(7):1193–202. doi: 10.1017/S1368980016003190 433
22. Nicklas TA, Qu H, Hughes SO, He M, Wagner SE, Foushee HR, Shewchuk RM. Self-perceived lactose 434
intolerance results in lower intakes of calcium and dairy foods and is associated with hypertension and 435
diabetes in adults. Am J Clin Nutr. 2011; 94(1), 191-198. doi: 10.3945/ajcn.110.009860 436
23. Flegal KM, Carroll MD, Kit BK, Ogden CL. Prevalence of obesity and trends in the distribution of body 437
mass index among US adults, 1999-2010. JAMA. 2012;307(5):491-497. doi:10.1001/jama.2012.39. 438
24. Bowie JV, Juon H-S, Cho J, Rodriguez EM. Factors associated with overweight and obesity among Mexican 439
Americans and Central Americans: results from the 2001 California Health Interview Survey. Prev Chronic 440
Dis. 2007;4(1):A10. doi:A10 [pii]. 441
25. Wang Y, Beydoun MA. The obesity epidemic in the United States - Gender, age, socioeconomic, 442
racial/ethnic, and geographic characteristics: A systematic review and meta-regression analysis. Epidemiol 443
Rev. 2007;29(1):6-28. doi:10.1093/epirev/mxm007. 444
26. Wang J, Reininger BM, Cron S, Carroll D, Fisher-Hoch SP. Gender difference in obesity and preventive 445
health behaviors in an US-Mexico border Hispanic cohort. International Journal of Exercise Science, 2002, 446
6(2). 447
27. National Center for Health Statistics. About National Health and Nutrition Examination Survey. 448
http://www.cdc.gov/nchs/nhanes/about_nhanes.htm. Accessed April 20, 2018. 449
28. National Center for Health Statistics. National Health and Nutrition Examination, Anthropometry 450
Procedure Manual. http://www.cdc.gov/nchs/data/nhanes/nhanes_07_08/manual_an.pdf. Accessed April 451
20, 2018. 452
29. Kandula NR, Diez-Roux A V., Chan C, et al. Association of acculturation levels and prevalence of diabetes 453
in the multi-ethnic study of atherosclerosis (MESA). Diabetes Care. 2008;31(8):1621-1628. doi:10.2337/dc07-454
2182. 455
30. U.S. Department of Agriculture. The USDA Center for Nutrition Policy and Promotion. The Healthy Eating 456
Index 2010. https://www.cnpp.usda.gov/healthyeatingindex. Accessed April 20, 2018. 457
31. U.S. Department of Health and Human Services. 2008 Physical activity guidelines for Americans. 458
http://health.gov/paguidelines/guidelines/adults.aspx. Accessed May 20, 2016. 459
32. Ditlevsen S, Christensen U, Lynch J, Damsgaard MT, Keiding N. The mediation proportion: a structural 460
equation approach for estimating the proportion of exposure effect on outcome explained by an 461
intermediate variable. Epidemiology. 2005;16:114–120 462
33. Beydoun M a, Wang Y. How do socio-economic status, perceived economic barriers and nutritional benefits 463
affect quality of dietary intake among US adults? Eur J Clin Nutr. 2008;62(3):303-313. 464
doi:10.1038/sj.ejcn.1602700. 465
34. Winkleby MA, Albright CL, Howardpitney B, Lin J, Fortmann SP. Hispanic/White Differences in Dietary 466
Fat Intake Among Low Educated Adults and Children. Prev Med (Baltim). 1994;23(4):465-473. 467
doi:10.1006/pmed.1994.1064. 468
35. Liu J-H, Chu YH, Frongillo EA, Probst JC. Generation and acculturation status are associated with dietary 469
intake and body weight in Mexican American adolescents. J Nutr. 2012;142(2):298-305. 470
doi:10.3945/jn.111.145516. 471
36. Albertson AM, Reicks M, Joshi N, Gugger CK. Whole grain consumption trends and associations with body 472
weight measures in the United States: results from the cross sectional National Health and Nutrition 473
Examination Survey 2001-2012. Nutr J. 2016;15(1):8. doi:10.1186/s12937-016-0126-4. 474
37. Cioffi I, Santarpia L, Vaccaro A, et al. Whole-grain pasta reduces appetite and meal-induced thermogenesis 475
acutely: a pilot study. Appl Physiol Nutr Metab = Physiol Appl Nutr Metab. 2016;41(3):277-283. 476
doi:10.1139/apnm-2015-0446. 477
38. King DE. Dietary fiber, inflammation, and cardiovascular disease. Mol Nutr Food Res. 2005;49(6):594-600. 478
doi:10.1002/mnfr.200400112. 479
39. Brown IJ, Tzoulaki I, Candeias V, Elliott P. Salt intakes around the world: Implications for public health. 480
Int J Epidemiol. 2009;38(3):791-813. doi:10.1093/ije/dyp139. 481
40. Karppanen H, Mervaala E. Sodium Intake and Hypertension. Prog Cardiovasc Dis. 2006;49(2):59-75. 482
41. Pufal MA, Moulin CC, Casagrande DS, et al. Prevalence of overweight in children of obese patients: A 484
dietary overview. Obes Surg. 2012;22(8):1220-1224. doi:10.1007/s11695-012-0641-0. 485
42. Ahuja JKC, Pehrsson PR, Haytowitz DB, et al. Sodium monitoring in commercially processed and 486
restaurant foods. Am J Clin Nutr. 2015;101(3):622-631. doi:10.3945/ajcn.114.084954. 487
43. U.S. Centers for Disease Control and Prevention. Sodium and Food Sources. 488
http://www.cdc.gov/salt/food.htm. Accessed May 20, 2016. 489
44. Lindberg NM, Stevens VJ. Immigration and weight gain: Mexican-American women’s perspectives. J 490
Immigr Minor Heal. 2011;13(1):155-160. doi:10.1007/s10903-009-9298-8. 491
45. Flores M, Macias N, Rivera M, et al. Dietary patterns in Mexican adults are associated with risk of being 492
overweight or obese. J Nutr. 2010;140(10):1869-1873. doi:10.3945/jn.110.121533. 493
46. Jasti S, Lee CH, Doak C. Gender, acculturation, food patterns, and overweight in Korean immigrants. Am 494
J Health Behav. 2011;35(6):734-745. doi:10.5993/AJHB.35.6.9. 495
47. Wolongevicz DM, Zhu L, Pencina MJ, et al. Diet quality and obesity in women: the Framingham Nutrition 496
Studies. Br J Nutr. 2013;103(8):1223-1229. doi:10.1017/S0007114509992893.Diet. 497
48. Montez JK, Eschbach K. Country of Birth and Language Are Uniquely Associated with Intakes of Fat, Fiber, 498
and Fruits and Vegetables among Mexican-American Women in the United States. J Am Diet Assoc. 499
2008;108(3):473-480. doi:10.1016/j.jada.2007.12.008. 500
49. Waijers PMCM, Feskens EJM, Ocké MC. A critical review of predefined diet quality scores. Br J Nutr. 501
2007;97(2):219-231. doi:10.1017/S0007114507250421. 502
50. Warren CS, Gleaves DH, Cepeda-Benito A, Fernandez MDC, Rodriguez-Ruiz S. Ethnicity as a protective 503
factor against internalization of a thin ideal and body dissatisfaction. Int J Eat Disord. 2005;37(3):241-249. 504
doi:10.1002/eat.20102. 505
51. Leung CW, Epel ES, Ritchie LD, Crawford PB, Laraia BA. Food Insecurity Is Inversely Associated with Diet 506
Quality of Lower-Income Adults. J Acad Nutr Diet. 2014;114(12):1943-1953. doi:10.1016/j.jand.2014.06.353. 507
52. Martinez AD, Juon H, Levine DM, Lyford-Pike V, Peters S. The association between nutrition transition 508
score and measures of obesity: Results from a cross-sectional study among Latina/o immigrants in 509
Baltimore. Global Health. 2014;10:57. doi:10.1186/1744-8603-10-57. 510
53. Popkin BM, Adair LS, Ng SW, et al. Global nutrition transition and the pandemic of obesity in developing 511
countries. Nutr Rev. 2012;70(1):3-21. doi:10.1111/j.1753-4887.2011.00456.x. 512
54. Fisher JO, Johnson RK, Lindquist C, Birch LL, Goran MI. Influence of body composition on the accuracy of 513
reported energy intake in children. Obes Res. 2000;8:597-603. doi:10.1038/oby.2000.77. 514
55. Larson NI, Neumark-Sztainer D, Hannan PJ, Story M. Family Meals during Adolescence Are Associated 515
with Higher Diet Quality and Healthful Meal Patterns during Young Adulthood. J Am Diet Assoc. 516
2007;107(9):1502-1510. doi:10.1016/j.jada.2007.06.012. 517
56. Institute of Medicine, Dietary Reference Intakes for Water, Potassium, Sodium, Chloride, and Sulfate, 2005. 518