A NEW TESTING SETUP FOR ANCHOR BOLT CONNECTIONS
UNDER DYNAMIC EARTHQUAKE LOADING
Andreas Faecke1, Franz-Hermann Schlueter2, Nico Herrmann3, Harald S. Mueller4
1Project Engineer, SMP Ingenieure im Bauwesen GmbH, Karlsruhe, Germany ([email protected])
2Manager of SMP Ingenieure im Bauwesen GmbH, Karlsruhe, Germany
3Vice-President, Materials Testing and Research Institute (MPA Karlsruhe), Karlsruhe Institute of
Technology (KIT), Karlsruhe, Germany
4President, Materials Testing and Research Institute (MPA Karlsruhe), Karlsruhe Institute of Technology
(KIT), Karlsruhe, Germany
ABSTRACT
While the pure load bearing capacity of metal anchors is part of approval tests, the complete system consisting of anchors, anchor plate and the attached component itself has not yet been investigated in detail. For a dynamic excitation (earthquake) effects like movements between concrete and anchor plate, shifting of contact forces during dynamic loading, displacements of anchors and dynamic pounding of anchor plate between bolt head and concrete ground with their influence on the dynamic response of the attached components and load bearing capacity of connections are not well understood. There is need for a systematic investigation of the complete system with the interaction between all its components. Against this background a full scale experimental setup will be developed and realized at the Materials Testing and Research Institute (MPA Karlsruhe) at the Karlsruhe Institute of Technology (KIT) in cooperation with SMP Ingenieure im Bauwesen GmbH in the framework of a Federal Ministry of Economics and Technology (BMWi) sponsored project managed by the project executing part of GRS (Gesellschaft für Anlagen- und Reaktorsicherheit mbH). The test setup will allow for dynamic excitation of a fixing with a detailed monitoring of forces, displacements and deformations in anchors, anchor plate and equipment. For an optimization of the test setup preliminary dynamic finite element simulations are performed considering nonlinear effects like pounding of anchor plate and shifting of contact forces. The numerical and experimental results will be compared to actual design practice.
INTRODUCTION
The failure of some post-installed anchors at one fastening after a regular shutdown of a nuclear power plant in Germany in 2006 and the detection of deficiencies of installed anchors during a subsequent check-up has raised attention on fastenings and has revealed safety related questions. The use of undercut metal anchors is a common practice for post installation of safety related constructional elements or mechanical components. Therefore high demands have to be imposed on the design and the installation of these fixings. The proper load bearing capacity and serviceability has to be provided for normal operation conditions as well as for accidental design situations including earthquake excitation where large static and dynamic forces may be accompanied by large and/or cyclic crack openings in the fixing ground (concrete) and progressive pull out of anchor bolts.
a rigid fixture [ETAG 001]. The calculated anchor forces are based on floor response spectra, the eigenfrequency of the component and its damping only. In the framework of a Federal Ministry of Economics and Technology (BMWi) sponsored project managed by the project executing part of GRS (Gesellschaft für Anlagen- und Reaktorsicherheit mbH) it will be investigated if nonlinear effects have a significant influence on the forces of fixtures and the dynamic behavior of the component. Numerical simulations and experimental tests will be performed considering the complete system that consists of the anchor ground, anchors, anchor plate and component.
In this report the nonlinear finite element model and the new experimental testing setup will be described. First numerical simulations with dynamic loading from periodic forced vibrations and seismic excitation have been performed. These results will be presented which already show a significant influence of anchor pull out on the dynamic behavior of the component-fixture system with a reduction of the free vibration frequency and an immission of higher frequencies on the component.
EXPERIMENTAL SETUP
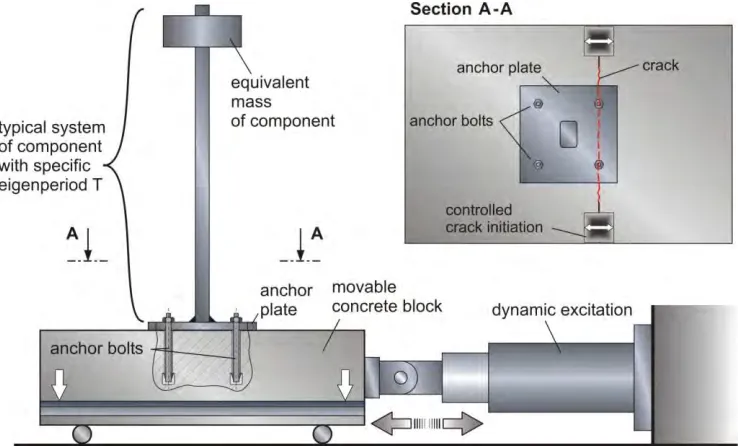
Figure 1 outlines the testing setup that consists of the anchors, the anchor plate with a single mass oscillator representing the component and a concrete block representing the anchor ground. The concrete strength will be C30/37 and the edges will be slightly reinforced. During a seismic event larger cracks are to be expected in concrete. For this reason cracks with constant width can be imposed at the concrete block. This is in general connected with a limited anchor pull out and possible slippage of the anchor plate. In contrast to regular tests the loading is not applied directly and quasi statically at the anchors but indirectly by an actuator at the concrete block. This actuator allows for e.g. a dynamic harmonic excitation. In this way it is possible to investigate the nonlinear effects due to a limited anchor pull out in a most realistic way.
Typical fixtures of components in nuclear power plants that were also used for seismic loading are the undercut anchors HDA-T M12x125 and HDA-T M16x190 from Hilti Corporation [ETA-99/0009]. These anchors are approved for seismic loading conditions in cracked concrete. All dimensions of the testing setup are adjusted to the dimensions and load capacities of these undercut anchors. The size of the anchor plate is mainly a result of the minimum distance between the selected anchors under consideration of typical tolerance fields in order to avoid reinforcement collisions.
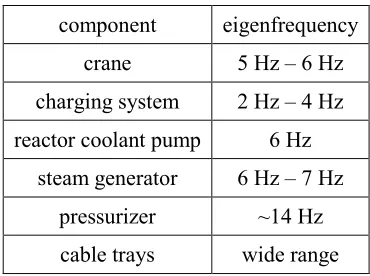
Table 1: Typical eigenfrequency of power plant components.
component eigenfrequency
crane 5 Hz – 6 Hz
charging system 2 Hz – 4 Hz
reactor coolant pump 6 Hz
steam generator 6 Hz – 7 Hz
pressurizer ~14 Hz
cable trays wide range
eigenfrequency range of important components in nuclear power plants. Higher eigenfrequencies of components than the fundamental eigenfrequency have in general no influence on the response. Hence for the investigations it is sufficient to represent the component by a single mass oscillator. That oscillator consists of a steel profile and a component mass. The mass can be changed respectively shifted along the steel profile in order to change the dynamic behavior of the oscillator.
The monitoring concept will mainly include accelerometers at the component mass, and concrete block, displacement sensors between anchor plate and concrete as well as anchor plate and anchors and strain gauges at different locations of the concrete and steel beam.
Figure 1. Front view and section of experimental setup with hydraulic excitation cylinder.
NUMERICAL MODEL AND SIMULATION PROCEDURE
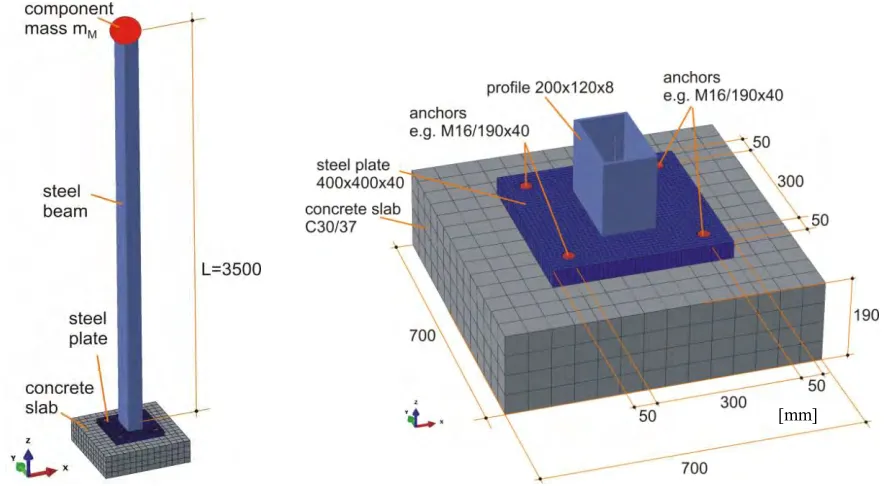
Figure 2. View of the complete model (left) and detail view of lower part with anchor plate (right).
Figure 3. Detail view of the dowels of concrete with interaction.
The dynamic excitation is applied at the boundary conditions. The simulations have been performed with the implicit direct integration analysis in ABAQUS/Standard. In order to capture potential high frequency effects of pounding between plate and concrete a short time step of 2 ms had to be selected according to a convergence study. In general the explicit time integration is more efficient for very short term and discontinues events. However, a long duration of 15 s had to be considered for the earthquake simulations and a duration of approximately 10 s had to be considered for the periodic excitation in order to eliminate the transient oscillation at the start, respectively. That again made the implicit analysis more efficient.
HARMONIC FORCED EXCITATION
In a first study the response of the system on a constant harmonic forced vibration is investigated for different gap sizes. In this report the results of a single direction excitation (x-direction) are presented. The free vibration after excitation is investigated, too. Based on the attenuation performance the free response vibration frequency and the effective damping can be evaluated for the nonlinear system with different gaps. In order to better comprehend the results of the nonlinear simulations the response of a comparable linear elastic system is calculated based on an analytical procedure. The response of a component can easily be gained by an analytical procedure as follows. The circular eigenfrequency of a
single mass oscillator is based on the stiffness k and the mass mA of the component:
A
k 159 18.471
m 0.466 s
(1)
The mass was selected with 466 kg and the stiffness of a single mass oscillator is based on a cantilever beam with a single force at the end:
8
3 3
EI 210000 1079 10 MN
k 3 3 0.159
m
L 3.5
(2)
The calculated eigenfrequency is f = / 2 = 18.47 / 2 = 2.94 Hz. However, the actual
resonance frequency measured from attenuation oscillation at the simulation yields only 2.78 Hz. This is mainly due to the mass of the beam profile and due to the limited stiffness of the anchor plate that were not considered in the calculation. The magnification factor V for forced harmonic excitation at the support is the ratio between amplitude of excitation and amplitude of response. It depends on the ratio of the
circular excitation frequency to the circular eigenfrequency of the oscillator. At the simulations an
excitation frequency of 2.33 Hz and a damping of = 1% was selected. That leads to the following factor:
2
2
2
2
2
21 1
V 3.326
1 0.837 2 0.01 0.837
1 2
(3)
Hence, with an excitation amplitude of 7.72 m/s² a response amplitude of 25.7 m/s² has to be expected for the selected oscillator based on linear elastic behavior.
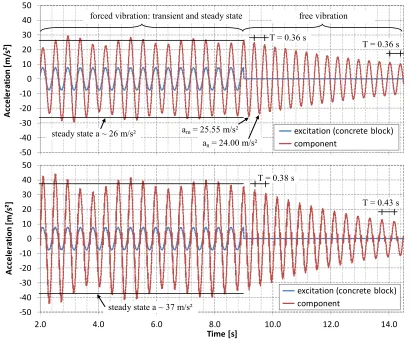
Dynamic simulations with the above described finite element model with different gap sizes have been performed. The acceleration time histories of the excitation and the response for the model with 0.0 mm gap and for the model with 1.0 mm gap are depicted in Figure 4 as an example. In the first 9.5 s a constant harmonic excitation with the same amplitude and frequency was selected as in the analytical calculation. As Figure 4 implies, the vibration during that time frame consists of a slightly transient vibration. In order to get the pure steady state vibration the duration of the harmonic excitation should be increased. However, the steady state can already be well estimated and is A = ~26 m/s² at the 0.0 mm gap model which is in good agreement to the analytical value of 25.7 m/s². Subsequently the excitation was stopped and the free vibration of the system was simulated for 5 more seconds. At that time frame the free vibration frequency can be measured between two consecutive peaks which yields f = 1 / 0.36 = 2.78 Hz for the 0.0 mm gap model. Also the damping of the system can be calculated based on the attenuation of
the free vibration. Using two consecutive amplitude values am and an at the 0.0 mm model yields the
2 2D 0.010
2
(4)
This evaluation has been done at the beginning of the free vibration and at the end of the simulated free vibration. For the 0.0 mm gap model the vibration frequency and the damping does not change. This evaluation has been done for the models with 0.5 mm, 1.0 mm, 2.0 mm gap models, too. It can be seen in Table 2 that the amplitude increases with gap size. However this is only an indirect effect. Primarily the frequency of free vibration of the nonlinear systems decreases. Furthermore it is not constant but it changes with amplitude with smaller frequencies at decreasing amplitude. By applying the decreased frequency of free vibration into the analytical approach the increase of acceleration amplitude becomes clear – the frequencies of excitation and free vibration come closer and the amplification factor increases. Notable is that the analytical approach exactly predicts the response of the nonlinear system based on the free vibration frequency.
-50 -40 -30 -20 -10 0 10 20 30 40 50
2.0 4.0 6.0 8.0 10.0 12.0 14.0
A cc e le ra ti o n [ m/ s² ] Time [s]
excitation (concrete block) component -50 -40 -30 -20 -10 0 10 20 30 40 50
2.0 4.0 6.0 8.0 10.0 12.0 14.0
A cc e le ra ti o n [ m/ s² ] Time [s]
excitation (concrete block) component
Figure 4. Time histories of acceleration at 0.0 mm (top) and 1.0 mm gap model (bottom).
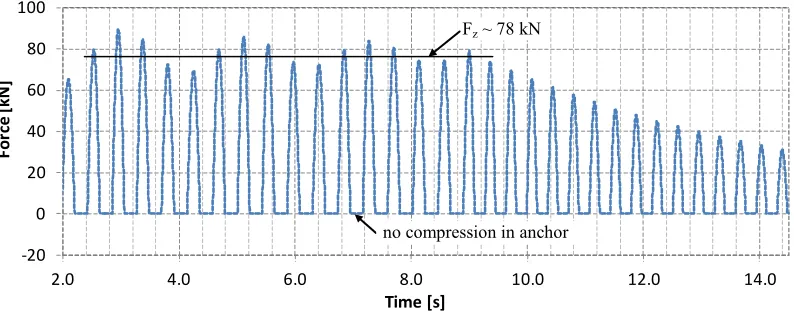
The force in one representative anchor is given in Figure 5. The tension force periodically increases while no compression force develops which is correct. The maximum steady state force acc. to
the simulation is Fz = 78 kN. Because the anchor force Fz is a function of the known horizontal inertia
force FH = a ∙ mM at the component and the known mass eccentricity L, the actual inner lever arm B at the
anchor plate can be calculated:
forced vibration: transient and steady state
steady state a ~ 26 m/s²
free vibration
steady state a ~ 37 m/s²
am = 25.55 m/s²
an = 24.00 m/s²
T = 0.36 s
T = 0.38 s
H z F
1 1 25.7 0.466
B L 3.5 0.27 m
2 F 2 78.0
(4)
This is a rough approximation and does not consider potential dynamic impact effects on the anchor force which will be investigated in a next step.
-20 0 20 40 60 80 100
2.0 4.0 6.0 8.0 10.0 12.0 14.0
Fo
rc
e
[kN
]
Time [s]
Figure 5. Force time histories at one anchor at the 0.0 mm gap model.
Table 2: Main results for periodic excitation of models with different gap sizes.
gap eff,1 [%]
eff,2 [%]
feff,1
[Hz] feff,2
[Hz] [-]
V [-]
analytic
a [m/s²]
simulation a [m/s²]
0.0 mm 1.0 1.0 2.78 2.78 0.837 3.326 25.7 ~26
0.5 mm 1.1 1.4 2.68 2.53 0.919 3.996 30.8 ~31
1.0 mm 1.2 1.3 2.61 2.31 0.890 4.766 36.8 ~37
2.0 mm 1.3 1.7 2.55 2.19 0.913 5.934 45.8 ~48
3.0 mm 1.4 1.7 2.50 2.17 0.930 7.289 56.3 ~56
SEISMIC TIME HISTORY ANALSYS
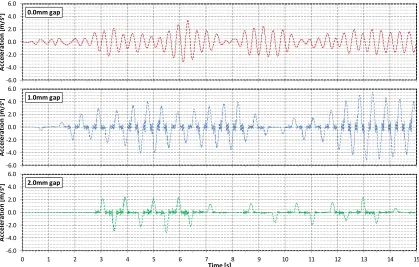
In this chapter the influence of the gap size on the seismic response is investigated. The seismic input is given in terms of a floor response spectrum (called secondary spectrum) acc. to Figure 6. A time history has been generated based on that floor response spectrum. For checking purposes the spectrum of the time history is compared to the floor response spectrum which is in good agreement. Again a time history analysis has been performed in order to get the response of the component at different gap sizes. Figure 7 depicts the acceleration response of the component mass from the simulations. It can be seen that the character of the curves highly differ from each other. While the 0.0 mm gap response is almost based on one sine wave the other two models result in an irregular response with half sine waves in unequal distances and with high frequency vibrations in between.
Fz ~ 78 kN
0.0 1.0 2.0 3.0 4.0 5.0
0.1 1 10 100
Sp e c tr a l a c c e le ra ti o n [m /s ²] Frequency [Hz]
design response spectrum spectrum of time history
Figure 6. Secondary design response spectrum of seismic input of time history analysis.
-6.0 -4.0 -2.0 0.0 2.0 4.0 6.0
0 1 2 3 4 5 6 7 8 9 10 11 12 13 14 15
A cc el er at io n [m/ s² ] Time [s] 0.0mm gap -6.0 -4.0 -2.0 0.0 2.0 4.0 6.0
0 1 2 3 4 5 6 7 8 9 10 11 12 13 14 15
A cc el er at io n [m/ s² ] Time [s] 1.0mm gap -6.0 -4.0 -2.0 0.0 2.0 4.0 6.0
0 1 2 3 4 5 6 7 8 9 10 11 12 13 14 15
A cc el er at io n [m/ s² ] Time [s] 2.0mm gap
Figure 7. Seismic response: Time acceleration history of component for different gaps.
Table 3: Comparison of maximum seismic response acceleration for different gaps from simulations
gap 0.0 mm 1.0 mm 2.0 mm 3.0 mm
asimul 3.413 m/s² 5.54 m/s² 3.253 m/s² 3.411 m/s²
asimul / Sa(T = 2.78 s) 0.91 1.48 0.87 0.91
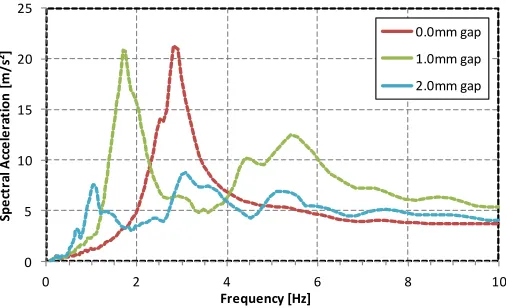
Figure 8 shows the spectra of the component response acceleration time histories for different gap sizes. These spectra are called tertiary response spectra and they may be used for the design of important components themselves. The response spectrum of the model with 0 mm gap has expectedly only one distinct peak at 2.78 Hz which is the effective eigenfrequency of the system. The 1 mm gap model again shows one distinct peak that is, however, at a lower frequency of 1.71 Hz. As mentioned above, the nonlinear model has no specific eigenfrequency but a free vibration response frequency that is not only dependent on the system but is also dependent on the response amplitude. At the actual response amplitude the free vibration frequency is obviously 1.71 Hz. Remarkable is a second peak at approximately 5 Hz which can be recognized in the time history near to the zero displacement passages, too. This obviously comes from a pounding effect of the anchor plate between anchor bolt head and concrete. The distinct peak vanishes more and more and further peaks are distributed on different frequencies at models with larger gaps as can representatively be seen at the 2 mm gap model.
0 5 10 15 20 25
0 2 4 6 8 10
Spe
ct
ra
l A
cc
e
le
ra
ti
on
[
m
/s
²]
Frequency [Hz]
0.0mm gap 1.0mm gap 2.0mm gap
Figure 8. Tertiary spectra of the component response for different gaps (5% damping).
CONCLUSION
A new testing setup of post-installed connections is described that was developed for a systematic investigation of the seismic performance of the complete dynamic and potentially nonlinear system. Nonlinearity mainly arises from cracked concrete that is connected with limited pull out of the anchor. The setup comprises the anchors, the anchor plate with a single mass oscillator representing the component and the concrete ground. Cracks with constant width can be imposed at the concrete ground. In contrast to regular tests the action is not applied directly and quasi statically at the anchors but indirectly by a dynamic excitation of the concrete ground. In this way it is possible to investigate potential effects due to limited anchor pull out.
nonlinear behavior of the anchor. The component is a single mass oscillator and the interaction between anchor plate and concrete is realized by contact surfaces. In this way it is possible to investigate effects due to anchor pull out and lateral sliding of the anchor plate. First results of the simulations with an anchor pull out of up to 3 mm are presented. The dynamic behavior of the system significantly changes with anchor pull out. Especially the frequency of free vibration significantly decreases compared to the system with no pull out and a vibration at a frequency of approximately 5 Hz is induced at the investigated system due to a pounding of the anchor plate. This affects the anchor forces and the dynamic impact on the component itself compared to the actual design procedure that is based on linear elastic procedures.
Further numerical simulations will be performed in order to investigate the influence of anchor pull out on the dynamic system response in more detail. A sliding of the anchor plate on the concrete ground will be investigated, too. First experiments with the new testing setup will be performed soon and will be compared to the numerical findings.
REFERENCES
ETAG 001 “Guideline for European Technical Approval of Metal Anchors for use in Concrete”, Part 1 “General” (Edition 1997, endorsed 2007)
ETAG 001 “Guideline for European Technical Approval of Metal Anchors for use in Concrete”, Part 3 “Undercut Anchors” (Edition 1997, endorsed 2010)
ETAG 001 “Guideline for European Technical Approval of Metal Anchors for use in Concrete”, Annex C “Design Methods for Anchorages” (Edition 1997, endorsed 2010)
ETA-99/0009 “Hilti HDA and HDA-R”, Hilti AG, Business Unit Anchors - FL-9494 SCHAAN - Principality of Liechtenstein from 25/03/2008 to 25/03/2013
DIBt Leitfaden 2010, Leitfaden für Dübelverbindungen in Kernkraftwerken und anderen kerntechnischen Anlagen, Deutsches Institut für Bautechnik, June 2010