DFT simulations of the vibrational spectrum and hydrogen bonds of
ice XIV
Kai Zhang, Peng Zhang*, Ze-Ren Wang, Xu-Liang Zhu, Ying-Bo Lu, Cheng-Bo
Guan, Yanhui Li
School of Space Science and Physics, Shandong University, Weihai, 264209, China
Abstract
It is always a difficult task to assign the peaks recorded from vibrational spectrum.
Herein we explored a new pathway of density functional theory (DFT) simulation to
present three kinds of spectra of ice XIV and can be referenced as inelastic neutron
scattering (INS), IR, and Raman experimental spectrum. The INS spectrum is
proportional to phonon density of states (PDOS) while the photon scattering signals
reflect the normal vibration frequencies near the Brillouin zone (BZ) center. Based on
good agreements with experimental data, we identified the relative frequency and made
scientific assignments by normal vibration modes analysis. The debating two hydrogen
bond (H-bond) peaks among ice phases from INS have been discussed and the dynamic
process of H-bond vibrations were found to be classified into two basic modes. we
deduce that two H-bond modes are a general rule among ice family and more works are
ongoing to investigate this subject.
Keywords: ice XIV, vibrational spectrum, hydrogen bond, CASTEP, first-principles,
DFT
1.
Introduction
Water is not only an essential resource for the survival of all life, but also the most
important part of living organisms. The solid state of water, ice, has been discovered
more than 19 different crystal phases and amorphous structures under certain pressure
and temperature [1-10]. Usually they are paired of ordered and
hydrogen-disordered and can transform each other at specific ambient condition. To facilitate the
study of normal vibration modes of ice, a hydrogen-ordered structure is beneficial to
calculation and presents the main physical features due to its simple primitive cell [12].
In 1998, Lobban and co-workers first reported the identification of a new ice phase
named ice XII that crystallized at 260 K and 0.55 GPa [7]. In 2006, Salzmann et al.
found that ice XII doped with HCl would transform into a new hydrogen-ordered phase
upon cooling under pressure, which was called ice XIV with space group P212121
symmetry [8,13]. Later, Raman spectrum and inelastic neutron scattering of ice
XIV/XII have been reported [14-19].
In spite of many references presented experimental vibrational spectra of ice XIV/XII,
theoretically method to assign the peaks is lack of report till now. Herein we calculated
the most stable XIV structure by using first-principles density functional theory (DFT)
to manifest the vibrational spectrum assisted by normal vibrational modes analysis.
2.
Computational Methodology
Based on DFT method of quantum mechanics, the CASTEP [20] code is used to
perform geometric optimization and phonons calculation on structure of ice XIV.
optimization. The energy and SCF tolerance should take the minimum values for
phonons calculation. The energy cutoff is 750 eV, and the K-point grid is 2 2 3
in the reduced BZ. The norm-conserving pseudo potentials are used to calculate the
PDOS and polarizability. The environmental pressure is set as 0.55 GPa.
3.
Results and Discussion
The computational spectra of Raman, IR and PDOS are ranked in Fig.1 by four
separate bands. Because the spectrum intensities of Raman and IR have a quite large
scale, the relative proportions of two spectra in each band have been adjusted for
comparisons. The PDOS spectrum as well as normal vibration frequencies are
calculated after precise geometry optimization. In theory, the spectrum by INS is
proportional to PDOS, whilst the photon scattering can only collect signals near BZ
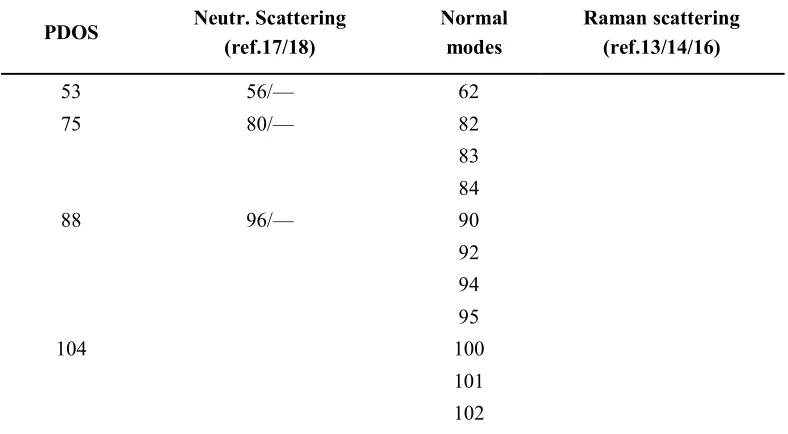
center. Table 1 presents comparisons of the PDOS against neutron scattering, and the
normal vibration frequencies against Raman scattering. Since ice XIV is
hydrogen-ordered phase of ice XII, the spectrum of XIV shows pronounced features than XII.
Both of the Raman spectra of ice XIV and XII then could be used for peaks assignement.
There are 12 molecules in a primitive cell of ice XIV. Thus the number of optic normal
modes is 12×3×3-3=105. Each band of the spectrum is discussed in detail as follows.
Table 1. Comparison of calculated results with Raman and INS data. The main peak of PDOS in the first column is compared against INS spectrum. The frequencies of 105 normal vibration modes are compared with the Raman data. The unit of data is cm-1.
PDOS Neutr. Scattering (ref.17/18)
Normal modes
Raman scattering (ref.13/14/16)
53 56/— 62
75 80/— 82
83 84
88 96/— 90
92 94 95
104 100
113 104
128 127
128 129
142 138
153
159 160/— 154
166 162
169 176
178 214/195/192
188 192/— 192
193 194
199 —/~208 199
209
226 211 241/—/—
248 236
277 314/—/—
279 279
288 —/~288 289
292
504 ~464/— 502
512 510
518 462/470/490
523
524 488/—/—
543 545
563 ~560/— 570
583 527/—/—
585 562/553/—
593 591
612 613
620 625 631 632
639 ~632/— 642
643
671
688 684
695 701
705 702
725 724
729
748 733
757 ~760/— 751
777 790
796 798 790/—/—
817 817
846 845
853
876 874
903 ~904/— 891 867/—/—
930 932
933 1647 1661
1665 1663
1668 1669 1671
1687 1684
1693 1705
1720 1722
1727 1725
1734 1735
3234 3214/3209/3215
3238 3235
3260 3269 3317/3310/—
3283 3275
3302 3322
3333 3334
3343 3326/—/—
3351
3358 3352
3376 3377 ~3348/—/— 3390
3395 3368/—/—
3400 3398
3402
3411 3411
3447
3449 3450
3451 ~3407/3415/3410
3458 3465 3467
3473 3470
3478
The stretching band is the region of O-H covalent bond stretching. There are 24
normal vibration modes and the frequencies of mode range from 3234 cm-1 to 3478 cm
-1. Each molecule has two kinds of vibration: symmetric stretching and asymmetric
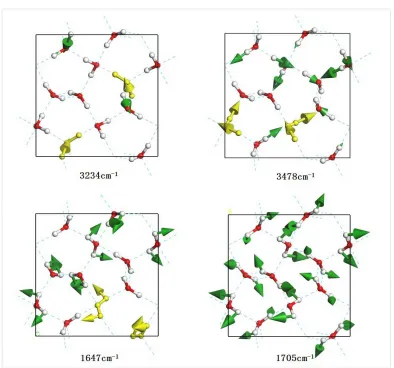
stretching. As shown in Fig. 2, there are two molecular vibration images corresponding
to the minimum and maximum vibration frequencies, respectively. This is a top view
and the green arrows represent the vibration direction in sizes proportional to the
vibration amplitude. For the minimum mode at 3234 cm-1, there are four molecules
present symmetric stretching vibration, two examples are illustrated in gold. It has been
found for ice XV that some modes include the isolated vibration of only one O-H bond
while the other one does not vibrate [22]. This is a similar case in ice XIV. We attribute
this exotic phenomenon to geometry deformation of local tetrahedron structure under
pressure. Almost all molecules are asymmetric stretching at 3478 cm-1, which
asymmetric stretching. To maintain a static center of mass, the vibrations of molecule
are correlated in a primitive cell. An obvious phenomenon is that Raman and IR
spectrum are more sensitive to symmetric stretching. From the spectrum of Fig.1, one
can see several distinct peaks in the symmetric stretching region due to the restrictions
of selection rules.
Figure 2. A top view of four normal vibration modes in stretching band (3234 cm-1,
3478 cm-1) and bending band (1647 cm-1, 1705 cm-1), respectively. Typical vibrations
are represented in gold. The green arrows represent the vibration direction in sizes proportional to the vibration amplitude.
Salzmann et al. recorded the Raman spectrum of recovered hydrogen ordered ice
XIV and identified the vibration modes by deuterated method [14].By comparison, they
-1 and ~3407 cm-1 are good agreement with this work at 3234 cm-1、3269 cm-1、3343
cm-1、3375 cm-1、3395 cm-1、3451 cm-1 (Table 1). They reported that the peak at 2480
cm-1 of D2O was not observed at 2480×1.35=3348 cm-1 in H2O of ice XIV. According
to Fig. 1, we found that the peak should be at 3377 cm-1 (normal mode). Salzmann et
al. also performed Raman spectrum of ice XII [14],of which peaks at 3209 cm-1、3310
cm-1、3340 cm-1、3415 cm-1 are consistent with normal mode at 3234 cm-1, 3269 cm
-1, 3375 cm-1, 3451 cm-1, respectively.
In the intramolecular bending vibration band, there are 12 normal vibration modes
ranging from 1647 cm-1 to 1735 cm-1. Considering a collective vibration, all the bending
modes can be classified as in-phase and out-of-phase vibrations. Fig.2 shows two
bending vibration images at frequencies of 1647 cm-1 and 1705 cm-1. The molecules in
gold at 1647 cm-1 shows a pair of out-of-phase modes. According to our previous work,
we found that the energy increasing trend is from in-phase bending to out-of-phase
bending. However, for the case of ice XIV, the lowest mode at 1647 cm-1 shows four
pairs of out-of-phase vibrations. The vibration mode at 1705 cm-1 shows in-phase
vibrating of all molecules. Although the simulated Raman and IR spectrum both contain
a peak at 1663 cm-1, the intensity is too weak to be detected IR.
As for the intermolecular librational band, there are 36 normal modes and the
frequencies range from 502 cm-1 to 933 cm-1. In this region, all the molecular vibration
modes could be classified into three types: rocking, twisting, and wagging. A rocking
mode is oscillating in plane whilst a wagging is oscillating perpendicular to the
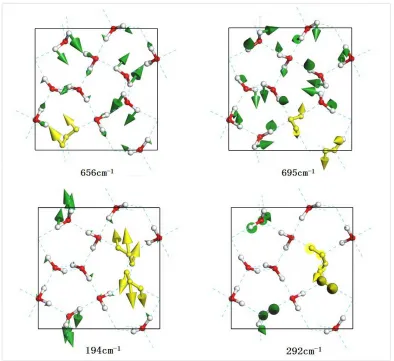
mode at 656 cm-1 in Fig. 3, the highlighted molecule shows wagging vibration while
the 695 cm-1 mode presents combinations of rocking and twisting. Interestingly, we
found that all molecules are rocking at 523 cm-1 and all molecules are wagging at 933
cm-1, which means that the energy of rocking is lower than wagging. From simulated
Raman spectrum we only see four weak peaks and the IR spectrum has three sharp
peaks at 671 cm-1, 701 cm-1, and 890 cm-1, which are the combinations of three vibration
types.
Figure 3. A top view of four normal vibration modes in libration band (656 cm-1, 695
cm-1) and translation band (194 cm-1, 291 cm-1), respectively. For the dynamic process
of weak and strong H-bond, please see the supplemental movies of 194.avi and 292.avi.
-1, 562 cm-1, 790 cm-1, 867 cm-1 ) from Raman scattering [14] are agreement with normal
mode calculations(518 cm-1、524 cm-1、583 cm-1、585 cm-1、798 cm-1、891 cm-1).
However, a peak recorded at 413 cm-1 could not be assigned from simulations. We
suspect this was a false peak according to DFT simulations. The peak at 470 cm-1 (Ref.
15)/490 cm-1 (Ref. 17) should be frequency at 518 cm-1 (normal mode in Table 1). As
for the INS spectrum, we can roughly match the peaks of ~464 cm-1, ~560 cm-1, ~632
cm-1, ~760 cm-1, ~904 cm-1 (Ref. 18) to 504 cm-1、563 cm-1、639 cm-1、757 cm-1、
903 cm-1 (PDOS).
In the intermolecular translational band, there are 33 normal vibration modes range
from 62 cm-1 to 292 cm-1. For one molecule, there exist three vibration modes:
stretching, wagging and rocking. Note that, a rocking in the translational band is
monolithic movement whilst a rocking in the librational band is only hydrogen
vibration within one molecule. To date, the physical mechanism of H-bond interaction
is still a question [22-25]. Li et al. proposed a two-stkerength model based on
electrostatic interactions to explain the two main peaks from INS spectrum [26,27].
The model has not been widely accepted which is still a controversial topic [28-31].
He et al. disagreed this model and asserted these two peaks originated from the
different directionalities of motion manifested in the distinct polarizations of absorbed
photons [31]. In the previous study, we found that the two H-bond peaks in the
hydrogen-ordered ice Ic are originated from two different H-bond vibration modes.
There are four H-bonds linked with one molecule to form a tetrahedral structure in ice
H-bond vibrating mode and four H-H-bond vibrating mode with a strength ratio of 2
[32]. These two types of modes are also observed in ice XIV crystal lattice. In the
translational band of Fig. 1, the peak of maximum strength observed at 288 cm-1 is
very distinct. Phonons at above ~200 cm-1 are main four H-bond vibrations analyzed
by normal vibration modes. Example of vibration mode at 292 cm-1 in Fig. 3 shows
that molecules are stretching along its bisector of angle. This is a typical four H-bond
vibration mode in which four linked H-bond are oscillating together. The two H-bond
mode means that one molecule vibrates toward connected neighbour in which there
are two effective H-bonds oscillating for this mode. Subject to local tetrahedral
structure, the collective vibrations are combinations of wagging and rocking as
illustrated in Fig. 3 of mode at 194 cm-1. To show dynamic process of these two modes,
please see the videos from supplemental files.For ice XIV, the local structure can not
maintain a regular tetrahedron due to lattice deformation under pressure. Thus,
deviations strength ratio from 2 are reasonable. From Fig. 1, it can be seen that there
are two main peaks at 166 cm-1 and 199 cm-1. Phonons around this region are mainly
two H-bond modes. There are other vibration modes associated with clusters vibration
or skeleton deformation below 166 cm-1. These optic phonons are merged with
acoustic phonons.
In the simulated Raman spectrum of Fig.1, there is a small peak at 176 cm-1. It should
be corresponding to experimental observations at 192/195/214 cm-1 [17, 15, 14].The
red-shift is mainly due to the RPBE function has a bit underestimate for H-bond [13].
-1) [18]areagreementwith 204 cm-1 and 288 cm-1 (PDOS). Koza et al. mentioned several
peaks in the far-IR region, such as 7 meV, 10 meV, 12 meV, 24 meV (56 cm-1, 80 cm-1,
96 cm-1, 192 cm-1) [18].Theycould be matched with 53 cm-1, 75 cm-1, 88 cm-1, 188 cm
-1 (PDOS in Table 1).
4.
Conclusions
In summary, by using the first-principles DFT method, we present Raman scattering,
IR absorption, and INS spectrum (PDOS) of ice XIV theoretically. The PDOS spectrum
is used to assign the characteristic peaks in INS spectrum because the INS collect
signals throughout the whole BZ without selection so that the simulated PDOS
spectrum is proportional to INS. The 105 optic normal vibration modes in the BZ center
could be compared with Raman and IR spectra. Under this condition, the peaks
recorded from photon scattering could be assigned according to normal vibration mode
individually.
The most valuable result is the identification of two types of H-bond vibration modes.
The thermodynamic nature of H-bond is a fascinating but still ambiguous topic to date.
Inspired by previous study on ice Ic, we concluded that there are also two types of
H-bond vibration modes in ice XIV. Deviations are mainly result from structure
deformation of local regular tetrahedron under pressure. Considering the local structure
symmetry, we deduce that the two H-bond modes is a general rule among ice family
Supplementary Materials: The following are available online at
www.mdpi.com/xxx/s1, Video S1: Dynamic process of H-bond vibration at 292 cm-1.
Video S2: Dynamic process of H-bond vibration at 194 cm-1.
Authors’ contributions. K.Z performed simulations and drafted the manuscript. P.Z
conducted simulations, data analysis and edited the manuscript. Z-R. W and X-L. Z
assisted structure modeling and data processing. Y-B. L, C-B. G and Y-H. L
participated results discussion. All the authors gave final approval for publication.
Founding: This research was funded by National Natural Science Foundation of China
grant number 11504202.
Acknowledgments. The numerical calculations were done on the supercomputing
system in the Supercomputing Center, Shandong University, Weihai.
References
1. Bertie, J.E.; Whalley, E. Optical Spectra of Orientationally Disordered Crystals. II.
Infrared Spectrum of Ice Ih and Ice Ic from 360 to 50 cm-1, J. Chem. Phys. 1967,
46, 1271-1284.
2. Bertie, J.E.; Calvert, L.D.; Whalley, E. Transformations of Ice II, Ice III, and Ice V
at Atmospheric Pressure, J. Chem. Phys. 1963, 38, 840-846.
3. Kuhs, W.F.; Finney, J.L.; Vettier, C.; Bliss, D.V. Structure and hydrogen ordering
in ices VI, VII, and VIII by neutron powder diffraction, J. Chem. Phys. 1984, 81,
3612-3623.
4. Whalley, E.; Heath, J.B.R.; Davidson, D.W. Ice IX: An Antiferroelectric Phase
5. Tajima, Y.; Matsuo, T.; Suga, H. Phase transition in KOH-doped hexagonal ice,
Nature 1982, 299, 810-812.
6. Hirsch, K.R.; Holzapfel, W.B. Effect of high pressure on the Raman spectra of ice
VIII and evidence for ice X, J. Chem. Phys. 1986, 84, 2771-2775.
7. Lobban, C.; Finney, J.L.; Kuhs, W.F. The structure of a new phase of ice, Nature
1998, 391, 268-270.
8. Salzmann, C.G.; Radaelli, P.G.; Mayer, A.E.; Finney, J.L. The Preparation and
Structures of Hydrogen Ordered Phases of Ice, Science 2006, 311, 1758-1761.
9. Salzmann, C.G.; Radaelli, P.G.; Mayer, E.; Finney, J.L. Ice XV: a new
thermodynamically stable phase of ice, Phys. Rev. Lett. 2009, 103, 105701-105704.
10. Falenty, A.; Hansen, T.C.; Kuhs, W.F. Formation and properties of ice XVI
obtained by emptying a type sII clathrate hydrate, Nature 2014, 516, 213-233.
11. del Rosso, L.; Celli, M.; Ulivi, L. New porous water ice metastable at atmospheric
pressure obtained by emptying a hydrogen-filled ice, Nat. Comm. 2016, 7,
13394-13400.
12. Zhang, P.; Wang, Z.; Lu, Y.B.; Ding, Z.W. The normal modes of lattice vibrations
of ice XI, Sci. Rep. 2016, 6, 29273-29281.
13. Tribello, G.A.; Slater, B.; Salzmann, C.G. A Blind Structure Prediction of Ice XIV,
J. AM. Chem. Soc. 2006, 128, 12594-12595.
14. Salzmann, C.G.; Hallbrucker, A.; Finney, J.L.; Mayer, E. Raman spectroscopic
features of hydrogen-ordering in ice XII, Chemical Physics Letters. 2006, 429,
15. Salzmann, C.G.; Kohl, I.; Loerting, T.; Mayer, E.; Hallbrucker, A. The Raman
Spectrum of Ice XII and Its Relation to that of a New “High-Pressure Phase of H2O
Ice”, J. Phys. Chem. B. 2002, 106, 1-6.
16. Yoshimura, Y.; Stewart, S.T.; Mao, H.-K.; Hemley, R.J. In situ Raman spectroscopy
of low-temperature/high-pressure transformations of H2O, J. Chem. Phys. 2007,
126, 174505-174512.
17. Chou, I.-M.; Blank, J.G.; Goncharov, A.F.; Mao, H.-K.; Hemley, R.J. In Situ
Observations of a High-Pressure Phase of H2O Ice, Science 1998, 281, 809-812.
18. Koza, M.M.; Schober, H.; Tölle, A.; Fujara, F.; Hansen, T.; Formation of ice XII at
different conditions, Nature 1999, 397, 660-661.
19. Koza, M.M.; Schober, H.; Parker, S.F.; Peters, J. Vibrational dynamics and phonon
dispersion of polycrystalline ice XII and of high-density amorphous ice, Phys. Rew.
B. 2008, 77, 104306-104314.
20. Clark, S.J.; Segall, M.D.; Pickard, C.J.; Hasnip, P.J.; Probert, M.I.J.; Refson, K.;
Payne, M.C. First principles methods using CASTEP, Z. Kristallogr. 2005, 220,
567-570.
21. Hammer, B.; Hansen, L.B.; Norskov, J.K. Improved adsorption energetics within
density-functional theory using revised Perdew-Burke-Ernzerhof functionals, Phys.
Rev. B. 59 (1999) 7413-7421.
22. Whale, T.F.; Clark, S.J.; Finney, J.L.; Salzmann, C.G.; DFT-assisted interpretation
of the Raman spectra of hydrogen-ordered ice XV, J. Raman. Spectroscopy. 2013,
23. Klug, D.D.; Whalley, E. Origin of the High-Frequency Translational Bands of Ice
I. J. Glaciol. 1978, 21, 55-63.
24. Marchi, M.; Tse, J.S.; Klein, M.L.; Lattice vibrations and infrared absorption of ice
Ih, J. Chem. Phys. 1986, 85, 2414-2418.
25. Tse, J.S.; Klug, D.D. Comments on “Further evidence for the existence of two
kinds of H-bonds in ice Ih” by Li et al, Phys. Lett. A. 1995, 198, 464-466.
26. Li, J.C.; Ross, D.K. Evidence for two kinds of hydrogen bond in ice, Nature 1993,
365, 327-329.
27. Li, J.C. Inelastic neutron scattering studies of hydrogen bonding in ices, J. Chem.
Phys. 1996, 105, 6733-6755.
28. Klotz, S.; Strassle, T.; Salzmann, C.G.; Philippe, J.; Parker, S.F. Incoherent inelastic
neutron scattering measurements on ice VII: Are there two kinds of hydrogen bonds
in ice? Europhys. Lett. 2005, 72, 576-582.
29. Zhang, P.; Tian, L.; Zhang, Z.P.; Shao, G.; Li, J.C. Investigation of the hydrogen
bonding in ice Ih by first-principles density function methods, J. Chem. Phys. 2012,
137, 044504-044508.
30. Zhang, P.; Han, S.H.; Yu, H.; Liu, Y. A calculating proof on hydrogen bonding in
ordinary ice by the first-principles density functional theory, RSC Adv. 2013, 3,
6646-6649.
31. He, X.; Sode, O.; Xantheas, S.S.; Hirata, S. Second-order many-body perturbation
study of ice Ih, J. Chem. Phys. 2012, 11, 204505-204512.
Computational assignments of lattice vibrations of ice Ic, RSC Adv. 2017, 7,