Top physics at the LHC
RobertoTenchini1,
1INFN Sezione di Pisa, Largo Bruno Pontecorvo 3, 56127 Pisa, Italy
Abstract.The status of top physics at the Large Hadron Collider is discussed, with
par-ticular attention on measurements of top production cross sections, including associate production of top quarks and electroweak bosons, and on measurements of the top mass.
1 Introduction
After seven years since the first beams, the Large Hadron Collider (LHC) can be called without any doubts a Top Factory. In year 2016, providing proton proton collisions at a centre-of-mass energy of 13 TeV, LHC has delivered about 30 millions top pairs to each general purpose experiment, ATLAS and CMS, corresponding to an integrated luminosity of about 36 fb−1, one order of magnitude higher than the amount of data delivered in the previous year at the same energy. Data collected at lower centre-of-mass energies correspond to≈5 fb−1at 7 TeV (year 2010) and≈20 fb−1at 8 TeV (years 2011 and 2012). This impressive wealth of data has been used by the ATLAS and CMS experiments to study in detail top production and decay properties, as documented by about 150 journal publications [1, 2].
The most striking characteristics of top is its mass, 35 times larger than the mass of the other third generation quark. Thanks to the non-decoupling properties of the electroweak interactions, such a large mass makes the top quark the main actor in electroweak radiative corrections, which are very sensitive to the actual value of the top mass. In addition, because of its mass, top lifetime is extremely short (∼ 10−25 s), actually shorter than the typical time involving strong interactions, allowing top properties to be studied as if it were a free quark.
The large mass also imply a large top-Higgs Yukawa coupling. Actually, measurements of top quark parameters and properties have an important impact to Higgs boson physics. The value of the top mass regulates the quartic Higgs couplings and, as a consequence, the stability of the electroweak vacuum: making a precise measurement of the top mass is of great importance for the Higgs sec-tor. Top-pair production occurs at the LHC mainly through gluon-gluon fusion, the main production channel for the Higgs boson itself: measurements of inclusive and differential cross section allow
improved determination of the gluon PDF to be performed and, as a consequence, improved under-standing of Higgs production cross sections. Top is also playing an important role in searches for physics beyond the standard model; as an example searches for stop in supersymmetric scenarios or searches for vector-like quarks in composite Higgs models are often involving top-quarks in the final state.
In these short conference proceedings measurements for cross sections for various top-production mechanisms at the LHC are concisely reviewed. Associate production of top quarks and electroweak bosons is also mentioned. A discussion on the status of measurements of the top mass completes the proceedings, which are closed by a short outlook section. Top physics at LHC includes many additional subjects, which were not covered in the talk and corresponding proceedings. Among them, it is important to mention top decay measurements, such as measurement of the t→Wb branching fraction, searches for FCNC decays, studies of the structure of Wtb vertex including measurements of the W helicity and measurements of top polarisation and top-pair spin correlations. Other not covered subjects include the many searches for physics beyond the standard model with top quarks.
2 Top production cross sections
Top pair production at LHC occurs via gluon-gluon fusion and quark-antiquark annihilation. The first production mechanism is by far dominating at LHC centre-of-mass energies, contributing to about 90% of the inclusive cross section at 13 TeV. The cross section is computed at NNLO+NNLL [3]
with a typical uncertainty of 3% due to scale variation and 2-3% related to PDF.
The top quark decays almost exclusively to Wb, other decays mode are suppressed by the values of the CKM elements. It is convenient to classify top decays with the related W decays, so top-pairs are classified in di-lepton, lepton+jet and all-hadron final states. Because of the different final state
topology, decays to tau leptons are usually treated separately at hadron colliders. Di-lepton final states with electrons or muons (6% of the decays) are very clean, with main background originating from Drell-Yan production, usually suppressed by rejecting same-sign same-flavour leptons with invariant mass consistent with a Z boson decay. Muon+jet and electron+jet final states (34% of events in
total) have also distinct signatures, but larger background mostly originating from W+jet events. The
background can be suppressed by using b-tagging techniques and measuring the number of b-tagged or non-b-tagged jets. The all-hadron final state has the larger branching ratio (46%), but suffers
from the large multi-jet generic QCD background. Finally, decays to tau leptons (14%) require tau reconstruction and are typically affected by W+jet and other top decay-mode backgrounds.
The most precise determinations of the top-pair production cross section are based on the analysis of di-lepton and lepton+jets top decays. The electron+muon di-lepton channel is particularly clean
and a precise measurement of the cross section can be achieved without the use of b-tagging tech-niques, which are typically used to validate the methods employed. The lepton+jet channel requires
the use of control regions where background are measured, typically in a common fit of backgrounds and signal, together with the main selection. Results of top-pairs cross section measurements at the centre-of-mass of 13 TeV are given in Fig. 1. The most precise measurements reach a precision com-parable to the uncertainty on the theoretical cross section. All measurements are affected by
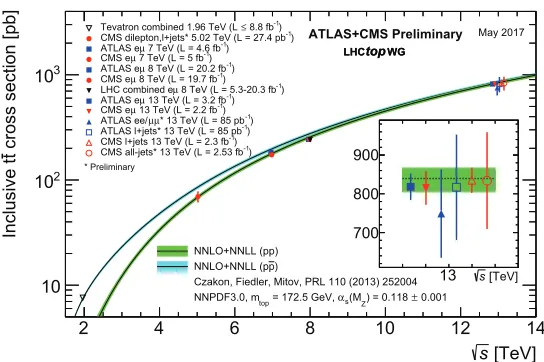
knowl-edge of the absolute integrated luminosity, which can be known at LHC with a precision of 2-3% depending on the data-taking period. The cross section measured at various centre-of-mass energies is shown in Fig. 2: the measurements are in agreement with the expectations from NNLO+NNLL
calculations.
Precise measurements of differential cross sections are also available, thanks to the high-statistics
data provided by LHC. In order to facilitate comparisons with theory, and in particular to allow com-parison with fixed-order calculations, yields are measured as a function of the observable of interest and then corrected by efficiency and bin-migration effects by means of unfolding procedures. As
an example the differential production cross sections, as measured by the ATLAS and CMS
In these short conference proceedings measurements for cross sections for various top-production mechanisms at the LHC are concisely reviewed. Associate production of top quarks and electroweak bosons is also mentioned. A discussion on the status of measurements of the top mass completes the proceedings, which are closed by a short outlook section. Top physics at LHC includes many additional subjects, which were not covered in the talk and corresponding proceedings. Among them, it is important to mention top decay measurements, such as measurement of the t→Wb branching fraction, searches for FCNC decays, studies of the structure of Wtb vertex including measurements of the W helicity and measurements of top polarisation and top-pair spin correlations. Other not covered subjects include the many searches for physics beyond the standard model with top quarks.
2 Top production cross sections
Top pair production at LHC occurs via gluon-gluon fusion and quark-antiquark annihilation. The first production mechanism is by far dominating at LHC centre-of-mass energies, contributing to about 90% of the inclusive cross section at 13 TeV. The cross section is computed at NNLO+NNLL [3]
with a typical uncertainty of 3% due to scale variation and 2-3% related to PDF.
The top quark decays almost exclusively to Wb, other decays mode are suppressed by the values of the CKM elements. It is convenient to classify top decays with the related W decays, so top-pairs are classified in di-lepton, lepton+jet and all-hadron final states. Because of the different final state
topology, decays to tau leptons are usually treated separately at hadron colliders. Di-lepton final states with electrons or muons (6% of the decays) are very clean, with main background originating from Drell-Yan production, usually suppressed by rejecting same-sign same-flavour leptons with invariant mass consistent with a Z boson decay. Muon+jet and electron+jet final states (34% of events in
total) have also distinct signatures, but larger background mostly originating from W+jet events. The
background can be suppressed by using b-tagging techniques and measuring the number of b-tagged or non-b-tagged jets. The all-hadron final state has the larger branching ratio (46%), but suffers
from the large multi-jet generic QCD background. Finally, decays to tau leptons (14%) require tau reconstruction and are typically affected by W+jet and other top decay-mode backgrounds.
The most precise determinations of the top-pair production cross section are based on the analysis of di-lepton and lepton+jets top decays. The electron+muon di-lepton channel is particularly clean
and a precise measurement of the cross section can be achieved without the use of b-tagging tech-niques, which are typically used to validate the methods employed. The lepton+jet channel requires
the use of control regions where background are measured, typically in a common fit of backgrounds and signal, together with the main selection. Results of top-pairs cross section measurements at the centre-of-mass of 13 TeV are given in Fig. 1. The most precise measurements reach a precision com-parable to the uncertainty on the theoretical cross section. All measurements are affected by
knowl-edge of the absolute integrated luminosity, which can be known at LHC with a precision of 2-3% depending on the data-taking period. The cross section measured at various centre-of-mass energies is shown in Fig. 2: the measurements are in agreement with the expectations from NNLO+NNLL
calculations.
Precise measurements of differential cross sections are also available, thanks to the high-statistics
data provided by LHC. In order to facilitate comparisons with theory, and in particular to allow com-parison with fixed-order calculations, yields are measured as a function of the observable of interest and then corrected by efficiency and bin-migration effects by means of unfolding procedures. As
an example the differential production cross sections, as measured by the ATLAS and CMS
exper-iments, are shown in Fig. 3 as a function of the transverse momentum of the top quark (left panel) and the invariant mass of the top-quark pair (right panel). The discrepancies observed in the past in
[pb] tt σ
200 400 600 800 1000 1200 1400
ATLAS+CMS Preliminary LHCtopWG σtt summary, s = 13 TeV May 2017 NNLO+NNLL PRL 110 (2013) 252004
0.001 ± ) = 0.118 Z (M s α = 172.5 GeV, top
m
scale uncertainty uncertainty
S α ⊕
⊕
scale
total stat
(lumi)
±
(syst)
±
(stat)
± tt σ
* Preliminary
µ
ATLAS, dilepton e -1 = 3.2 fb int PLB 761 (2016) 136, L
µ
ATLAS, dilepton e 818± 8 ± 27 ± 19 pb
*
µ µ
ATLAS, dilepton ee/ -1 = 85 pb int ATLAS-CONF-2015-049, L
*
µ µ
ATLAS, dilepton ee/ 749± 57 ± 79 ± 74 pb
ATLAS, l+jets *
-1 = 85 pb int ATLAS-CONF-2015-049, L
ATLAS, l+jets * 817± 13 ± 103 ± 88 pb
µ
CMS, dilepton e
, 50 ns -1 = 43 pb int PRL 116 (2016) 052002, L
µ
CMS, dilepton e 746± 58 ± 53 ± 36 pb
µ
CMS, dilepton e
, 25 ns -1 = 2.2 fb int EPJC 77 (2017) 172, Lµ
CMS, dilepton e 815± 9 ± 38 ± 19 pb
CMS, l+jets
-1 = 2.3 fb int arXiv:1701.06228, L
CMS, l+jets 835± 3 ± 23 ± 23 pb
CMS, all-jets *
-1 = 2.53 fb int CMS-PAS TOP-16-013, L
CMS, all-jets * 834± 25 ± 118 ± 23 pb
ABM12 ) = 0.113 Z (m s
α PRD 89 (2015) 054028
CT14 PRD 93 (2016) 033006 MMHT14 EPJC 75 (2015) 5 NNPDF3.0 JHEP 04 (2015) 040
Figure 1.Summary of measurements of the top-pair production cross-section at 13 TeV compared to the exact
NNLO QCD calculation complemented with NNLL resummation [3]. The theory band represents uncertainties due to renormalisation and factorisation scale, parton density functions and the strong coupling. The measure-ments and the theory calculation are quoted at mtop=172.5 GeV.
the first distribution, with data typically showing a softer spectrum with respect to NLO spectra, have essentially disappeared with the use recent NNLO+NNLL calculations.
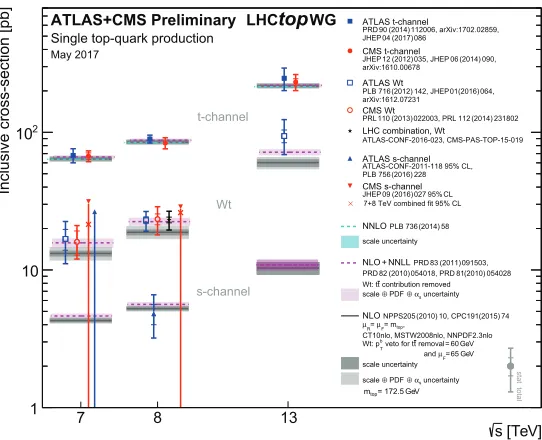
Top quarks can be produced singly at hadron colliders via electroweak processes. The higher cross section is provided by t-channel production, where top is produced by a virtual W boson in presence of a spectator light quark. This channel has a specific signature related to the presence of a forward jet, originating from the spectator quark, which can be used in the selection of events. Associate top+W production has a lower cross section and a final state, which show similarities with
top-pair production, from which is separated by counting the number of b-jets. The definition of this channel and the related signal requires also some care, since at NLO and higher orders it interferes with top-pair production. Top-quark+b-quark production in s-channel through a virtual W has an even
[TeV]
s
2 4 6 8 10 12 14
cross section [pb]t
Inclusive t
10 2 10
3 10
WG
top
LHC
ATLAS+CMS Preliminary May 2017
* Preliminary
) -1 8.8 fb
≤
Tevatron combined 1.96 TeV (L ) -1 CMS dilepton,l+jets* 5.02 TeV (L = 27.4 pb
) -1 7 TeV (L = 4.6 fb
µ
ATLAS e
) -1 7 TeV (L = 5 fb
µ
CMS e
) -1 8 TeV (L = 20.2 fb
µ
ATLAS e
) -1 8 TeV (L = 19.7 fb
µ
CMS e
) -1 8 TeV (L = 5.3-20.3 fb
µ
LHC combined e ) -1 13 TeV (L = 3.2 fb
µ
ATLAS e
) -1 13 TeV (L = 2.2 fb
µ
CMS e
) -1 * 13 TeV (L = 85 pb
µ µ
ATLAS ee/
) -1 ATLAS l+jets* 13 TeV (L = 85 pb
) -1 CMS l+jets 13 TeV (L = 2.3 fb
) -1 CMS all-jets* 13 TeV (L = 2.53 fb
WG
top
LHC
NNLO+NNLL (pp) ) p NNLO+NNLL (p
Czakon, Fiedler, Mitov, PRL 110 (2013) 252004 0.001
±
) = 0.118 Z (M s
α
= 172.5 GeV, top
NNPDF3.0, m
[TeV] s 13 700
800 900
Figure 2.Summary of LHC measurements of the top-pair production cross-section as a function of the
centre-of-mass energy compared to the NNLO QCD calculation complemented with NNLL resummation [3]. Results from p¯p collisions at Tevatron are also shown. The theory band represents uncertainties due to renormalisation and factorisation scale, parton density functions and the strong coupling. The measurements and the theory calculation are quoted at mtop=172.5 GeV. Measurements made at the same centre-of-mass energy are slightly
offset for clarity.
of multivariate techniques. The measured inclusive cross sections are shown in Fig. 4 and compared with the expectations from recent calculations. Agreement between data and theory is observed also in the single top sector. Measurements of differential cross sections using single top data are also
appearing [1, 2].
3 Top and electroweak bosons
Associate production of top quarks and electroweak bosons (vector or scalar) is of great interest, but production cross sections are typically lower than a picobarn. In order to separate these low signals from backgrounds, in particular from t¯t events, multilepton final states are often used; when this is done background originating from lepton misidentification needs to be treated carefully and measured with data using control samples.
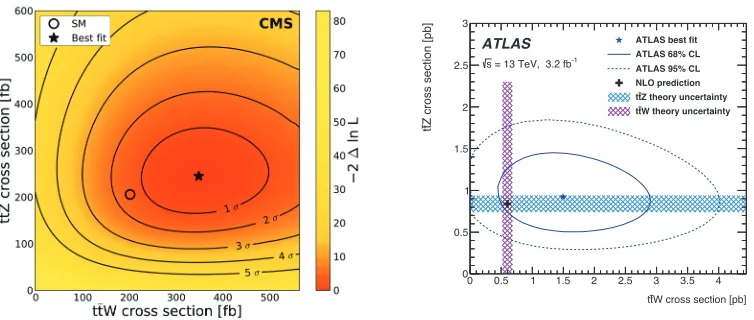
Production of t¯tZ has been observed by both ATLAS and CMS experiments [4, 5]. Events with same-sign dileptons, three leptons and four leptons have been used in the measurements. In the anal-yses a common measurement of t¯tZ and t¯tW production is performed. Results based on data collected at the centre-of-mass energy of 8 TeV are shown in Fig. 5. The t¯tZ final state gives access to a direct measurement of the top-Z couplings, measurements have been used to constrain the Wilson coeffi
-cients of dim-6 operators. Associate production of single top and Z boson is also interesting, giving information complementary to t¯tZ and additional sensitivity to, e.g., FCNC top couplings. (Evidence for tqZ production has been shown by ATLAS and CMS after this conference.) Production of top-quark pairs and a direct photon (t¯tγevents) has also been measured at LHC [6, 7]; the differential cross
[TeV]
s
2 4 6 8 10 12 14
cross section [pb]t
Inclusive t
10 2 10
3 10
WG
top
LHC
ATLAS+CMS Preliminary May 2017
* Preliminary
) -1 8.8 fb
≤
Tevatron combined 1.96 TeV (L ) -1 CMS dilepton,l+jets* 5.02 TeV (L = 27.4 pb
) -1 7 TeV (L = 4.6 fb
µ
ATLAS e
) -1 7 TeV (L = 5 fb
µ
CMS e
) -1 8 TeV (L = 20.2 fb
µ
ATLAS e
) -1 8 TeV (L = 19.7 fb
µ
CMS e
) -1 8 TeV (L = 5.3-20.3 fb
µ
LHC combined e ) -1 13 TeV (L = 3.2 fb
µ
ATLAS e
) -1 13 TeV (L = 2.2 fb
µ
CMS e
) -1 * 13 TeV (L = 85 pb
µ µ
ATLAS ee/
) -1 ATLAS l+jets* 13 TeV (L = 85 pb
) -1 CMS l+jets 13 TeV (L = 2.3 fb
) -1 CMS all-jets* 13 TeV (L = 2.53 fb
WG
top
LHC
NNLO+NNLL (pp) ) p NNLO+NNLL (p
Czakon, Fiedler, Mitov, PRL 110 (2013) 252004 0.001
±
) = 0.118 Z (M s
α
= 172.5 GeV, top
NNPDF3.0, m
[TeV] s 13 700
800 900
Figure 2.Summary of LHC measurements of the top-pair production cross-section as a function of the
centre-of-mass energy compared to the NNLO QCD calculation complemented with NNLL resummation [3]. Results from p¯p collisions at Tevatron are also shown. The theory band represents uncertainties due to renormalisation and factorisation scale, parton density functions and the strong coupling. The measurements and the theory calculation are quoted at mtop=172.5 GeV. Measurements made at the same centre-of-mass energy are slightly
offset for clarity.
of multivariate techniques. The measured inclusive cross sections are shown in Fig. 4 and compared with the expectations from recent calculations. Agreement between data and theory is observed also in the single top sector. Measurements of differential cross sections using single top data are also
appearing [1, 2].
3 Top and electroweak bosons
Associate production of top quarks and electroweak bosons (vector or scalar) is of great interest, but production cross sections are typically lower than a picobarn. In order to separate these low signals from backgrounds, in particular from t¯t events, multilepton final states are often used; when this is done background originating from lepton misidentification needs to be treated carefully and measured with data using control samples.
Production of t¯tZ has been observed by both ATLAS and CMS experiments [4, 5]. Events with same-sign dileptons, three leptons and four leptons have been used in the measurements. In the anal-yses a common measurement of t¯tZ and t¯tW production is performed. Results based on data collected at the centre-of-mass energy of 8 TeV are shown in Fig. 5. The t¯tZ final state gives access to a direct measurement of the top-Z couplings, measurements have been used to constrain the Wilson coeffi
-cients of dim-6 operators. Associate production of single top and Z boson is also interesting, giving information complementary to t¯tZ and additional sensitivity to, e.g., FCNC top couplings. (Evidence for tqZ production has been shown by ATLAS and CMS after this conference.) Production of top-quark pairs and a direct photon (t¯tγevents) has also been measured at LHC [6, 7]; the differential cross
section, as a function of the photon transverse momentum, is in agreement with standard model
expec-Figure 3.Full phase-space normalised differential ttbar cross-section as a function of the transverse momentum
of the top quark (left panel) and the invariant mass of the top-quark pair (right panel). The CMS and ATLAS results are compared to NNLO and approximate NNLO calculations. The values for the top-quark mass (mtop),
the renormalisation (µR) and factorisation (µF) scales, and the choice of the PDF set used in each calculation are
provided. The variable mT is defined as the square root of the sum of the squares of top-quark mass and the
transverse momentum of the top quark. Both the CMS and ATLAS measurements are performed assuming a top-quark mass value of 172.5 GeV. The shaded bands show the total uncertainty on the data measurements in each bin. The lower panel shows the ratio of the data measurements and the approximate NNLO calculations to the full NNLO calculation.
tations. The t¯tγprocess provides sensitivity to anomalous top electric dipole moments and deviations
could indicate the presence of excited top states.
The t¯tH process allows a direct measurement of the top Higgs-Yukawa coupling to be performed. Once again multilepton final states, taking advantage of Higgs boson decays to Z or W pairs, give the higher sensitivity; other important channels are based on H→γγand H→b¯b decays. The combina-tion of ATLAS and CMS measurements in various channels, performed at the centre-of-mass energy of 8 TeV, gave evidence of this channel at 4.4σlevel, with a moderate excess with respect to SM expectations [8]. First results at 13 TeV are available and a significant determination of the top Higgs-Yukawa coupling is expected soon. Associate production of single top and a Higgs boson is strongly sensitive to the sign of the Yukawa coupling (while t¯tH only depends on its square). Because of the interference between the two main tree-level diagrams, within the standard model the tH expected cross section is only 18 fb, however it can grow by more than one order of magnitude if the sign of the coupling is flipped: a detection of this process in the present data would be an evidence for physics beyond the standard model.
4 The top mass
] V e [T s
Inclusive cross-section [pb]
1 10 2 10
7 8 13
WG top LHC ATLAS+CMS Preliminary Single top-quark production
May 2017
t-channel
Wt
s-channel
ATLAS t-channel
086 (2017) 04
JHEP90(2014)112006, arXiv:1702.02859, PRD
CMS t-channel
arXiv:1610.0067812(2012)035, JHEP06(2014)090, JHEP
ATLAS Wt
arXiv:1612.07231(2012)142, JHEP01(2016)064, PLB 716
CMS Wt110(2013)022003, PRL112(2014)231802
PRL
LHC combination, Wt
ATLAS-CONF-2016-023, CMS-PAS-TOP-15-019
ATLAS s-channel
228 (2016) PLB 756
ATLAS-CONF-2011-118 95% CL,
CMS s-channel
7+8 TeV combined fit 95% CL × JHEP09(2016)02795%CL
58 (2014) PLB 736
NNLO
scale uncertainty
091503, (2011) 83 PRD
NNLL + NLO
054028 (2010) 81 054018, PRD (2010) 82 PRD
contribution removed t
Wt: t
uncertainty
s α ⊕
⊕
scale
74 (2015) 10, CPC191 (2010) NPPS205
NLO
,
top
= m
F µ
=
R µ
CT10nlo, MSTW2008nlo, NNPDF2.3nlo V e G 60 = removal t veto for t
b T
Wt: p
V e G 65 =
F µ
and scale uncertainty
uncertainty
s α ⊕
⊕
scale V e G = 172.5
top
m
stat total
Figure 4. Summary of ATLAS and CMS measurements of the single top production cross-sections in various
channels as a function of the centre-of-mass energy. The measurements are compared to theoretical calculations based on: NLO QCD, NLO QCD complemented with NNLL resummation and NNLO QCD (t-channel only).
precision because the only neutrino in the final state can be unambiguously associated to the missing transverse momentum, differently than the dilepton channel. In addition the distinct l+jet signature
can be used, together with b-tagging, to keep backgrounds at low levels. B-tagging is also a powerful tool to reduce combinatorial in the association of jets to the top and antitop candidates.
Selection of lepton+jet events is typically based on requiring the presence of a single electron or
single muon passing a transverse momentum threshold (a typical value for muons in 8 TeV analysis is 24 GeV), by requiring the presence of four reconstructed jets of which one or two are tagged as b-jets, and of significant missing transverse momentum. With such a simple selection the fraction of non-top events is reduced typically at the 5% level. Events are then subject to a kinematic fit procedure, where momentum conservation is imposed in the transverse plane. A major systematic uncertainty in the evaluation of the mass is related to the knowledge of jet energies; it is convenient to include jet energy scale (JES) correction factors in the kinematic fit and impose consistency of the invariant mass of the two light jets forming the hadronically decaying W boson candidate with the precisely known W mass. Dedicated b-jet JES correction factors can also be included by using variables sensitive to the b-jets/W-bosons global transverse momentum balance. Typically the mass of the top and antitop
candidates are considered equal in the fit (this constraint is released for CPT invariance tests). The goodness of the kinematic fit is a powerful tool to reduce the number of combinations, since wrong jet-to-top-candidate associations are typically showing a poorχ2.
Events reconstructed with these methods, or more precisely combinations reconstructed with these methods, can be used to build distributions providing sensitivity to the top mass (for example the distribution of the top mass parameter as measured by kinematic fitting, which is typically peaked around 170-175 GeV). The distributions however are distorted by many effects, as detector resolution,
] V e [T s
Inclusive cross-section [pb]
1 10 2 10
7 8 13
WG top LHC ATLAS+CMS Preliminary Single top-quark production
May 2017 t-channel Wt s-channel ATLAS t-channel 086 (2017) 04
JHEP90(2014)112006, arXiv:1702.02859, PRD
CMS t-channel
arXiv:1610.0067812(2012)035, JHEP06(2014)090, JHEP
ATLAS Wt
arXiv:1612.07231(2012)142, JHEP01(2016)064, PLB 716
CMS Wt110(2013)022003, PRL112(2014)231802
PRL
LHC combination, Wt
ATLAS-CONF-2016-023, CMS-PAS-TOP-15-019
ATLAS s-channel
228 (2016) PLB 756
ATLAS-CONF-2011-118 95% CL,
CMS s-channel
7+8 TeV combined fit 95% CL × JHEP09(2016)02795%CL
58 (2014) PLB 736 NNLO scale uncertainty 091503, (2011) 83 PRD NNLL + NLO 054028 (2010) 81 054018, PRD (2010) 82 PRD contribution removed t Wt: t uncertainty s α ⊕ PDF ⊕ scale 74 (2015) 10, CPC191 (2010) NPPS205 NLO , top = m F µ = R µ
CT10nlo, MSTW2008nlo, NNPDF2.3nlo V e G 60 = removal t veto for t
b T Wt: p V e G 65 = F µ and scale uncertainty uncertainty s α ⊕ PDF ⊕ scale V e G = 172.5 top m
stat total
Figure 4. Summary of ATLAS and CMS measurements of the single top production cross-sections in various
channels as a function of the centre-of-mass energy. The measurements are compared to theoretical calculations based on: NLO QCD, NLO QCD complemented with NNLL resummation and NNLO QCD (t-channel only).
precision because the only neutrino in the final state can be unambiguously associated to the missing transverse momentum, differently than the dilepton channel. In addition the distinct l+jet signature
can be used, together with b-tagging, to keep backgrounds at low levels. B-tagging is also a powerful tool to reduce combinatorial in the association of jets to the top and antitop candidates.
Selection of lepton+jet events is typically based on requiring the presence of a single electron or
single muon passing a transverse momentum threshold (a typical value for muons in 8 TeV analysis is 24 GeV), by requiring the presence of four reconstructed jets of which one or two are tagged as b-jets, and of significant missing transverse momentum. With such a simple selection the fraction of non-top events is reduced typically at the 5% level. Events are then subject to a kinematic fit procedure, where momentum conservation is imposed in the transverse plane. A major systematic uncertainty in the evaluation of the mass is related to the knowledge of jet energies; it is convenient to include jet energy scale (JES) correction factors in the kinematic fit and impose consistency of the invariant mass of the two light jets forming the hadronically decaying W boson candidate with the precisely known W mass. Dedicated b-jet JES correction factors can also be included by using variables sensitive to the b-jets/W-bosons global transverse momentum balance. Typically the mass of the top and antitop
candidates are considered equal in the fit (this constraint is released for CPT invariance tests). The goodness of the kinematic fit is a powerful tool to reduce the number of combinations, since wrong jet-to-top-candidate associations are typically showing a poorχ2.
Events reconstructed with these methods, or more precisely combinations reconstructed with these methods, can be used to build distributions providing sensitivity to the top mass (for example the distribution of the top mass parameter as measured by kinematic fitting, which is typically peaked around 170-175 GeV). The distributions however are distorted by many effects, as detector resolution,
phase space constraints, background, pileup of other interactions in the same event, selection cuts,
W cross section [pb] tt
0 0.5 1 1.5 2 2.5 3 3.5 4
Z cross section [pb]tt
0 0.5 1 1.5 2 2.5 3
ATLAS ATLAS best fit
ATLAS 68% CL ATLAS 95% CL NLO prediction
Z theory uncertainty tt
W theory uncertainty tt
-1
= 13 TeV, 3.2 fb s
Figure 5.Measurements of the t¯tW and t¯tZ cross sections by the CMS and ATLAS experiments. Profile
likeli-hoods as a function ofσ(t¯tW) andσ(t¯tZ). Lines denote standard deviation (left) or CL contours (right).
etc., requiring a detailed Monte Carlo simulation to describe the distributions observed with data. The top mass and other parameters (such JES) can then be measured by generating simulations with different input parameters and use them to fit the data (for instance generating Monte Carlotemplates
for the distribution of interest). Results obtained with these methods at LHC and Tevatron, and their combinations, are displayed in Fig. 6. Measurements performed with di-lepton and all-hadron events, based on similar techinques, are also included.
Measurements obtained with standard methods, i.e. direct reconstruction of top decay products, provide high-precision: the combination of recent LHC measurements reaches a total uncertainty of only 0.3%. However, the interpretation of the measurements has caused an intense debate. As the standard methods are related to the invariant mass of top decay products, it is natural to associate the measured mass to the top pole mass. For a coloured particle as top, the pole mass has an intrinsic ambiguity related to renormalisation, the related uncertainty has been recently computed and it is in the 100-200 MeV range [9, 10]. More in general and beyond this purely technical issue top decays products cannot be unambiguously identified because top-quark colour charge is transferred to the b-quark in the t→Wb decay: in order to have colourless hadrons at the end of the decay chain colour needs to be transferred to the rest of the event (colour reconnection effects). Colour reconnection is a
non-perturbative effect and cannot be calculated, its impact on the measurement is expected to be of
the order ofΛQCD≈200 MeV. In the measurements, uncertainties related to this effect are computed
with heuristic Monte Carlo models, parameterised with multiplicity studies on generic proton-proton collisions.
Given the considerations of the previous paragraph, it is clear that a careful assessment of poten-tial bias on present measurements, due to colour reconnection effects, is strongly desirable. Related
studies are ongoing at LHC, as an example the top mass can be measured as a function of the top transverse momentum, of the minimal distance of two jets from the same or different top decay and of
[GeV]
top
m
165 170 175 180 185
ATLAS+CMS Preliminary LHCtopWG mtop summary, s = 7-8 TeV
shown below the line (*) Superseded by results
May 2017
World Comb. Mar 2014, [7]
0.67) GeV
±
0.76 (0.36
±
= 173.34 top m stat
total uncertainty total stat
syst)
±
total (stat
±
top
m s Ref.
ATLAS, l+jets (*) 172.31± 1.55 (0.75 ± 1.35) 7 TeV [1]
ATLAS, dilepton (*) 173.09± 1.63 (0.64 ± 1.50) 7 TeV [2]
CMS, l+jets 173.49± 1.06 (0.43 ± 0.97) 7 TeV [3]
CMS, dilepton 172.50± 1.52 (0.43 ± 1.46) 7 TeV [4]
CMS, all jets 173.49± 1.41 (0.69 ± 1.23) 7 TeV [5]
LHC comb. (Sep 2013) 173.29± 0.95 (0.35 ± 0.88) 7 TeV [6]
World comb. (Mar 2014) 173.34± 0.76 (0.36 ± 0.67) 1.96-7 TeV [7]
ATLAS, l+jets 172.33± 1.27 (0.75 ± 1.02) 7 TeV [8]
ATLAS, dilepton 173.79± 1.41 (0.54 ± 1.30) 7 TeV [8]
ATLAS, all jets 175.1± 1.8 (1.4 ± 1.2) 7 TeV [9]
ATLAS, single top 172.2± 2.1 (0.7 ± 2.0) 8 TeV [10]
ATLAS, dilepton 172.99± 0.85 (0.41 ± 0.74) 8 TeV [11]
ATLAS, all jets 173.72± 1.15 (0.55 ± 1.01) 8 TeV [12]
)
l+jets, dil. June 2016
(
ATLAS comb. 172.84± 0.70 (0.34 ± 0.61) 7+8 TeV [11]
CMS, l+jets 172.35± 0.51 (0.16 ± 0.48) 8 TeV [13]
CMS, dilepton 172.82± 1.23 (0.19 ± 1.22) 8 TeV [13]
CMS, all jets 172.32± 0.64 (0.25 ± 0.59) 8 TeV [13]
CMS, single top 172.95± 1.22 (0.77 ± 0.95) 8 TeV [14]
CMS comb. (Sep 2015) 172.44± 0.48 (0.13 ± 0.47) 7+8 TeV [13]
[1] ATLAS-CONF-2013-046 [2] ATLAS-CONF-2013-077 [3] JHEP 12 (2012) 105 [4] Eur.Phys.J.C72 (2012) 2202 [5] Eur.Phys.J.C74 (2014) 2758
[6] ATLAS-CONF-2013-102 [7] arXiv:1403.4427 [8] Eur.Phys.J.C75 (2015) 330 [9] Eur.Phys.J.C75 (2015) 158 [10] ATLAS-CONF-2014-055
[11] Phys.Lett.B761 (2016) 350 [12] arXiv:1702.07546 [13] Phys.Rev.D93 (2016) 072004 [14] arXiv:1703.02530
Figure 6. Summary of the ATLAS and CMS standard mtop measurements. The results are compared with the
LHC and Tevatron+LHC mtopcombinations. For each measurement, the statistical uncertainty includes the jet
scale factor and b-jet scale factor contributions (when applicable), while the sum of the remaining systematic uncertainties is reported separately. The jet scale factors contributions are statistical in nature and apply to analyses performing in-situ (top quark pair based) jet energy calibration procedures. The results below the line are results produced after the LHC and Tevatron+LHC combinations were performed.
It also relevant to measure the top mass with alternative methods, based on very different
tech-niques or based on events with a different colour structure, to check if results deviate with respect to
standard methods. An important determination of the mass is based on the inclusive t¯t cross section, which is very sensitive to the top mass (and to the strong coupling constant,αs). This
interpreta-tion of the cross secinterpreta-tion requires a careful assessment of the PDF uncertainties and it is limited by the knowledge of the accelerator luminosity. A measured based on the standard technique, but using events with a different colour structure is the top mass measurement with a sample enriched in single
top events. An interesting measurement can be made by using dilepton events, using the dependence of kinematic endpoints on the top mass that can be analytically calculated. Other examples are mea-surements based on quasi-exclusive decays (as top decays to J/ψ) or on the b-jet or lepton energies
[GeV]
top
m
165 170 175 180 185
ATLAS+CMS PreliminaryLHCtopWG mtop summary, s = 7-8 TeV
shown below the line (*) Superseded by results
May 2017
World Comb. Mar 2014, [7]
0.67) GeV ± 0.76 (0.36 ± = 173.34 top m stat
total uncertainty total stat
syst)
±
total (stat
±
top
m s Ref.
ATLAS, l+jets (*) 172.31± 1.55 (0.75 ± 1.35) 7 TeV [1]
ATLAS, dilepton (*) 173.09± 1.63 (0.64 ± 1.50) 7 TeV [2]
CMS, l+jets 173.49± 1.06 (0.43 ± 0.97) 7 TeV [3]
CMS, dilepton 172.50± 1.52 (0.43 ± 1.46) 7 TeV [4]
CMS, all jets 173.49± 1.41 (0.69 ± 1.23) 7 TeV [5]
LHC comb. (Sep 2013) 173.29± 0.95 (0.35 ± 0.88) 7 TeV [6]
World comb. (Mar 2014) 173.34± 0.76 (0.36 ± 0.67) 1.96-7 TeV [7]
ATLAS, l+jets 172.33± 1.27 (0.75 ± 1.02) 7 TeV [8]
ATLAS, dilepton 173.79± 1.41 (0.54 ± 1.30) 7 TeV [8]
ATLAS, all jets 175.1± 1.8 (1.4 ± 1.2) 7 TeV [9]
ATLAS, single top 172.2± 2.1 (0.7 ± 2.0) 8 TeV [10]
ATLAS, dilepton 172.99± 0.85 (0.41 ± 0.74) 8 TeV [11]
ATLAS, all jets 173.72± 1.15 (0.55 ± 1.01) 8 TeV [12]
)
l+jets, dil. June 2016
(
ATLAS comb. 172.84± 0.70 (0.34 ± 0.61) 7+8 TeV [11]
CMS, l+jets 172.35± 0.51 (0.16 ± 0.48) 8 TeV [13]
CMS, dilepton 172.82± 1.23 (0.19 ± 1.22) 8 TeV [13]
CMS, all jets 172.32± 0.64 (0.25 ± 0.59) 8 TeV [13]
CMS, single top 172.95± 1.22 (0.77 ± 0.95) 8 TeV [14]
CMS comb. (Sep 2015) 172.44± 0.48 (0.13 ± 0.47) 7+8 TeV [13]
[1] ATLAS-CONF-2013-046 [2] ATLAS-CONF-2013-077 [3] JHEP 12 (2012) 105 [4] Eur.Phys.J.C72 (2012) 2202 [5] Eur.Phys.J.C74 (2014) 2758
[6] ATLAS-CONF-2013-102 [7] arXiv:1403.4427 [8] Eur.Phys.J.C75 (2015) 330 [9] Eur.Phys.J.C75 (2015) 158 [10] ATLAS-CONF-2014-055
[11] Phys.Lett.B761 (2016) 350 [12] arXiv:1702.07546 [13] Phys.Rev.D93 (2016) 072004 [14] arXiv:1703.02530
Figure 6. Summary of the ATLAS and CMS standard mtop measurements. The results are compared with the
LHC and Tevatron+LHC mtop combinations. For each measurement, the statistical uncertainty includes the jet
scale factor and b-jet scale factor contributions (when applicable), while the sum of the remaining systematic uncertainties is reported separately. The jet scale factors contributions are statistical in nature and apply to analyses performing in-situ (top quark pair based) jet energy calibration procedures. The results below the line are results produced after the LHC and Tevatron+LHC combinations were performed.
It also relevant to measure the top mass with alternative methods, based on very different
tech-niques or based on events with a different colour structure, to check if results deviate with respect to
standard methods. An important determination of the mass is based on the inclusive t¯t cross section, which is very sensitive to the top mass (and to the strong coupling constant,αs). This
interpreta-tion of the cross secinterpreta-tion requires a careful assessment of the PDF uncertainties and it is limited by the knowledge of the accelerator luminosity. A measured based on the standard technique, but using events with a different colour structure is the top mass measurement with a sample enriched in single
top events. An interesting measurement can be made by using dilepton events, using the dependence of kinematic endpoints on the top mass that can be analytically calculated. Other examples are mea-surements based on quasi-exclusive decays (as top decays to J/ψ) or on the b-jet or lepton energies
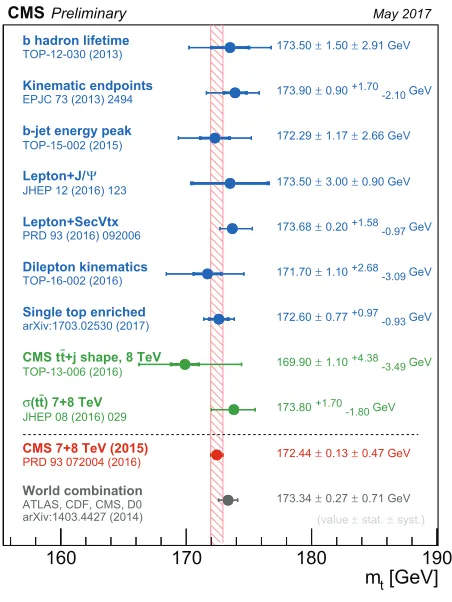
measured in the reference frame where top is at rest (or in a reference frame close to it). Examples of these measurements are shown in Fig. 7: results are consistent with the standard measurements, albeit with larger uncertainties. These methods are very interesting in view of the large statistics expected from LHC in future years, since for many of these results the statistical errors (or systematic errors reducible with more statistics) are currently dominating.
[GeV]
t
m
160 170 180 190
0 5 10 2.91 GeV ± 1.50 ± 173.50 b hadron lifetime
TOP-12-030 (2013) GeV -2.10 +1.70 0.90 ± 173.90 Kinematic endpoints
EPJC 73 (2013) 2494
2.66 GeV
±
1.17
±
172.29 b-jet energy peak
TOP-15-002 (2015) 0.90 GeV ± 3.00 ± 173.50 Ψ Lepton+J/ JHEP 12 (2016) 123
GeV -0.97 +1.58 0.20 ± 173.68 Lepton+SecVtx
PRD 93 (2016) 092006
GeV -3.09 +2.68 1.10 ± 171.70 Dilepton kinematics TOP-16-002 (2016) GeV -0.93 +0.97 0.77 ± 172.60 Single top enriched
arXiv:1703.02530 (2017) GeV -3.49 +4.38 1.10 ± 169.90 +j shape, 8 TeV
t CMS t TOP-13-006 (2016) GeV -1.80 +1.70 173.80 ) 7+8 TeV
t (t σ
JHEP 08 (2016) 029
0.47 GeV
±
0.13
±
172.44
CMS 7+8 TeV (2015)
PRD 93 072004 (2016)
0.71 GeV ± 0.27 ± 173.34 World combination
ATLAS, CDF, CMS, D0 arXiv:1403.4427 (2014) May 2017 syst.) ± stat. ± (value CMSPreliminary
Figure 7. Summary of alternative measurements of the top mass, as made by the CMS experiment using data
collected at 7 and 8 TeV centre-of-mass energies.
5 Outlook
In 2017 and 2018 additional 45 fb−1per year at a centre-of-mass energy of 13 TeV are expected from the LHC. This additional statistics will complement the existing data and allow a detailed study of top production and decay to be performed. The first direct measurement of the top-Higgs Yukakwa coupling is expected, using these data. The accelerator will then undergo two years of shutdown (LS2) to allow upgrades of the experiments and of the collider to be installed. After LS2, 300 fb−1at a centre-of-mass energy of 14 TeV are foreseen, followed by several ab−1at the same centre-of-mass energy in the HL-LHC phase. The era of high-precision top physics has just started.
Acknowledgements
References
[1] https://twiki.cern.ch/twiki/bin/view/AtlasPublic
[2] http://cms-results.web.cern.ch/cms-results/public-results/publications/
[3] M. Czakon, P. Fiedler, A. Mitov, Phys. Rev. Lett.110, 252004 (2013) [4] ATLAS Collaboration, J. High Energy Phys.11, 172 (2015)
[5] CMS Collaboration, J. High Energy Phys.01, 096 (2016) [6] ATLAS Collaboration, arXiv:1706.03046
[7] CMS Collaboration, arXiv:1706.08128
![Figure 1. Summary of measurements of the top-pair production cross-section at 13 TeV compared to the exactNNLO QCD calculation complemented with NNLL resummation [3]](https://thumb-us.123doks.com/thumbv2/123dok_us/8127371.1354334/3.482.111.372.92.428/summary-measurements-production-compared-exactnnlo-calculation-complemented-resummation.webp)
![Figure 2. Summary of LHC measurements of the top-pair production cross-section as a function of the centre-of-mass energy compared to the NNLO QCD calculation complemented with NNLL resummation [3]](https://thumb-us.123doks.com/thumbv2/123dok_us/8127371.1354334/5.482.35.433.83.277/summary-measurements-production-function-compared-calculation-complemented-resummation.webp)