Online Data Reduction using Track and Vertex Reconstruction
on GPUs for the Mu3e Experiment
Dorotheavom Bruch1,afor the Mu3e collaboration
1Institut für Kernphysik, Johann-Joachim-Becher-Weg 45, Johannes Gutenberg-Universität Mainz, 55128
Mainz, Germany
Abstract. The Mu3e experiment searches for the lepton flavour violating decay μ+→e+e−e+, aiming to achieve a sensitivity of 2·10−15in its first phase and ultimately aspiring to a final sensitivity of 10−16. During the first phase of the experiment, a muon rate of∼108μ/s will be available, resulting in a data rate of∼80 Gbit/s. The trigger-less readout system is based on optical links and switching FPGAs sending the complete de-tector data for a time slice to one node of the filter farm. A full online reconstruction is necessary to reduce the data rate to a manageable amount to be written to disk. Graphics processing units (GPUs) are used to fit tracks with a non-iterative 3D tracking algorithm for multiple scattering dominated resolution. In addition, a three track vertex selection is performed by calculating the vertex position from the intersections of the tracks. To-gether with kinematic cuts, this allows for a reduction of the output data rate to below 100 MB/s using 12 DAQ PCs.
1 The Mu3e Experiment
The Mu3e experiment [1] is designed to search for the lepton flavour violating decayμ+ →e+e−e+. In the Standard Model (SM) this process is only allowed via neutrino mixing in loops, and it is heavily suppressed to below a branching fraction of 10−54 [2]. Therefore any observation of lepton flavour violation in the charged lepton sector is a clear indication for new physics. Various models beyond the SM predict charged lepton flavour violation at a level to which future detectors are sensitive. The current limit on theμ+ → e+e−e+ branching fraction was set by the SINDRUM experiment at 10−12 [3]. The Mu3e experiment aims to reach a single event sensitivity of 2·10−15in a first phase of the experiment with an existing beamline at the Paul Scherrer Institute in Switzerland (PSI), and aspires to a final sensitivity of 10−16 with an upgraded beamline. This will improve the limit by four orders of magnitude compared to the last experiment. In these proceedings, the focus is on the experimental setup planned for the existing beamline.
The detector design is driven by the requirements to distinguish the signal decay from background processes. Within the detector volume, muons will be stopped in a target and decay at rest. In the case of a signal event, two positrons and one electron are coincident in time and originate from one single vertex as shown in figure 1a. The combined energy of the three particles is equal to the rest mass of the muon and their combined momentum is zero. One source of background is radiative muon decay
(a) Signal event (b) Internal conversion (c) Combinatorial background
Figure 1: Comparison of signal and background events. (a)e+e−e+signal decay particles from one single vertex. (b) Background from internal conversion in an ordinary muon decay (μ→e+νeν¯μe+e−), decay particles from one single vertex, but the neutrinos carry away some energy. (c) Combinatorial background due to positrons from ordinary muon decay combined with electrons produced by Bhabha scattering, photon conversion etc., decay particles not from a single vertex.
where the photon undergoes internal conversion into ane+e−pair: μ+ → e+e−e+ν¯μνeas shown in figure 1b. In this case, the detectable decay products are also coincident in time and have a single vertex, but their momenta do not add up to zero and the combined energy does not equal the muon rest mass. A second class of background process stems from the combination of two ordinary muon decaysμ+→e+νeν¯μclose to one another spatially and temporally together with an additional electron from photon conversion, Bhabha scattering etc. (see figure 1c). When both thee+and thee−from Bhabha scattering or photon conversion are detected, only one additional muon decay is required and the probability of misreconstruction as a signal event is higher.
In order to discriminate signal events from background, excellent momentum, timing and vertex resolution are required. To achieve the desired sensitivity, Mu3e aims for a momentum resolution <0.5 MeV/c, a timing resolution of 100 ps and a vertex resolution of<200μm. The Mu3e detector was designed to meet all of these requirements.
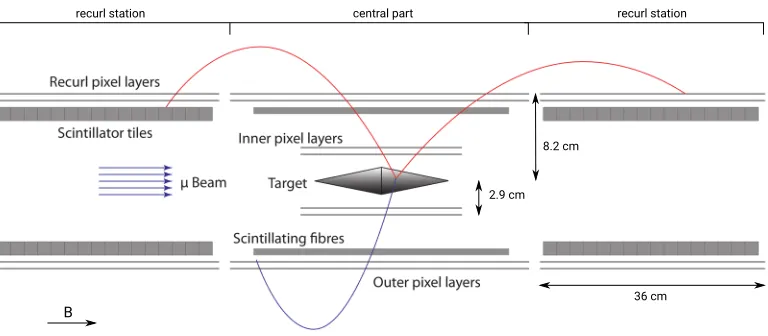
1.1 Detector Design
B
2.9 cm
36 cm central part
recurl station recurl station
8.2 cm
Figure 2: Schematic drawing of the Mu3e detector design.
tiles have a resolution of 70 ps. Muons at high rates are desired to reach the projected sensitivities within a reasonable amount of time. Current beamlines at PSI deliver up to 1·108μ/s. A future high intensity muon beamline could deliver more than 2·109μ/s.
1.2 Readout Scheme
The detector employs a trigger-less readout architecture. At a muon stopping rate of 1·108μ/s this results in a data rate of about 80 Gbit/s. About 100 Mbyte/s can be written to disk, which requires an online system for selecting signal decays. A schematic drawing of the data acquisition is shown in figure 3. The pixel sensors, the fibres and the tiles send zero-suppressed data to front-end Field Programmable Gate Arrays (FPGAs) via flex print cables. Here, the data from a part of the detector is merged and sorted into time slices of 50 ns. These are transferred via optical links to the switching boards where the time slices from each sub-component of the detector are merged. The complete detector information for one time slice is delivered to a single computer of the filter farm via optical links. It is received by an FPGA and shipped to the main memory of the PC by direct memory access (DMA) over a PCIe connection. When analysing 50 ns time slices, the 12 DAQ computers need to process 2·107slices/s, resulting in 1.7·106slices/s each. In order to manage the computing load, Graphics Processing Units (GPUs) are used for the track fitting and vertex selection. The data relevant for the online selection is therefore transferred to each PC’s GPU via DMA, where the selection process takes place.
2 Online Signal Selection
2844 Pixel Sensors
up to 45 1.25 Gbit/s links
FPGA FPGA FPGA ... 86 FPGAs GPU PC GPU PC GPU PC 12 PCs
3072 Fibre Readout Channels
FPGA FPGA ... 12 FPGAs 6272 Tiles FPGA FPGA ... 14 FPGAs Data Collection Server Mass Storage Gbit Ethernet Switching Board Switching Board Switching Board Fr o n t-e n d (in sid e m a g n et ) per board
1 6 Gbit/s link each
FPGA FPGA
FPGA 5 inputs each
PCIe connection 12 10 Gbit/s output links
Figure 3: Readout scheme of the Mu3e detector.
2.1 Geometrical Selection
Before the actual track fit, combinations of hits in the first three detector layers are selected based on few simple geometrical selection criteria. The first is the difference in thez-coordinate of hits between subsequent layers. The second is the difference of the angles in the plane transverse to the beam direction. The mean number of hits per 50 ns time slice in the first and second doublet of layers is∼10, and∼13 respectively, so>1000 three-hit combinations are candidates for the track fit. After applying the geometric selection cuts for differences of hits between the first, second and third layers, this number is reduced by a factor of 70.
2.2 Track Fit
Hits from the central stations of the pixel detector are used to reconstruct tracks using a 3D tracking algorithm developed for multiple scattering dominated resolution [7]. Three hits in subsequent layers, called a “triplet”, are selected and multiple scattering is assumed to occur at the middle hit of the triplet. The effect of multiple scattering dominates over the position resolution of the pixel detector (σpixel=80μm/
√
e+ e+
e
(a)
PCA
xy1
PCA
xy2
PCAxy3
Weighted mean
(b)
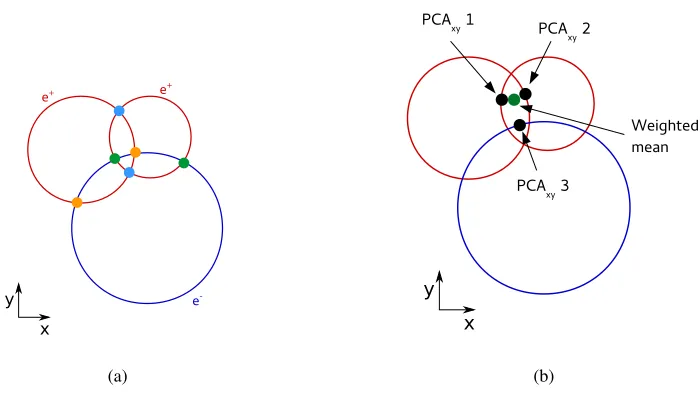
Figure 4: Combination of three tracks projected onto the plane transverse to the beam direction. (a) Intersections of two circles are shown in the same colour. (b) Weighted mean of three intersections from different tracks (different colours in (a)) and the points of closest approach.
are true tracks. The tracks are sorted according to their curvature in the magnetic field into positive and negative tracks to perform the vertex search for two positrons and one electron.
2.3 Vertex Estimate
The vertex search is based on simple geometric constraints to meet the stringent performance re-quirements of the online selection process. All combinations of two positrons and one electron are considered within each time slice of 50 ns. First, only the projection onto the plane transverse to the beam direction, where the helical tracks are circles, is studied to search for intersections of three cir-cles (see figure 4a). For each intersection, weights are calculated based on the uncertainties due to multiple scattering in the first detector plane and due to the pixel size. If all three circles intersect, the weighted meanxyis calculated for all combinations of three intersections from three different tracks. For everyxy, for each track, the point of closest approach to xy,PCAxy, and its weightσPCAxy are determined (see figure 4b). AtPCAxy, thez-coordinatePCAzof the track and also a weighted mean of the threez-coordinateszare calculated. Theχ2is computed from the differences between the PCA and the weighted mean both in the transverse plane and in thez-coordinate:
χ2= 3
i=1
PCAxy,i−xy2
σ2
PCAxy,i
+PCAz,i−z 2
σ2
PCAz,i
of vertex estimate
2 χ
0 10 20 30 40 50 60 70 80 90 100
Number of entries
4
10
5
10
Combinatorial background
Signal
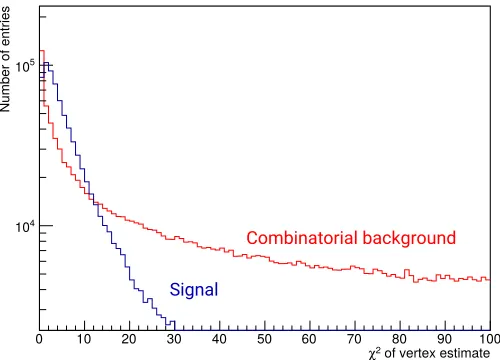
Figure 5: χ2 distribution for vertices from true signal decays (blue) and from combinatorial back-ground from two positron tracks and one electron track intersecting with one another near the target, from a background sample (red). Due to this preselection, the combinatorial brackground also peaks at 0. The normalisation scale is chosen arbitrarily for visualisation purposes.
combinatorial background from three tracks intersecting near the target from a simulated background sample. A vertex resolution of∼440μm in the transverse plane and ∼300μm in thez-coordinate is achieved. For the selection of signal decays, cuts on theχ2value and on the distance between the estimated vertex position and the target surface are applied. In addition, the combined momentum and energy are reconstructed for the three tracks and decays at rest with an energy of the muon rest mass are selected by kinematic cuts. Finally, fake vertices produced by tracks recurling in the central part of the detector are reduced by requiring a minimum opening angle for tracks with small momentum difference.
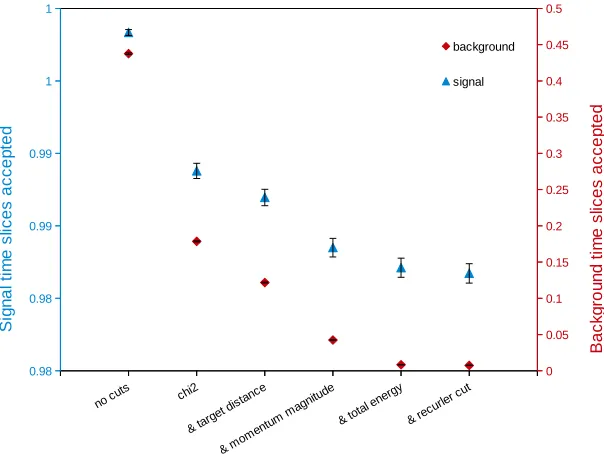
2.4 Signal Efficiency and Accepted Background Fraction
nocu ts chi2 &tar getdis tanc e & m oment umma gnitud e
& tota l ener
gy
& rec urler cut 0.98 0.98 0.99 0.99 1 1 0 0.05 0.1 0.15 0.2 0.25 0.3 0.35 0.4 0.45 0.5 background signal S ig n a l tim e s lic es a c c e p ted B a ck g rou n d ti m e sl ic es a c cep te d
Figure 6: Fraction of signal (blue triangles) and background (red diamonds) time slices for the diff er-ent online selection cuts described in the text. “No cuts” means that no vertex quality cuts are applied, however, the time slice is required to contain two positrons and one electron with 2-track intersections close to the target.
3 Implementation on GPUs
The geometrical preselection will be carried out on the FPGA connected to the DAQ PC via PCIe connection. The track fit and vertex selection have been implemented in CUDA to run on Nvidia GPUs. The triplets of hits selected by the preselection on the FPGA are written into a memory layout suitable to make full use of the memory bandwidth provided by the GPU when accessing the information for the track fit.
The following usage of the hardware was optimised for a GTX1080Ti. This device has 3584 compute units available, the main challenge consists in distributing the work of track fitting and vertex selection on them. To this end, for 24×8192 time slices the selection procedure is started in parallel. For each of the time slices, one block of 128 threads performs the calculations, each thread doing the track fit for one combination of three hits, and looping over the hits in the fourth layer. After all track candidates have been fitted, each of the same 128 threads is used to investigate combinations of one electron and one positron. In each thread, a loop over the positrons in this time slice is performed and the selection decision is taken according to the vertex selection process described in section 2.3.
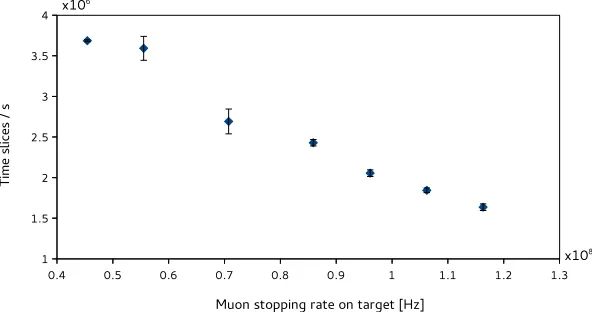
0.4 0.5 0.6 0.7 0.8 0.9 1 1.1 1.2 1.3 1
1.5 2 2.5 3 3.5 4
Muon stopping rate on target [Hz]
Ti
me
sl
ic
es
/
s
x108 x106
Figure 7: Performance of the online even selection algorithm running on a single Nvidia GTX1080Ti GPU versus the muon stopping rate on target.
In addition to an efficient distribution of the workload, it is critical that each single thread performs the selection as quickly as possible. To this end, optimisation techniques known for CPU code were applied as well. For example, values are only saved for reuse if a recomputation takes longer than storing the result in a register. Also, exit conditions of loops are ordered such that the most probable case comes first and trigonometric functions are avoided if possible.
To limit the amount of memory needed on the GPU and to prevent long computation durations for single time slices with high combinatorics, for each time slice the number of hits per layer, the number of three-hit combinations accepted by the geometrical preselection and the number of reconstructed positron and electron tracks are limited. Any time slices exceeding these limits are stored to disk and contribute to the background fraction.
After the optimisations described above, one Nvidia GTX1080Ti can process 2·106time slices/s for events simulated at a muon stopping rate of 1·108Hz, the rate expected during the first phase of the experiment. Figure 7 shows the strong dependence of the performance versus the muon stopping rate on target. The achieved number of time slices per second is sufficient for running with a filter farm of only 12 DAQ PCs. In addition, the filter farm will only be needed in roughly two years when the experiment will be commissioned. Until then, two more generations of Nvidia GPUs will become available on the market. In recent years, every new generation has increased the algorithm’s performance by about a factor of three. This leaves enough margin for the performance presented in these proceedings and opens up possibilities to add more features to the online selection process.
4 Conclusions
the signal time slices and to reduce the background time slices to below 1 %. Due to the significant background reduction, the remaining data can be stored to disk. The selection chain was implemented on an Nvidia GTX1080Ti and its performance was optimised to process 2·106time slices/s. This is sufficient when using the 12 DAQ PCs planned for the first phase of the experiment.
References
[1] A. Blondel, A. Bravar, M. Pohl, S. Bachmann, N. Berger, M. Kiehn, A. Schöning, D. Wiedner, B. Windelband, P. Eckert et al., Research Proposal to PSI (2012)
[2] W.J. Marciano, T. Mori, J.M. Roney, Annual Review of Nuclear and Particle Science58, 315 (2008)
[3] W. Bertl, S. Egli, R. Eichler, R. Engfer, L. Felawka, C. Grab, E. Hermes, N. Kraus, N. Lordong, J. Martino et al., (SINDRUM collaboration), Nuclear Physics B260 pp. 1–31 (1985)
[4] H. Augustin, N. Berger, S. Dittmeier, J. Hammerich, U. Hartenstein, Q. Huang, L. Huth, D. Immig, A. Kozlinskiy, F.M. Aeschbacher et al., Journal of Instrumentation11, C11029 (2016),arXiv:1610.02210v2
[5] H. Augustin, N. Berger, S. Dittmeier, C. Grzesik, J. Hammerich, Q. Huang, L. Huth, M. Kiehn, A. Kozlinskiy, F.M. Aeschbacher et al., NIM A845, 194 (2017),arXiv:1603.08751
[6] N. Berger, S. Dittmeier, L. Henkelmann, A. Herkert, F.M. Aeschbacher, Y.W. Ng, L.O.S. Noehte, A. Schöning, D. Wiedner, Journal of Instrumentation11, C12006 (2016),
arXiv:1610.02021v1
[7] N. Berger, A. Kozlinskiy, M. Kiehn, A. Schöning, NIM A844, 135 (2017),arXiv:1606.04990
[8] A. Kozlinskiy, in these proceedings (2017)
[9] S. Schenk, Bachelor thesis, Heidelberg University (2013),