THE EFFECTS OF FLEXIBLE MANUFACTURING CAPABILITIES AND
LOGISTICS
CAPABILITIES
ON
FIRM
PERFORMANCE:
MASS
CUSTOMIZATION AS A DUAL MEDIATOR
Shyh-Hwang LEE 1 Ching-Yaw CHEN 2 Yu-Je LEE 3 ABSTRACT
This study aims to verify the impacts of flexible manufacturing capabilities and logistics
capabilities, with mass customization as a dual mediator, on the performances of Taiwan
photoelectric companies. Respondents are from department supervisors and managers. Structural
equation modeling (SEM) is used to fit the overall pattern of the structural model and measurement
mode in this study and followed by applying Sobel Test, Bootstrapping, and Mackinnon
PRODCLIN2 method to verify the effect of dual mediator. Results show that: (1) flexible
manufacturing capabilities have a significant positive impact on mass customization; (2) mass
customization have a significant impact on firm performances; (3) flexible manufacturing
capacities also significantly impact on firm performances; (4) logistics capabilities positively
impact on mass customization and (5) logistics capabilities have a significant impact on firm performances. Therefore, “mass customization” plays an important role as a dual mediator in the impact pattern of flexible manufacturing capabilities and logistics capabilities on firm
performances.
Keywords: Flexible manufacturing capabilities, Logistics capabilities, Firms performance
INTRODUCTION
Some recent incidents, such as the earthquake in Japan in 11 March 2011, caused many companies
serious production break-downs. Managers and researchers have realized the importance of green
energy and paid a great attention on the photovoltaic application of solar energy. The photovoltaic
panel manufacturing has become one of the main industries in Taiwan and created significant GDP
1 Shu-Te University, Kaohsiung City, Taiwan 2 Shu-Te University, Kaohsiung City, Taiwan 3
Takming University of Science and Technology, Taipei City, Taiwan Email: [email protected]
Asian Journal of Empirical Research
value. Many empirical researches on electronics industries have been found in the literature.
However, little management studies on the green energy industries are investigated to verify the
impacts of manufacturing and relevant capabilities on firm performances.Since mass production
was first developed on the assembly line technique of Ford Motor Company, production costs have
been much reduced by the further development of standardization to achieve economies of scale in
industry. However, in the last two decades, mass customization emerged from the customer
markets and highlighted the importance of building firm competences not only to reduce product costs but also to satisfy diverse customers‟ needs. Underlying this trend is a view suggesting that the applicability of flexible manufacturing capabilities and logistics capabilities were necessary for
operations management. Our research model argues that flexible manufacturing capabilities and
logistics capabilities should enhance the efficiency of a photovoltaic panel manufacturing
company. In turn, these improvements should enhance their overall performance. We also propose
that the mass customization would mediate the effects of enhancements on performance.
LITERATURE REVIEW
In this section, the existing literature is reviewed to build a theoretical base for proposing
comprehensive hypotheses.
Flexible manufacturing capability
Flexible manufacturing capability is the ability of the firm to manage production resources and
uncertainty to meet customer requests (Buzacott, 1982). Much of the literature on flexibility is
devoted to the study of manufacturing flexibility. Previous research concerning flexibility for
assembly lines has only considered a single flexibility type (process), yet numerous types of
flexibility have been defined in the literature. In an excellent review, Sethi and Sethi (1990)
identified over 50 terms for various flexibility types and classified the flexibility type definitions
below. (1) machine flexibility, (2) production flexibility, (3) operation flexibility, (4) process
flexibility, (5) product flexibility, (6) routing flexibility, (7) volume flexibility, and (8) expansion
flexibility. Empirically measuring flexibility in manufacturing has begun recently in specific
industries and their results indicate that manufacturing flexibility can yield significant benefits
when configured in the correct way (Upton, 1994). Measures for most of these flexibility types
have been attempted and there are varieties of dimensions along which the measures can be
developed and compared. Suarez et al. (1995) listed the dimensions of manufacturing as: (1) mix
flexibility, (2) new product flexibility, (3) volume flexibility, and (4) delivery time flexibility.
These dimensions elaborate the conceptual definition of flexible manufacturing capacity for “this
new capability has been designed to attain the efficiency of well-balanced, machine-paced transfer
lines, while utilizing the flexibility that job shops have to simultaneously machine” (Slack, 1983).
Therefore, this study uses the measured dimensions to assess the performance of flexible
Logistics capability
Most researchers recognized the time-based and multi-dimensional characteristics from the
definition of logistics capability (Daugherty and Pittman, 1995; Wang, 2004). Morash et al. (1996)
investigated the relationships between logistics capabilities and competitive advantage to achieve
successful business results. Their research indicated that two of the dimensions being
demand-oriented and supply-demand-oriented constitute the major part of strategic logistics capabilities.Stank and
Lackey (1997) further classified logistics capabilities into four dimensions, namely: (1) positioning,
(2) agility, (3) integration, and (4) measurement. Liao (1999) explored the relationship of logistics
capabilities and organizational performance and classified the dimensions of logistics capabilities
by (1) delivery: refers to on-time delivery and prompt delivery, and (2) flexibility: means the
delivery treatment that deals with the special customer requirements in a prompt response. Lynch et
al. (2000) proposed that the logistics capabilities should include: (1) process capabilities, (2)
value-added service capabilities. Zhao et al. (2001) presented the conceptual focus of logistics
capabilities and it indicated: (1) customer focus: refers to the point of view of the market-oriented,
with superior skills to understand and meet the customer demand; (2) information focus capacity:
refers to the ability to use and integrate information technology. Wang (2004) developed logistics
capacity with four dimensions: (1) transportation, (2) elasticity, (3) the degree of information
sharing, (4) information technology, and (5) supplier relationships.Based on the above literature
review, we defined the logistics capabilities as “the organizational ability that can deal with normal or special customer requirements of prompt delivery” and used Wang‟ (2004) dimensions for measurement of logistics capabilities.
Mass customization
Mass customization integrates the manufacturing capabilities of elasticity and agility to provide
goods and services that are uniquely tailored to the needs of individual customers (Davis, 1989).
Through mass customization, firms can produce individualized products and services in a
cost-effective manner. Achieving that ability is much influenced by the operational capabilities of
organization (Pine, 1993). Mass customization makes use of information technology system of
production and delivery to effectively meet the needs of individual customers at the cost of mass
production (Kay, 1993). A flexible process is emphasized to provide customers customized
products and services with high yield and reasonable price (Silveira et al., 2001). Tu et al. (2001)
divided mass customization into four types: (1) cost: a customized production process without a
substantial increase of cost, (2) yields: to achieve the economies of scale of production, (3)
response speed: low delivery time, and (4) customization: deliver the tailored products and services
to meet the individual customer needs.In this study, mass customization is defined to make use of
highly agile processes, manufacturing flexibility and the integration ability of organization to meet
individual customer needs in a low cost, high quality and efficient way. The measures of mass
customization, based on the study of Tu et al. (2001), are dimensions of cost, yield, responsiveness
Firm performance
A variety of organizational performance measurement has been found in the literature. Financial
performance is one of the most popular metrics. However, in the rapidly changing markets
facilitated by information, companies can not only rely on the financial performance as the only
one for survival and competition. Only financial performance indicators are impossible to measure
the organizational performance adequately.Therefore, Kaplan and Norton (1996) proposed four
perspectives of the Balanced Scorecard, namely: (1) financial perspective, (2) customer
perspective, (3) internal procedures perspective, and (4) learning growth perspective. Balanced
Scorecard links the organization's strategy, structure, vision together with combining traditional,
and modern enterprise performance metrics, and helps businesses to achieve the goal of long-term
strategy, create customer value, and convert it into the organizational normal activities (Chow and
Haddad, 1997).Both the financial and non-financial aspects have been considered in the Balanced
Scorecard to adequately measure the organizational performance. Financial performance refers to
the real financial output such as EPS, ROS, and other measures of profits. Non-financial
performances are measured by organizational innovation performances such as technological
innovation that provides new products and services by new techniques, and management
innovation that occurred in the organization social system relevant to human resources,
management process and organizational structures (Linh and Hong, 2010). Adopted from the
studies of Kaplan and Norton (1996) and Linh and Hong (2010), four of the performance
dimensions used in this study includes financial performance measure (EPS) and non-financial
performance measures (customer dimension, internal procedures dimensions, and learning and
growth dimensions).
Flexible manufacturing capability vs. mass customization
Manufacturers can produce diverse products through the flexibility and expertise to meet customer
needs for gaining additional profits in niche market without increasing production costs (Pine,
1993).Gooley (1998) proposed that flexible manufacturing capability is one of the essential factors
for achieving the ability of mass customization. Chen (2001) pointed out that mass customization
must respond to customer needs promptly. Therefore, an infrastructure of modern information
technology is essential. The rapid development of the Internet and e-commerce enables enterprises
to quickly access the order and flexible manufacturing system make sure the companies can
efficiently provide customized products of high quality. Wang (2004) showed that flexible
manufacturing capability has a positive impact on mass customization.The perspectives are similar
from the literature review on the studies in different industrial sectors. Hence, we can deduce the
following hypothesis:
Mass customization vs. performance
Tai (2008) proposed that the refined production and mass customization could enhance the
manufacturing performance to some extent. The implementation of mass customization has a
positive impact on manufacturing performance (Lee, 2007). The following hypothesis can be
deduced from the above literature review:
Hypothesis 2: Mass customization will enhance the performance of firm.
Flexible manufacturing capability vs. performance
Guo (1998) indicated that the routing planning of the manufacturing system retains good elasticity
design, not only can smooth the manufacturing process, but also improve the performance of the
system. Chen (2000) showed that the production elasticity morphology makes different and
significant contribution to profit margins rate and sales growth rate. For example, production
flexibility has a positive contribution to profit margins rate.The following hypotheses are deduced:
Hypothesis 3: Flexible manufacturing capability will enhance the performance of firm.
Logistics capability vs. mass customization
The implementation of mass customization relies on the internal logistics capabilities with high
efficiency, the establishment of logistics information system and supply chain coordination. It
indicated that logistics capability have a positive impact to mass customization (Wang,
2004).When logistics technology along with the sustained development of information technology
becomes the base of e-commerce, logistics will be one of the essential elements of mass
customization (Zipkin, 2001). Berman (2002) analyzed three critical success factors for the
implementation of mass customization system. They are three capabilities of information
extraction, flexible processes and logistics.Base on above literature review, the following
hypothesis is deduced:
Hypothesis 4: Logistics capability can strengthen the ability of mass customization to satisfy
diverse customers‟ needs as well as to reduce product costs.
Logistics capability vs. performance
Tsai (2006) showed that the logistics performance has a direct influence on the financial
performance and the benchmarking capabilities have the highest impact on financial performance.
Shih (2008) indicated that logistics center adopted with services innovation could improve logistics
performance.Wang (1998) showed that the logistic automation has a positive impact on the
logistics performance. Lin (2010) showed that the higher the level of logistics service innovation,
the more competitive advantage and better performance the company could gain.From above
Hypothesis-5: Logistics capability will enhance the performance of firm.
METHODOLOGY
Research structure
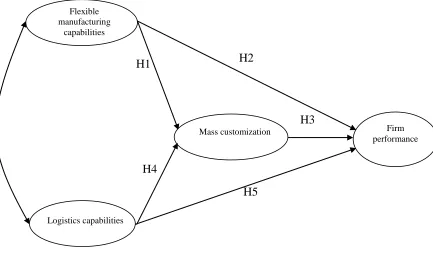
Figure 1 provides an overview of the relationships among flexible manufacturing capability,
logistics capability, mass customization, and firm performance.
Figure 1: Research structure
Questionnaire design and CMV test
Questionnaire design
The sampling frame of the survey was a nationally representative set of photovoltaic panel
manufacturing firms in Taiwan in the year 2010. To increase the content validity and reliability,
questionnaire was designed with pilot test and post-test. The questionnaire will be corrected by
experts in the pilot test and then the survey was sent to the total 550 respondents of supervisors and
managers of the photovoltaic panel manufacturing firms. As a form of post-test, we obtained 208
valid tables (37.8% of sample) from the returned questionnaires. The final scales for all the
measurement items were seven-point, Likert-type scales with 1 = extremely disagree, 2 = strongly
disagree, 3 = disagree, 4 = neutral, and 5 = agree, 6 = strongly agree, 7 = extremely agree (Fritz and
Mackinnon, 2007). The two dimensions of flexible manufacturing capability, including
H2
H1
H3
H4
H5
Flexiblemanufacturing capabilities
Logistics capabilities
Mass customization Firm
“combination of flexibility” and “competence of new product development”, come from Suarez et al. (1995) and the total measures contain eight items.The five dimensions of logistics capability, adapted from Wang (2004), are “delivery”, “flexibility”, “the degree of information sharing”, “information technology”, and “supplier relationship” and the total measures contain fifteen items.The four dimensions of mass customization, adapted from Tu et al. (2001), are “cost”,
“yield”, “responsiveness”, and “customization” and the total measures contain eight items.The two dimensions of firm performance, come from Lin and Hong (2010), Kaplan and Norton (1996), are “financial performance”, and “non-financial performance” and the total self-designed measures contain eight items.How to reduce common method variance has been taken into account at the
beginning of questionnaire survey design. Haman‟s single-factor test and confirmatory factor analysis were applied to examine the problem of common method variance.In other words, this
study uses the difference of value in the chi-square test to examine whether the difference is
significant or not. If the difference is significant, it can be claimed that common method variance
was not significant (Chang, 2011).
CMV test
The questionnaire was tested common method variance (CMV) problems by CFA comparison
method, and the result shows that the difference of between Single Factor and Multi-Factor (Δχ2)
has a big value, so it has no CMV problems happened as shown in Table 1.
Table 1: The results of CMV test
Model χ2 DF Δχ2 ΔDF P
Single Factor 1458.610 209
915.277 27 0.002
Multi-Factor 543.333 182
SEM and measurement system
Confirmatory Factor Analysis (CFA) was employed to test the construct validity of the capabilities
aptitude, mass customization practices and the performance measures in terms of their
dimensionality and convergent validity by using Structure Equation Modeling (SEM). The
questionnaire is divided by the four latent variables: flexible manufacturing capabilities, logistics
capabilities, mass customization, and firm performance. Each latent variable has its sub-variables
and each sub-variable contains a number of question items in the survey. The original questionnaire
data files are setup after the survey is finished as shown in Table 2. Although the questionnaire
design is based on each construct, Dual Measurement method is used to measure the implicit
Table 2: Questionnaire structure
Main constructs Secondary construct or measures Item
number References
Flexible manufacturing capability
Combination of flexibility 4
Suarez et al. (1995), Wang (2004) Competence of new product
development 4
Logistics capability
Delivery 3
Wang (2004)
Flexibility 3
Supplier relationship 3
Information technology 3
The degree of information
sharing 3
Mass customization
Cost 2
Tu et al (2001)
Yield 2
Responsiveness 2
Customization 2
Firm performance
Financial performance 4 Lin and Hong
(2010), Kaplan and Norton (1996) Non-financial performance 4
Linear SEM model
Confirmatory Factor Analysis (CFA), with respect to exploratory factor analysis (EFA), was
employed to test the construct validity of the measures of the four dimensions: flexible
manufacturing capabilities, logistics capabilities, mass customization, and performance. Structural
equation modeling method, including the structural model and the measurement model, is effective
to solve the causal relationship between the latent variables. This study is intended to verify the
model in three parts: (1) the overall fit of the structural relationship model, (2) the fit of the
measurement model, (3) the fit of the structural model (Lee, 2011).
DATA ANALYSIS AND RESULTS
The overall fitness
The overall framework of the model is verified by the factor analysis of sample data. According to
Hair et al. (1998), Three types of measurements for the overall fitness of model are measures of
absolute fit, incremental fit measures, and parsimonious fit measures (Chen et al. 2008).
Table 3: The overall fitness of model
Fitness indices Assessment criteria Results
measures of absolute fit
GFI >0.9 0.921
AGFI >0.8 0.901
RMR <0.05 0.032
incremental fit measures
NFI >0.9 0.904
CFI >0.9 0.902
parsimonious fit measures
PNFI >0.5 0.614
Measurement model
Factor loading of the individual items of the latent variables and the explicit variables is a measure
of linear strengths. The closer is the factor loading and the more of main dimensions can be
explained by the measures of sub-dimensions. The factor loading of sub-dimensions in this study
are all larger than 0.7, which indicated a good reliability. Therefore, the sub-dimensions (all
explicit variables) are able to measure the main dimensions (all latent variables) in the
measurement system of this study. The average variance extracted (AVE) is a measure of degree of
explanation on the measurement variances by the latent variables. The higher is AVE value, the
higher are the reliability and convergent validity of latent variables. Normally AVE value must be
greater than 0.5, so that the dimensions of the cumulative variance is greater than the measurement
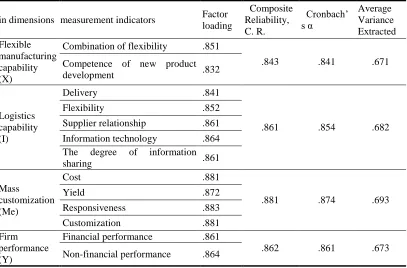
error (Fornell and Larcker, 1981). In this study, the factor loadings are all greater than 0.7,
composite reliability (C. R) and Cronbach‟sα are all greater than 0.7, while the AVE are greater than 0.5, this indicates the latent variables have high reliability and convergent validity (See Table
3 and 4).
Table 4: Indicators for the measurement system of model
Main dimensions
Sub-dimensions or measurement indicators Factor loading Composite Reliability, C. R. Cronbach‟ s α Average Variance Extracted Flexible manufacturing capability (X)
Combination of flexibility .851
.843 .841 .671
Competence of new product
development .832
Logistics capability (I)
Delivery .841
.861 .854 .682
Flexibility .852
Supplier relationship .861
Information technology .864
The degree of information
sharing .861
Mass
customization (Me)
Cost .881
.881 .874 .693
Yield .872
Responsiveness .883
Customization .881
Firm performance (Y)
Financial performance .861
.862 .861 .673
Non-financial performance .864
In this study, AVE method is used to determine the discriminant validity of the formative scales.
According to the recommendations of Fornell and Larcker (1981), the AVE of each dimension
must be greater than the square of the correlation coefficient of the dimensions to ensure the
discriminant validity of our measure. The results in Table 5 provide evidence of convergent and
discriminated validity among the constructs of Balanced Scorecard, innovation activities,
Table 5: Discriminated validity and vonfidence interval estimators
Parameter Estimators
Ψ±2σ Bias-corrected PercentileMethod
Lower Upper Lower Upper Lower Upper
X Me .492 .374 .581 .364 .561 .381 .583
Me Y .564 .431 .712 .412 .673 .424 .721
X Y .491 .381 .592 .371 .583 .371 .592
I Me .483 .431 .593 .421 .584 .434 .593
I Y .563 .433 .701 .424 .691 .424 .712
Coefficient of determination
Coefficient of determination is the square of the coefficient of correlation and it provides us with a
measure of the strength of the linear relationship of variables, particularly when we want to
compare several different models. From the results in Table 6, the latent variables have a moderate
degree of interpretation on the dependent variables.
Table 6: Coefficient of determination
Coefficients of Determination R2
Flexible manufacturing capability (X) →
Mass customization (Me) .242
Mass customization (Me) → Firm performance (Y) .318
Flexible manufacturing capability (X) →
Firm performance (Y) .241
Logistics capability (I) → Mass customization (Me) .233
Logistics capability (I) → Firm performance (Y) .317
Path Coefficient of Latent Variables
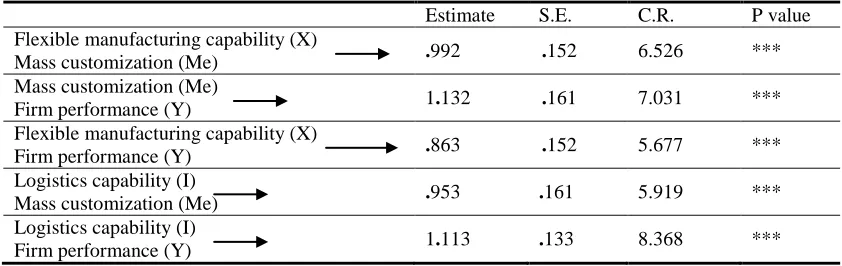
The analysis results of the standardized coefficient and C.R. value are shown in Table 7.
Table 7: Path analysis results of the structural model (Un-standardized)
Estimate S.E. C.R. P value
Flexible manufacturing capability (X)
Mass customization (Me) .992 .152 6.526 ***
Mass customization (Me)
Firm performance (Y) 1.132 .161 7.031 ***
Flexible manufacturing capability (X)
Firm performance (Y) .863 .152 5.677 ***
Logistics capability (I)
Mass customization (Me) .953 .161 5.919 ***
Logistics capability (I)
Firm performance (Y) 1.113 .133 8.368 ***
Table 8: Standardized Regression Weights: (Group number 1–Default model)
Estimate Flexible manufacturing capability (X) Mass customization (Me)
.431 Mass customization (Me) Firm performance (Y)
.562 Flexible manufacturing capability (X) Firm performance (Y)
.582 Logistics capability (I) Mass customization (Me)
.481 Logistics capability (I) Firm performance (Y)
.643
Note: Significance level at: * <0.05, ** <0.01, *** <0.001
Path analysis of structural model
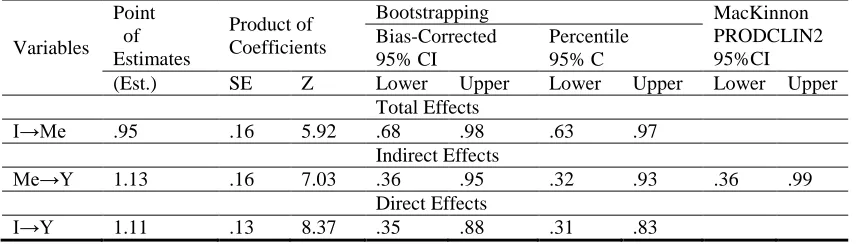
Sobel Test, Bootstrapping and Mackinnon PRODCLIN2 methods are used to test the results of path
analysis with accumulation of intellectual capital as a dual mediator and the results are shown in
Table 9 and 10 (Sobel, 1982; MacKinnon et al. 2007).
Table 9: Dual mediator reports (Un-standardized)
Variables Point
of Estimates
Product of Coefficients
Bootstrapping MacKinnon
PRODCLIN2 95%CI Bias-Corrected
95% CI
Percentile 95% C
(Est.) SE Z Lower Upper Lower Upper Lower Upper
Total Effects
X→Me .99 .15 6.53 .78 .99 .74 .99
Indirect Effects
Me→Y 1.13 .16 7.03 .36 .95 .32 .93 . 38 .97
Direct Effects
X→Y .86 .15 5.68 .35 .62 .35 .74
Table 10: Dual mediator reports (Un-standardized)
Variables Point
of Estimates
Product of Coefficients
Bootstrapping MacKinnon
PRODCLIN2 95%CI Bias-Corrected
95% CI
Percentile 95% C
(Est.) SE Z Lower Upper Lower Upper Lower Upper
Total Effects
I→Me .95 .16 5.92 .68 .98 .63 .97
Indirect Effects
Me→Y 1.13 .16 7.03 .36 .95 .32 .93 .36 .99
Direct Effects
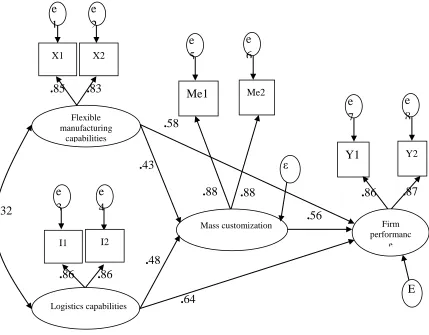
Figure 2: Standardized SEM analysis results
From the results of Table 10, we find that flexible manufacturing capability can strengthen the ability of mass customization to satisfy diverse customers‟ needs as well as to reduce product costs. The value of standardized estimated parameter was 0.43 and Hypothesis H1 was supported. Mass
customization will enhance the performance of firm. The value of standardized estimated parameter
was 0.56 and Hypothesis H2 was supported.Flexible manufacturing capability will enhance the
performance of firm. The value of standardized estimated parameter was 0.58 and Hypothesis H3
was supported.Logistics capability can strengthen the ability of mass customization to satisfy
diverse customers‟ needs as well as to reduce product costs. The value of standardized estimated parameter was 0.48 and Hypothesis H4 was supported.Logistics capability will enhance the
performance of firm. The value of standardized estimated parameter was 0.64 and Hypothesis H5
was supported.Mass customization has a effect of dual partial mediating effect and this implies that
mass production plays an important role in the promotion of firm performance. I2
I1
e
3
e
4
.
86
.
86
X2 X1e
2
.
83
.
85
e
1
e
8
Y1
Y2e
7
.
86
.
87
e
6
Me1
Me2e
5
.
88
.
88
Firm performanc
e
.
58
.
43
.
56
.
48
.
64
.
32
ε
E
Flexiblemanufacturing capabilities
Logistics capabilities
CONCLUDING REMARKS, RESEARCH LIMITATIONS AND FUTURE
DIRECTIONS
The respondent positions are Supervisor and Manager in the photovoltaic panel manufacturing
companies in Taiwan. We find that Hypothesis H1 was supported. It indicated that flexible
manufacturing capability could strengthen the ability of mass customization to satisfy diverse customers‟ needs as well as to reduce product costs for the photovoltaic panel manufacturing companies in Taiwan. The findings are consistent with the studies of Pine (1993), Gooley (1998),
and Chen (2001).Hypothesis H2 was supported. It indicated that mass customization would
enhance the performance of the photovoltaic panel manufacturing companies in Taiwan. The
findings are consistent with the studies of Tai (2008), and Lee (2007).Hypothesis H3 was
supported. It indicated that flexible manufacturing capability would enhance the performance of the
photovoltaic panel manufacturing companies in Taiwan. The findings are consistent with the
studies of Kuo (1998), and Chen (2000).Hypothesis H4 was supported. It indicated that logistics
capability could strengthen the ability of mass customization to satisfy diverse customers‟ needs as
well as to reduce product costs for the photovoltaic panel manufacturing companies in Taiwan. The
findings are consistent with the studies of Wang (2004), Zipkin (2001), and Berman (2002).
Hypothesis H5 was supported. It indicated that Logistics capability would enhance the performance
of the photovoltaic panel manufacturing companies in Taiwan. The findings are consistent with the
studies of Shih (2008), Wang (1998), Lin (2010), and Tsai (2006).This study contributes in existing
literature by integrating the previous researches to construct a structural equation model with three
variables and one dual mediator. The results support the construct validity, as indicated by the
fitness indices and measurement error of the model. This study belongs to the important subject of
confirmatory factor analysis (CFA) with innovation and is worthy of future study in the related
fields.The questionnaire measurements and model dimensions have completed a series of analysis
on reliability, validity and CMV. The adopted statistical methods and research methods are
innovative.The results of this study can provide the photovoltaic panel manufacturing companies, implementing flexible manufacturing capability, to develop the supply chain manager‟s logistics capability when implementing the strategies of mass customization to enhance firm performance.
The study used simple random sampling on the population and sent the questionnaire by post mail.
It caused a low return percentage of samples and resulted in an inadequate representative of the
population. Due to the restrictions of research resources`, the respondents of this survey are limited
to the photovoltaic panel manufacturing companies only in the stock market rather than the whole
market in Taiwan.The literature exploring the dimensions in the subject of this study is few,
particularly the investigations between the dimensions. Therefore, the supporting information
becomes inadequate for the inference.Since this study only limited to the supervisors and managers
in the photovoltaic panel manufacturing companies in Taiwan, it is suggested to try the same
industry but different economics scale, such as small and medium-sized photoelectric companies
Acknowledgement
For undertaking this research project we were helped by Shu-Te University and Takming
University of Science and Technology, Taiwan. We much appreciate their full support for
providing us good research environment.
REFERENCES
Berman, B. (2002). Should your firm adopt a Mass Customization strategy? Business Horizon,
July-august, pp. 51-60.
Buzacott, J. A. (1982). Optimal operating rules for automated manufacturing systems. IEEE Trans.
Automat. Control, pp. 80-86.
Chang, W. H. (2011). Structural Equation Modeling. Ting Mao Books, Taiwan.
Chen, F. C., Fung, S. K., Chen, K. C. and Jen, A. J. (2008). Study on the correlation among
organizational culture, intellectual capital and organizational performance. Chinese
economic research journals, Vol. 6, No. 2.
Chen, J. H. (2000). Study on the relationships among production flexibility, manufacturing
management activities and performance of Taiwan's machine tool manufacturers. Master
Thesis, Graduate Institute of Industrial Management, Chung Hwa University, Taiwan.
Chen, J. I. (2001). Design and production (DTO) business model of mass customization-A case
study of NIKE id. Master Thesis, Graduate Institute of Industrial Management, National
Taiwan University of Science and Technology, Taiwan.
Chen, S. W. (2010). Structural Equation Modeling. Psychological Press: Taiwan.
Chow, W. C. and M. Haddad (August 1997). Applying the balance scorecard to small companies,
Management Accounting, pp. 21-27.
Daugherty, P. J. and Pittman P. H. (1995). Utilization of Time-based Strategies.International
Journal of Operations and Production Management, Vol. 15, No. 2, pp. 54-60.
Davis, S. (1989). From future perfect: Mass Customization. Planning Review, Vol. 17, No. 2, pp.
16-21.
Fornell, C. and Larcker, D. F. (1981). Evaluating structural equation models with un-observables
and measurement error. Journal of Marketing Research, Vol. 18, pp. 39-50.
Fritz, M. S. and Mackinnon, D. P. (2007). Required sample size to detect the mediate effect.
Psychological Science, Vol. 18, pp. 233-239.
Gooley, T. B. (1998). Mass Customization: How logistics makes it happen. Logistics Management
and Distribution Report, April, pp. 49-54.
Hair, J. F. Jr., Anderson, R., Tatham, R. and Black, W. C. (1998). Multivariate Data Analysis (5th
ed.), Upper Saddle River, NJ: Prentice Hall.
Kaplan and Norton (1996). The Balanced Scorecard: Translating Strategy into Action, Boston:
Harvard Business School Press.
Review, Jul-Aug, Vol. 21, No. 1, pp. 14-18.
Kuo, Y. L. (1998). Routing planning on manufacturing flexibility and performance of flexible
manufacturing system.Master Thesis, Graduate Institute of Industrial and Information
Management, National Cheng Kung University, Taiwan.
Lee, T. J. (2007). Scouring production, agile manufacturing and mass customization practices and
their impact on manufacturing performance.Master Thesis, Graduate Institute of Business
Management, Tatung University, Taiwan.
Lee, Y. J (2011). A study on the effect of teaching innovation on learning effectiveness with
learning satisfaction as a mediator. World Transactions on Engineering and Technology
Education, UICEE, Vol. 9, No. 2, pp. 92-101.
Lee, Y. J. (June 2011). A case study on the effect of Teaching Innovation on Learning
Effectiveness: Using a Moderator of „Integrating Information Technology into Teaching,
The Journal of Human Resource and Adult Learning, Vol. 7, No. 1.
Lee, Y. J. (October 2008) A Study of the Correlation and Performance Evaluation among
Innovative Activities, Intellectual Capital and Operational Development: As exemplified
with Listed IT Corporations in Taiwan, Ph. D. Dissertation, Ji-Nan University, China.
Liao, S. K. (1999). Study on the relationship between logistics performance and enterprise
performance. Journal of Taipei University of Technology, Vol. 32, No. 1, pp. 299-312.
L. J. (2010). Logistics service innovation, competitive advantage, and business performance
relationships - The third-party logistics industry. Master Thesis, Graduate Institute of
Business Administration, Chihlee Institute of Technology, Taiwan.
Lin, Y. H. and Hong, L. (2010). The effects of intellectual capital management on organizational
performance: intellectual capital as a mediator. Journal of Human Resource Management,
Vol. 10, No. 1, pp. 1-27.
Lynch, D. F., Keller, S. B. and Ozment, J. (2000). The effect of logistics capabilities and strategy
on firm performance. Journal of Business Logistics, Vol. 21, No. 2, pp. 47-68.
MacKinnon D. P., Friitz, M. S., Williams, J. and Lockwood, C. M. (2007). Distribution of the
product confidence limits for the indirect effect: Program PRODCLIN. Behavior Research
Methods, Vol. 39, pp. 384-389.
Morash, E. A., Droge, C. L. M. and Vickery, S. K. (1996). Strategic Logistics Capabilities for
Competitive Advantage and Firm Success.Journal of Business
Logistics, Vol. 17, No. 1, pp. 1-22.
Pine, B. J. (1993). Mass Customization: The New Frontier in Business Competition. Boston, MA:
Harvard Business School Press.
Sethi, A. K. and Sethi, S. P. (1990). Flexibility in Manufacturing: A Survey. The International
Journal of Flexibility System, Vol. 2, No. 4, pp. 289-328.
Shih, W. W. (2008). The Effects of service innovation on the logistics performance of a logistics
center - A case study of close-typed logistics center. Master Thesis, Graduate Institute of
Silveira, G. D., Borenstein, D. and Fogliatto, F. S. (2001). Mass Customization: Literature review
and research direction. International journal of production economics, Vol. 72, pp. 1-13.
Slack, N. (1983). Flexibility as a manufacturing objective, International Journal of Operations and
Production Management, Vol. 3, No. 3, pp. 4-13.
Sobel, M. E. (1982). Asymptotic intervals for indirect effects in structural equations models, In S.
Leinhart (Ed.), Sociological methodology, San Francisco: Jassey-Bass, pp. 290-312.
Stank, T. P. and Lackey, C. W. (1997). Enhancing performance through logistical capabilities in
Mexican maquiladora firms. Journal of business logistics, Vol. 18, No. 1, pp. 91-111.
Suarez, F. F., Cusumano, M. A., and Fine, C. H. (1995)An Empirical Study of Flexibility in
Manufacturing. Sloan Management Review, Fall, Vol. 37, pp. 25-32.
Tai, C. L. (2008). The impacts of supply chain management on the refining production, mass
customization and manufacturing performance. Master Thesis, Graduate Institute of
Business Management, Tatung University, Taiwan.
Tsai, S. P. (2006). Empirical study on information integration capabilities, benchmarking, capacity
and resiliency of logistics performance and financial performance of Taiwan Manufacturers.
Master Thesis, Graduate Institute of Industrial Management, Chaoyang University of
Technology, Taiwan.
Tu, Q., Vonderembse, M. A. and Rang-Nathan, T. S. (2001). The impact of time-based
manufacturing practices on mass customization and value to customer. Journal of Operation
Management, Vol. 19, pp. 201-217.
Upton, D. M. (1994). The Management of Manufacturing Flexibility. California Management
Review, Vol. 36, No. 2, pp. 72-89.
Upton, D. M. (1995). Flexibility as Process Mobility: the Management of Plant Capabilities for
Quick Response Manufacturing. Journal of Operations Management, Vol. 12, No. 3-4, pp.
205-224.
Wang, C. C. (2004). The relationship on flexible manufacturing capabilities, logistics capabilities and mass customization and consumer‟s value - A empirical study on Information Technology Industry. Master Thesis, Graduate Institute of Logistics Management, National
Don Hwa University, Taiwan.
Wang, K. S. (1998). The degree of automation on logistics, the level of institutionalization and the
logistics performance: A case study of cryogenic logistics industry. Master Thesis, Graduate
School of Business and Administration, Da-yeh University, Taiwan.
Zhao, M., Droge, C. and Stank, T. (2001). The Effects of Logistics Capabilities on Firm
Performance: Customer-focused versus information-Focused Capabilities.Journal of
Business Logistics, Vol. 22, No. 2, pp. 91-107.
Zipkin, P. (Spring 2001). The limits of Mass Customization. MIT Sloan Management Review, pp.