Dissipative energy as an indicator of material microstructural
evolution
N. Connesson1, F. Maquin1, and F. Pierron1
Laboratoire de m´ecanique et proc´ed´es de fabrication (LMPF), Arts et Metiers ParisTech, rue St Do-minique, BP 508, 51006 Chˆalons-en-Champagne cedex, France
Abstract. In this study, the material microstructure evolution has been studied thanks to two indicators: the cumulated plastic strain and the energy dissipation due to internal friction under cyclic loading. An experimental procedure has been designed to underline the variations of the dissipative energy due to cold work on a DP600 specimen. The results showed that the dissipative energy increases with the plastic strain and can be used as an indicator of material microstructural evolution.
1 Introduction
Fatigue characterization is a time consuming and expensive operation commonly undertaken in indus-tria. The development of many theories and experimental measurement technics is thus of first interest to provide faster fatigue limit estimation methods. Thus, with the development of infrared cameras, some authors proposed experimental methods to estimate the fatigue limits based on the material tem-perature increase under cyclic loading [1,2]. Yet, the physical explanation of such methods is not fully understood, and heat dissipation phenomena needs to be more thoroughly studied.
The thermomechanical sources of materials can be dissociated into two main phenomena, such as the thermomechanical coupling and the dissipative energy. The dissipative energy, responsible for the mean temperature increase of the specimen under harmonic loading, can be experimentally measured by solving a heat balance equation [3]. An experimental method to finely measure the dissipative energy is proposed in [4] and is used in this study.
The dissipative energy phenomena is related to internal friction mechanisms [5]: under loading, the material defects (inclusion, dislocations, etc) are moving in the material lattice and dissipate en-ergy, the main part of dissipated energy being attributed to dislocation movements. It seems thus that the dissipative energy should depend on the material microstructure such as the mobile dislocation density, their spatial repartition and interactions, the lattice friction coefficient etc. In fewer words, the dissipative energy should be a good experimental criteria to monitor the material microstructural evolution.
Moreover, it is well known that loading history has a direct impact on the material microstructure. Depending on the applied loading, the dislocations move, extend, multiply [6,7], or create specific spatial structures [8–11] such as cells, persistent slip bands etc. The dislocation density usually increase with the plastic strain.
In this study, it is thus chosen to observe the correlation between the dissipative energy and the plastic strain, both phenomena related to the microstructural dislocation structure.
Few works have been made to analyse the dissipative energy evolution with the cold work. The temperature versus alternate stress curve has been studied in [12,13] on different cold worked speci-mens. Yet, as the materials were loaded withRσ = σσmaxmin =−1 (whereσminandσmaxare respectively
the minimum and maximal stress), heat dissipation was due both to internal friction and macroscopic plasticity.
© Owned by the authors, published by EDP Sciences, 2010 DOI:10.1051/epjconf/20100638013
This is an Open Access article distributed under the terms of the Creative Commons Attribution-Noncommercial License 3.0, which permits unrestricted use, distribution, and reproduction in any noncommercial medium, provided the original work is properly cited.
In this work, these two dissipative energies have been dissociated and attention has been focussed only on the internal friction heat dissipation. Thus, in the rest of this study, internal friction heat dissipation will be simply referred as ”heat dissipation” or ”dissipative energy”.
This paper present thus an experimental measurement of the dissipative energy variation along with the uniaxial plastic strain of a dual phase steel (DP600). The idea is that such experimental data may help to better understand heat dissipation phenomena and provide some data to temperature increase predictive models.
2 Experimental procedure and results
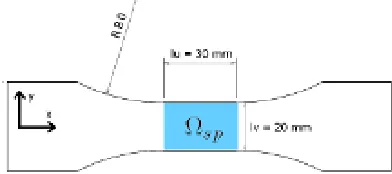
This study has been performed on a specimen machined in a 2 mm thick steel plate of DP600 steel which geometry is presented in Figure 1. The dissipative energy and plastic strain in the observed area
Ωsphave been monitored with the experimental setup presented hereafter.
Plastic strain measurement. The strain has been measured with a 350Ωstrain gauge (Vishay,
CEA-06-250UW-350) connected to a quarter Wheatstone Bridge. This strain gage was bonded on one side of the specimen in the loading direction. In all this study, plastic strain has been measured while no loading was applied to the specimen.
Dissipative energy measurement. The dissipative energy is measured using an infrared CEDIP Jade
camera by applying the experimental procedure proposed in [4]: during a dissipative energy mea-surement, the specimen is cyclically loaded and the temperature field of the observed areaΩspis
acquired. The dissipatives sources are estimated using a local energy balance which general shape is:
ρC ∂θ ∂t−
"
∂θ ∂t
#
(t=0−)
!
−k∆2θ+ρC θ
τ2D th
=d1+Sth (1)
where ρis the material density,C the calorific capacity, kthe thermal conductivity and ∆2 the
laplacien operator.θ is here the local temperature variation measured with the infrared camera. This equation gives thus the local dissipative sourcesd1 and the sources due to the thermoelastic
couplingSthby estimating the energy storage by temperature increase
ρC∂θ ∂t−
h ∂θ ∂t
i (t=0−)
, energy losses by conduction (k∆2θ) and energy losses by convection and radiation (ρCτθ2D
th).τ 2D
th is thus a
time constant characterizing the convection and radiation losses. This equation is then integrated over the observed areaΩsp and over each cycle which provides the dissipative energy per cycle
Ei d1 =
Rti+1/fL
ti 1
Ωsp R
Ωspd1dx dydt. Here, fL is the loading frequency andti the beginning of the
cyclei. In this study, the specimen have been harmonically loaded withRσ = σσmaxmin = 0.1. If the
Fig. 1.Specimen geometry.
maximal stress made plastic strain appear, the cyclic loading was applied during a high enough number of cycle so that the material reached a steady state (the mean strain remains constant).
Moreover, as the dissipative energy is constant during these measurement, only the mean of the dissipative energy has been used in this paper. This mean will be notedEm
d1in the reste of this paper. A noise level analysis showed that the measurement incertitude of a mean dissipative energyEm
d1 (±2 Standard deviations) is of±100J.m−3.cycle−1for a loading frequency of f
L=14 Hz.
This experimental setup provides thus the plastic strainpwhile the specimen is not loaded and the
dissipative energyEm
d1under cyclic loading in steady state conditions. Measurements sequences have been organized in this study to monitor the correlation between dissipative energy and plastic strain.
Four measurement sequences at different loading levels (Phase I to IV) have successively been applied to the specimen, each sequence being designed to reach a different goal: the material initial state behaviour is analyzed during Phase I. The material is then plastically strained and its evolution is analyzed during Phase II. Phase III and IV are then performed to monitor the changes in the material dissipative energy due to the previous two phases.
The tests sequences are represented graphically in the upper graph of Figure 2. In this representa-tion, each point represents three successive tests:
– a cyclic loading at the maximum stressσmax(represented by the point ordinate) applied until a
steady state is reached,
– then a dissipative energy measurement in the same loading conditions, – and eventually a plastic strain measurementpwhile the loading is zero.
The cumulated plastic strainpat the end of each test is presented in the bottom graph of Figure 2.
Phase I: the maximal stressσmaxwas increased form 100 to 240 MPa by step of 20 MPa. The yield
stress at 0.02% being of 295 MPa, the cumulated plastic strain remained small.
Phase II: as in phase I, the maximal stress σmax was increased from 100 to 240 MPa by step of
20 MPa. The plastic strain did not change during these first steps since the material accommodated to these stresses during Phase I. Then, the maximal stressσmaxwas increased from 260 to 440 MPa
by step of 20 MPa while some tests were performed atσmax=240 MPa in-between (dotsD2..D10).
Plastic strain occurred during this phase as the material adapted itself to the loading. No additional strain has been observed during the in-between testsDi. The strain gage bond failed during the test
atσmax=440 MPa. No plastic strain measurements were thus available afterD8.
Phase III and IV: as in Phase II, the maximal stressσmaxwas increased from 100 to 440 MPa by step
of 20 MPa.
The dissipative energyEm
d1 measured during each test is presented versus alternate stressσa and maximal stressσmaxin Figure 3. As the measurement incertitude, which is of±100J.m−3.cycle−1, is
small compared to the scales, no error-bars have been printed in this graph. The general behavior is that the dissipative energy per cycleEm
d1increases with the alternate stress. The dissipative energies during Phase I (Tests up toA) and the first tests of Phase II (Tests up toD0)
were identical: the plastic strain occurring during Phase I (Figure 2) did not change the dissipative energy behaviour. This result shows thus that the dissipative energy measurement is reproducible on the same specimen if the material is not plastically strained.
The dissipative energy of the testsA,D0..D10,C,E, which were all performed at the same maximal
stress σmax = 240 MPa and in steady state behaviour, increase gradually along with the material
cumulated plastic strain. Moreover, the dissipative energy during Phase III is always greater than the dissipative energy during Phase II. The material microstructural changes, occurring during Phase II, increase thus progressively the dissipated energy. These results confirms that the dissipated energy is an indicator of the material microstructural state.
Moreover, the dissipative energies during the last test of Phase II and Phase III (TestsBandD) are identical. The material modifications due to the cumulated plastic strain occurring between the last test of Phase II and Phase III have thus no visible influence on the material dissipative energy behaviour atσmax=440 MPa. Eventually, the measurements achieved during Phase IV point out once again the
good reproducibility of this measurement on the same specimen if no plastic strain occurs. Phase III and IV are thus the characterization of the dissipative energy stabilized behaviour: this curve could be the material microstructure ”signature”.
0 50 100 150 200 250 300 350 400 s max (MPa) 0 500 1000 1500 2000 2500 Test sequence e
p (10 −6)
Phase I Phase II Phase III Phase IV
Strain gage failure during
test
D1 D2 D3 D4 D5 D6 D7 D8 D9 D10 D0 A B C D E F
Fig. 2.Maximal stressσmaxapplied for each test and cumulated plastic strainpat the end of each test.
0 20 40 60 80 100 120 140 160 180
0 2000 4000 6000 8000 10000 12000 14000 16000 18000
sa (MPa)
Ed1 m (J.m −3 .cycle −1 )
0 50 100 150 200 250 300 350 400
0 2000 4000 6000 8000 10000 12000 14000 16000 18000
smax (MPa)
Phase I Phase II Phase II int Phase III Phase IV
103 104 105 106
2000 2500 3000 3500 4000 4500
sa (MPa)
Ed1 m (J.m −3.cycle −1)
B,D,F
A,D0
C,E
A D0,D1
D2,D3
D4 D5 D6 D7 D8 C D9 D10 E
Fig. 3.Dissipative energy measurementEm
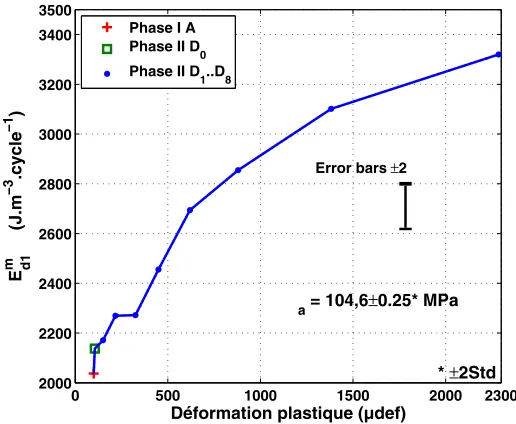
It is also possible to present the dissipative energyEm
d1measured during the testsA,D0..D8versus the cumulated plastic strainp (Figure 4). The dissipatives energiesEm
d1 of this graph have all been measured with the same experimental settings (σa = 104,6±0.251MPa,Rσ = 0,1, etc.). The only difference from one test to another is thus the material microstructure modification due to cold work. Figure 4 presents thus in a different way that the dissipative energyEm
d1 increases with the plastic strain. It is yet worth noting that the increase rate of the dissipative energy is greater for small plastic cumulated strain.
0 500 1000 1500 2000 2300
2000 2200 2400 2600 2800 3000 3200 3400 3500
Déformation plastique (µdef) E d1
m (J.m −3 .cycle −1 )
Phase I A
Phase II D0
Phase II D1..D8
sa = 104,6±0.25* MPa
Error bars ±2s
* ±2Std
Fig. 4.Dissipative energy measurementEm
d1atσmax=104,6±0.25 MPa versus plastic strain
p.
3 Conclusion
The dissipative energy due to internal friction of a dual phase steel evolution with the plastic strain has been measured. First, it clearly appeared that the dissipative energy due to internal friction increases with the plastic strain. When no plastic strain occurs, the dissipative energy measurement is well reproducible on the same specimen. Thus, the measurement of the dissipative energy variation versus the alternate stress in the stress domain where no plastic strain occurs is a ”signature” of the material. Correlation of the DP600 dissipative energy signature during fatigue tests will be studied in future works.
References
1. H.F. Moore, J.B. Kommers, Chemical and Metallurgical Engineering25, (1921) 1141-1144 2. G. Fargione, A. Geraci, G. La Rosa, A. Risitano, International Journal of Fatigue24, (2002)
11-19
1 ±2 Standard deviation of the alternate stressσ a.
3. A. Chrysochoos, H. Louche, International Journal of Engineering Science 16, (2000) 1759-1788
4. F. Maquin, F. Pierron, Mechanics of Materials41, (2009) 928-942
5. D. Caillard, J.L. Martin,Thermally activated mechanisms in crystal plasticity(Pergamon, Am-sterdam London 2003) 85-123
6. A. Granato, K. L¨ucke, Journal of Applied Physics,27:6, (1956) 583-593 7. T. Tanaka, S. Hattori, Bulletin of the JSME,(21:161) (1978) 1557-1564 8. C. D´epr´es, M. Fivel, L. Tabourot, Scripta Materialia,58:12(2008) 1086-1089
9. T. Fujii, C. Watanabe, Y. Nomura, N. Tanaka, M. Kato, Materials Science and Engineering A,
319-321(2001) 592-596
10. P. Luk´a˘s, L. Kunz, Materials Science and Engineering A,322:1-2(2002) 217-227
11. H. Mughrabi, F. Ackermann, K. Herz, ASTM Special Technical Publication,675, (1979) 69-105