Categorization of the Documents using
K-Means & Mapreduce
Amol Jagtap1,
P.G. Student, Department of Computer Engineering, AISSMS COE, Shivajinagar, Pune, India1
ABSTRACT: Clustering is nothing but grouping similar items together. Clustering documents can be very useful for
Information retrieval, News papers publishing house, Government agencies etc. K-means is simple to implement, widely used clustering algorithm used for clustering. But to process large documents using one machine is good solution. So Apache Hadoop which supports Mapreduce framework can be a good solution. Hadoop uses distributed computing and distributes task to multiple nodes (map stage) and then combine all outputs together (reduce stage) to generate final output. All these tasks executed parallely. So performance can be increased. Checking cluster quality is also equally important. For that Davies Bouldin Index is used.
KEYWORDS:Clustering, K-means, Apache Hadoop, Preprocessing, Stemming, Term Frequency, Inverse Document
Frequency, Mapreduce, Cluster quality, Davies Bouldin Index.
I. INTRODUCTION
Document Clustering is a useful tool that can help the MNC’s for processing large amount of documents. Unlabeled documents are grouped together into clusters as per their similarity. Document clustering can also be used for automatic topic extraction and for fast information retrieval or for filtering [1]. Some interesting approaches to document clustering can be found in [2-5]. Survey on Document clustering applied to web engines can be found in [6]. Traditional approaches used for document clustering were applicable for only small and controlled datasets. In reality documents set is large and noisy. For example, Wikipedia contains set of documents acquiring 10 TB of storage. Internet also causing huge generation of documents.
The K-Means clustering algorithm is simple and has been used for solving different domain problems [7]. In past use was restricted to small data sets only however in reality we find large amount of data to be processed which can not fit into main memory [8]. Apache Hadoop can be solution for this problem. However less work is done on performance of Hadoop framework [12]. With this aim is to run K-Means algorithm on large amount of documents on Hadoop and then studying the gain in performance caused by this solution [9]. K-Means algorithm is chosen here because it is most popular and easy to implement algorithm [10].
To check quality of cluster Davies Bouldin Index algorithm can be used. Index values vary from 0 to 1. Closer the value to zero more is the quality. Distance between centroids of clusters should be more and distance between intra cluster points should be less.
II. RELATEDWORK
Each clustering type is better suited than to a particular type of problem. Abbas concluded that partitional algorithms are suited for large data set while hierarchical are for small data sets. Singla, Yadav and Sing presented some arguments in favor of partitional algorithm. According to them, there is no need to determine the full dendrogram with a partitional algorithm. They also found that the time complexity of partitonal algorithm is little compared with hierarchical. Zhao and Kaprypis had similar results. On the other end, hierarchical algorithms have the advantages of an easily interpreted graphical representation and ignorance of influence from initialization and local minima.
III.SYSTEMARCHITECTURE
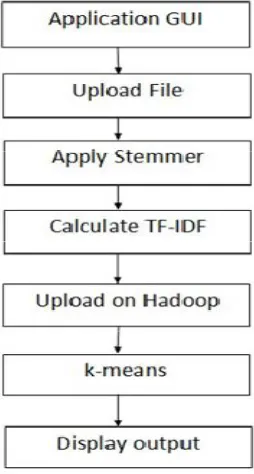
Figure 1 explains the architecture of the system. Through application GUI we will accept input (set of documents). Stemming is applied on the documents to keep only important word in the documents. Porter Stemmer is good option for that. Once less important words are removed, TF-IDF is calculated for the remaining words. K-Means need input in number format. TF-IDF is used as a input for K-Means algorithm. Documents with their TF-IDF should be uploaded on HDFS file system of Apache Hadoop before applying K-Means algorithm. Once K-Means is executed we get clusters of documents. Davies Bouldin Index is used to check cluster quality.
Figure 1 System Architecture
IV.THEORY
A. Text Mining
For clustering problems input samples should be vector format. Each part of the vector represents a feature or an attribute. Clustering algorithms then by use some distance measures find out distance between those vectors and the centroids (center of the cluster) In case of document clustering, it is necessary to convert the text into numerical attribute vector format. For documents vector format is represented by using several dimensions.
should separate out words which are having more importance regarding the characterization of the document from words which are less important for characterization.
A popular weighting scheme is the Term frequency – inverse document frequency (TF-IDF). In Term Frequency we calculate the frequency of the word in the document comparing with total number of words in the same document. Whereas in IDF we calculate frequency of the word compared with same word in all documents. IDF is used for improvement. TF(t) = (Number of times term t appears in a document) / (Total number of terms in the document). IDF(t)= loge(Total number of documents / Number of documents with term t in it). For Example, consider one document contains 100 words where word cricket appears 3 times. Therefore the term frequency (i.e., tf) of the word cricket is then (3 / 100) = 0.03. Now, assume we have 1 billion documents and the word cricket appears in one thousand of these. Then, the inverse document frequency (i.e., idf) is calculated as log(10,000,000 / 1,000) = 4. Thus, the Tf-idf weight is the product of these quantities: 0.03 * 4 = 0.12. There are also some more methods that can be for dimensionality reduction.
They are as follows: 1. Filtering
2. Stopword removal 3. Tokenization 4. Stemming 5. Pruning
Stemming is nothing but keeping the word in base form and removing extra words. We stem or reduce words to base form. After applying stemming we will have less number of words (dimensions) to which we can assign TF-IDF values to find distance between centroid and samples. A stemming algorithm reduces the words, ”fishing” ,”fished”, and ”fisher” to the root word, ”fish”.
B. K-Means
K-Means algorithm partitions the samples into clusters by minimizing a distance between samples and centroid point of the cluster. There are many different distance measures available out of which Euclidean distance measure is widely used.
The K-Means algorithm steps are given as: 1. Decide number of clusters k.
2. Initialize centroids (center of clusters) randomly c1, c2. . . ..,ck.
3. For each point find closest centroid (by some distance measure) and assign the data point to that cluster. 4. Re-compute the centroids by taking means of all the point in cluster.
5. Stop when there is no change observed in the cluster (i.e. when it converges)
K-Means clustering is having high complexity when data sets are large. Single machine memory can be a barrier for the performance. As a result K-Means was not used for large data set in the past.
C. Apache Hadoop Solution
The Apache Hadoop software library is a framework that allows for the distributed processing of large data sets across clusters of computers using simple programming models. It is designed to scale up from single server to thousands of machines, each offering local computation and storage. Hadoop uses MapReduce which is a distributed programming MapReduce has two user defined functions: map function and reduce function, specified on a job. Input job (here in our case document clustering) is split into multiple small jobs and stored in independent blocks which are then parallely processed by the map functions.
Data is stored on datanode with replication factor. Actual calculation is done on data node locally to reduce network uses. However there is trade-off between overhead of map reduce and performance gain. As if data is less, then their will be less CPU utilization and more network utilization. Performance gain is less (even zero) in that case. Splitting job into multiple jobs and combining all outputs to from final output can be difficult for complex data sets. Hadoop need input file in specific format called as Sequence files. Sequence files are flat files consisting of binary key/value pairs. There are three types of the sequence files: uncompressed, record-compressed, block compressed. So documents need to be converted into sequence file format.
While executing K-Means on the Hadoop cluster we have to provide following parameters: 1. Sequence file containing input vectors.
2. Sequence file containing initial cluster centers.
3. Similarity measure to be used.
4. Maximum iterations for longer jobs
5. Number of reduce jobs
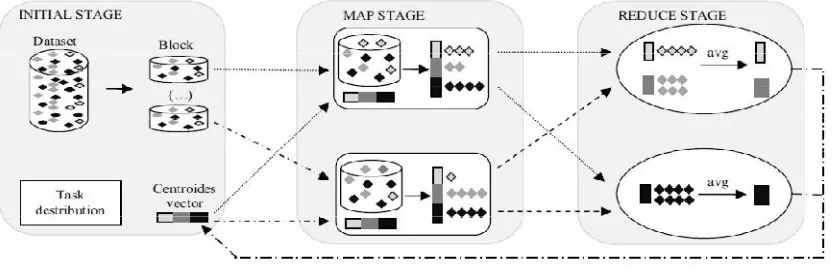
User gets output as centroid coordinates and the samples attributed to each cluster. Output is again stored in sequence file format. There are three stages in a K-Means job (given in Figure 2):
1. Initial Stage: Input data is segmented into HDFS blocks (each having size 64 MB), replicated and transferred
to other machines (Datanodes).
2. Map stage: Distance between samples and centroid is calculated. Then data samples are assigned to nearest centroid and to cluster.
3. Reduce Stage: By taking mean of all the data samples in the cluster new centroid is calculated and again given these values to the Mapper stage as a feedback.
Figure 2. Three stages of K-Means
This loop ends when the centroid converges. Once job is done we can find out time required to execute and quality of clusters.
V. EXPERIMENTAL RESULTS
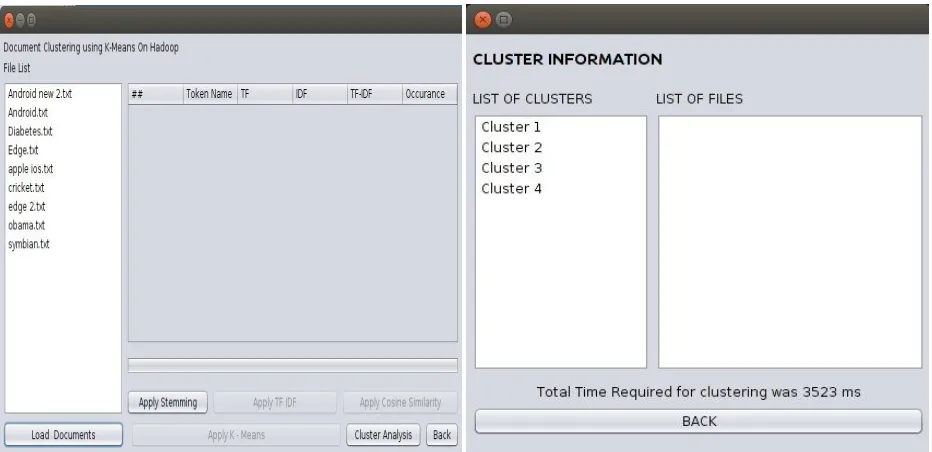
Figure 3 Showing uploaded documents and clusters formed
Figure 3 shows output generated for 9 documents. Four different clusters are formed. Each cluster containing different documents. Tf-Idf cannot be calculated before stemming, so only stemming option is visible after uploading documents. Similarly cosine similarity is applied only after Tf-Idf is calculated. After successful calculation of similarity, K-Means option becomes visible and can be applied on input. Clusters are formed and shown once K-Means is applied successfully on dataset. For above example for nine different documents four different clusters are formed. We can see documents assigned to clusters after clicking on individual clusters.
Figure 4. Davies Bouldin index for cluster quality
Figure 4 shows Davies Bouldin index. This index varies from 0 to 1. Value closer to 1, considered as bad cluster and vice versa. Here for given set of documents value is 0.4 means it is closer to 1 and can be considered as a good cluster. Time required calculating clusters are also displayed. For clustering nine documents on two machines 3 seconds were required.
VI.CONCLUSION
Parallel processing. Distance measure does not have large impact on convergence time. Increasing number of nodes decreases execution time. But CPU utilization is reduced and network utilization is increased. For small dataset use of MapReduce is not that beneficiary.
REFERENCES
[1] Rui Maximo Esteves, Chunming Rong, Rui Pais, “K-Means clustering in the cloud- a Mahout test”, IEEE International Conference on Advanced Information Networking and Applications, 2011.
[2] T. F. Gharib, M. M. Fouad, and M. M. Aref, “Fuzzy Document Clustering Approach using WordNet Lexical Categories”, Advanced Techniques in Computing Sciences and Software Engineering, Springer Netherlands, 2010, pp. 181-186.
[3] N. Kumar, V. Vemula, Vinay Babu, K. Srinathan, and V. Varma, “Exploiting N-Gram Importance And Additional Knowedge Based On Wikipedia For Improvements in Gaac Based Document Clustering”, KDIR- 2010, 2010
[4] S. Banerjee, K. Ramanathan, and A. Gupta, “Clustering short texts using Wikipedia”, Proceedings of the 30th annual international ACM SIGIR conference on Research and development in information retrieval, Amsterdam, The Netherlands, 2007, pp. 787-788.
[5] Pu Wang, C. Domeniconi, and Jian Hu, “Using Wikipedia for Coclustering Based Cross-Domain Text Classification”, Eighth IEEE International Conference on, 2008, pp. 1085-1090.
[6] C. Carpineto, S. Osinski, G. Romano, and D. Weiss, "A survey of Web clustering engines, ACM Comput. Surv.”, vol. 41, no. 3, pp. 1-38, 2009. [7] R. M. Esteves, R. Pais, and C. Rong, “Wikipedia’s Latest Article Clustering”, in Proceedings of the 2011 IEEE Workshops of International Conference on Advanced Information Networking and Applications, 2011, pp. 514-519.
[8] S. B. Kotsiantis , P.E.P., “Recent Advances in Clustering: A Brief Survey”, WSEAS Transactions on Information Science and Applications, 2004, 1, pp. 73 – 81.
[9] Abbas,O.A., “Comparisons Between Data Clustering Algorithms”, The International Arab Journal of Information Technology, Vol 5., No. 3, July 2008, 2008, 5, (3), pp. 320-325.
[10] Singla B., Yadav K., and Singh, “Comparison and analysis of clustering techniques”, Book Comparison and analysis of clustering techniques’ (2008, edn.), pp. 1-3.
[11] YING ZHAO, G.K., “Hierarchical Clustering Algorithms for Document Datasets”, Data Mining and Knowledge Discovery, 2005, 10, pp. 141-168.