The Pattern of Mammalian Evolution and the Relative Rate
of
Molecular Evolution
Simon Easteal
Human Genetics Group, John Curtin School of Medical Research, The Australian National University, Canberra ACT 2601, Australia
Manuscript received May 5, 1989
Accepted for publication September 15, 1989
ABSTRACT
T h e rates of nucleotide substitution at four genes in four orders of eutherian mammals are
compared in relative rate tests using marsupial orthologs for reference. There is no evidence of systematic variation in evolutionary rate among the orders. T h e sequences are used to reconstruct
the phylogeny of the orders using maximum likelihood, parsimony and compatibility methods. A
branching order of rodent then ungulate then primate and lagomorph is overwhelmingly indicated. T h e nodes of the nucleotide based cladograms are widely separated in relation to the total lengths of
the branches. T h e assumption of a star phylogeny that underlies Kimura’s test for molecular
evolutionary rate variation is shown to be invalid for eutherian mammals. Excess variance in nucleotide
or amino acid differences between mammalian orders, above that predicted by neutral theory is
explained better by variation in divergence time than by variation in evolutionary rate.
T
HE neutral theory prediction that, assuming a constant mutation rate, the mean rate of molec- ular evolution is stochastically uniform among line- ages can be tested by comparing the interlineage variance in rate with that expected assuming a Poisson distribution (KIMURA 1968). Several authors (OHTA and KIMURA 197 1; LANGLEY and FITCH 1974; KI-MURA 1983; GILLESPIE 1984, 1986a, b) have reported
that the prediction is inconsistent with data for mam- malian proteins.
This observation has presented a challenge to neu- tral theory. It has led, on the one hand, to the devel- opment of elaborate theories of molecular evolution episodically driven by natural selection (GILLESPIE
1984, 1986a, b); and on the other hand, to attempts to modify neutral theory to make it consistent with the observation by allowing for variable rates of mu- tation and variation in degrees of functional constraint among lineages (KIMURA 1987; TAKAHATA 1987).
Early approaches to testing for rate variance in- volved assumptions about either the divergence times of the compared species (OHTA and KIMURA 197 1) or the branching order of the species (LANGLEY and FITCH 1974). More recently KIMURA (1983) devised a test for evolutionary rate variance based on the as- sumption that the species, proteins or genes being compared diverged from each other within a short period of time relative to the total length of time over which they have been evolving independently of each other, i.e., that assumes a star phylogeny. T h e orders of eutherian mammals are often assumed to have
T h e publication costs of this article were partly defrayed by the payment
accordance with 18 U.S.C. $ 1 734 solely to indicate this fact.
of page charges. This article must therefore be marked “advertisement” in
Genetics 1 2 4 165-173 (January, 1990)
diverged in this way, and it is for this reason (as well as for reasons of sequence availability) that the test has been applied to mammalian proteins.
T h e star-phylogeny assumption is critical to the appropriateness of the test. If the assumption is invalid then variance in nucleotide change might be ex-
plained by divergence-time variation rather than by evolutionary rate variation. There is in fact no sound empirical basis for assuming a star phylogeny for eutherian mammals. T h e pattern of early eutherian evolution is poorly documented in the fossil record (CLEMENS et al. 1979; NOVACEK 1982; KIELAN-JAWO- ROWSKA, BROWN and LILLEGRAVEN 1987) and the assumption is more a reflection of this lack of knowl- edge than of any pattern in the fossil data (WYSS, NOVACEK and MCKENNA 1987). T h e conclusion, de- rived from this or the earlier approaches, that the relative rates of mammalian protein evolution are inconsistent with neutral theory must remain tentative until the relative divergence times of mammalian or- ders can be more accurately determined.
Cladistic analysis of nucleotide sequences can be used to determine the branching srder of taxa, but not their relative divergence times unless rate con- stancy is assumed. However, once a branching order is established, the hypothesis of rate constancy can be evaluated in another way-by the relative rate test (SARICH and WILSON 1967; WU and LI 1985; LI and TANIMURA 1987).
166 S. Easteal derived from protein sequence data (CZELUSNIAK et al. 1982; GOODMAN et al. 1982) but not with others (PENNY and HENDY 1985). It is different from that proposed by KOOP and GOODMAN (1988) based on globin gene sequences using marsupial sequences as outgroups.
In my analysis I used maximum parsimony algo- rithms (HENDY and PENNY 1982; METROPOLIS et al.
1953) with paralogous genes as outgroups. T h e same branching order was indicated by three sets of genes (a-globins, &globins and t-globins), by a high propor- tion of bootstrap samples (FELSENSTEIN 1985) and by maximum likelihood (FELSENSTEIN 198 1) analysis (my unpublished data). However as FELSENSTEIN (1978) and PENNY, HENDY and HENDERSON (1 987) have pointed out, under some circumstances, particularly unequal rates of change, parsimony methods may result in convergence to an incorrect tree. LAKE’S (1 987) evolutionary parsimony method appears to overcome this problem; however, LI et d ’ s ( 1 987) computer simulations have shown that its perform- ance is substantially worse than maximum parsimony unless rate differences are very great (approximately fourfold or more). Use of evolutionary parsimony would thus only seem appropriate when evolutionary rates are known to be highly variable.
As a check for rate constancy in my previous analysis (EASTEAL 1988) I compared the rate of divergence of orthologous (homologous via speciation) mouse and human genes with paralogs (homologs via gene dupli- cation) from four different mammalian orders. No evidence of rate variation was observed; however, since the paralogs are substantially diverged, the sto- chastic error in the comparisons was high and mod- erate rate differences may not have been detected, although, if such differences exist, nonsignificant faster rates for mouse genes would be expected to be consistently observed, which was not the case.
Genomic sequences of marsupial
/3-
and €-globin genes (KOOP and GOODMAN 1988) as well as cDNA sequences of marsupial a-globin (WAINWRIGHT and HOPE 1985) and a-lactalbumin ( C . COLLET, unpub- lished data) are now available. These provide the most closely related sequences that can be used without question as references for comparison of the evolu- tionary rates of eutherian genes.In this paper I compare these genes from four eutherian orders (rodents, ungulates, lagomorphs and primates) with their marsupial orthologs. I demon- strate that the rate of sequence evolution does not vary among the eutherian orders. I then use the same sequences to determine the phylogeny of the orders and to investigate whether the star-phylogeny assump- tion is valid.
MATERIALS AND METHODS
Nucleotide sequences were obtained from the EMBL
(1988 release 14) data base or directly from the published
literature. T h e sources of the sequences are in EASTEAL
(1 988) except for: opossum em- and p”- (KOOP and GOODMAN
1988) and Dasyurus a-globin (WAINWRIGHT and HOPE
1985), human and guinea pig a-lactalbumin (HALL et al.
1982), goat a-lactalbumin (KUMAGAI et al. 1987) and Tam-
mar wallaby a-lactalbumin (C. COLLET, unpublished data).
Multiway sequence alignment, using an iterative proce- dure (FENG and DOOLITTLE 1987) from the computer
package ALIGN (D. SMITH, T h e Australian National Uni-
versity) was performed with a gap penalty of 2.5 and gap-
length penalty of 0. Estimates of synonymous and nonsy-
nonymous substitution rates in coding regions were made
using the method of LI, Wu and Luo (1 985). In noncoding regions corrections were made for multiple substitutions as
described by KIMURA (1983). Formal analysis of relative
evolutionary rates was by the method of Wu and LI ( 1 985).
Phylogenetic analysis was performed using maximum par- simony, maximum likelihood and maximum compatibility methods. T h e algorithms used were all from the phyloge-
netic reconstruction computer package, PHYLIP
(J.
FELSEN-STEIN, University of Washington). T h e maximum parsimony algorithms, DNAMETRO, DNAPENNY and DNAPARS
use Metropolis-annealing (METROPOLIS et al. 1953), branch
and bound (HENDY and PENNY 1982) and the method of
FITCH (1971), respectively, to find the most parsimonious
trees. Maximum compatibility trees obtained using the
DNACOMP algorithm did not differ in any substantial way
from the maximum parsimony trees and they are not pre-
sented. Maximum likelihood trees (FELSENSTEIN 1981) were
obtained using the DNAML algorithm.
Of the four genes for which marsupial sequences were
available only the three globin genes had been sequenced
in all four eutherian orders. No rabbit (lagomorph) a-
lactalbumin gene was available so that a-lactalbumin was not
included in the phylogenetic analysis.
RESULTS
Relative rates of nucleotide substitution: T h e alignment of noncoding sequences from the P-like globin genes is shown in Figure 1. Alignment of the long second exons of these genes was problematic and they were not included in the analysis. For the a- globin and a-lactalbumin genes only the coding re- gions were compared. T h e coding region of the Tam- mar wallaby a-lactalbumin gene is three codons shorter than that of the goat and human genes and 39 codons shorter than that of the guinea pig gene at the 3’ end. Only the regions of the eutherian genes that aligned within the boundaries of the marsupial gene were compared.
T h e substitution rates between the eutherian and marsupial genes for synonymous and nonsynonymous sites in coding regions and noncoding regions are shown in Tables 1, 2 and 3, respectively. In all com- parisons the mean synonymous rates are similar to the noncoding rates suggesting that the synonymous sites are evolving largely without functional constraint.
5 ' NON-COOING
10 20 30 40 50 60 70 80 90 100
GATAAAAGG-CAGAGCTAGATTAGTTTCAGCATCATA-CTACTTTTGACACAGCTCTG--TGTTCACAAGTAAACT---
AATAAAAGG-CAGCCCTAGCCCTACTGCTGCATCAAC-CTGCTTCTGACACTTCTG----TGTTGACAAGCAAGCT--- TACAAAGACCAACATC
CATATAAGG-TGAGGTAGGATCAGTTGCT-CCTACAT-TTGCTTCTGACATAGTTG----TGTTGACTCACAAC--- CCCAGAAACAGACATC
AATAAAAGGCCACCACTTCT--AGCAGCAGTACGTACTTCGCTTCTGACACTCCTG----TGATCACCAGCAACC--- TCCCAGACTTGCCATC
AATAAAAGGACAGGTCTTCA--GCCTCTTGAACATTC-TGGCTT-TTGCACACTTG----AGATCATCTCCAACG--- TTCTAGACCTCACACC CATAAAAGG-AAGAGCTGGGCCAGCTGCTGCTTACAC-TTGCTTCTGACACAACCG----TGTTCACTAGCAAC--- TACACAAACAGACACC
AATAAAAGGCCACAGCATCC--AGCAGCAGCACAGAC-TTGCTTCTGATGCTTCTG----TGATCACCTGTAAGC--- TCCACGACTTGACATC
AATAAAAGGCCATGCAGTGA--AGCAGCGGCACAGAC-TTGCTTCTGGCCCATTAT----GGATCACCAGTAAGC--- TCCCA---GACACC
CATAAAAGT-CAGGGCAGAGCCATCTATTGCTTACAT-TTGCTTCTGACACAACTG----TGTTCACTAGCA--- ACCTCAAACAGACACC
AATAAAAGGCCAGACAGAGA--GGCAGCAGCACATAT-CTGCTTCCGACACAGCTG----CAATCACTAGCAAGC--- TCTCAGGCCTGGCATC
AATAAAAGGAAGCACCCTTC--AGCAGTTCCACACAC-TCGCTTCTGGAACGTCTG----AGGTTATCAATAAGC--- TCCTAGTCCAGACGCC
CATAAAAGG-CAGAGCAGGG-CAGCTGCTGCTTACAC-TTGCTTTTGACACAACTG----TGTTTACTTGCAATC--- CCCCAAAACAGACAGA
AATAAAAGGCCAAGCCTTGA--AGCAGCAGCACAAAG-CTGCTTCTGACACATTTGTGATCGATCACCAGCAAGC--- TCCCAGACGTGACACC
AATAAAAGGACGAGCCTTAG--AGCAGTTTCACATAC-TTGCTTCTGAGACATCTG----AGACTATCAGCAAGCTCAGCGAGCTCCTAGACCAGACATC
TTCAAA"""----
INTRON 1
110 120 130 140 150 160 170 180 190 200
GTAAGTACCAGGGGCCATGGAAAAGGGCC---ATGAAGA--- GGGGCAGGGAATGACAACT-GCAATTAGTCGT---"CGAATAGTAA
GTTGGTATCCAGGTTACAAGGCAGCT--- CACAAGAAGAAGTTGGGTGCTTGGAGACAGAG---GTCTGCTTTCCA---G-CAGACACT
GTAAGGA-ATGGAGGGAAATTAT-CCTTATGCATGGCA-GAAATTT---CCAGGGTTTCTA--- TAGGGTTTTGTGGCACACT"
GTAGGTATCCCACTTACAAGGCAGGTTTA--AGGAGAGTGAAATGCACCTGGGCGTGTGAGGACAGAGCCGTC-CCTGAGATTCA---GAGAGCTGCT GTAGAAA---GTGG---ACTTCATGGGGGAGGATGGTGAATATGAGCCTGGCAAATCGG-CCAGAAAA---ATTCTTCAAAA--ATCTGAGTTGCT GTAAGCA---GTGG--- ACACAGGTAGGAGAGGAGTGTACAAAGGC--TGAAAGTGTT-CCAGAAAAGAGGGACTGGTTAGGTTTCTTACATACTCT GTTGGTATCAAGGTTACAAGACAGGTTTA--AGGAGACCAATA-GAAACTGGGCATGTGGAGACAGAGAAGACTCTTGGGTTTCT---GATAGGCACT GTAAGCA---TTGGTTCTCAATGCATGGGAATGAAGGGTGAATATTACCCTAGCAAGTTGA-TTGG-GAA---AGTCCTCAAGATTTTTTGCATCTCT GTAGGCT-CTGGTGACCAGGACA-AGGGAGGGAAGGAAGGACCCTGTGCCTGGCAAAAGTC-C--- AGGTCGCTTCTCAGGATTTGTGGCACCTTCT GTTGGTATCCTTTTTACAGCACA-ACTTA--ATGAGACAGATA-GAAACTGGTCTTGTAGAAACAGAGTAGTCGCCTGCTTTTCT---GCCAGGTGCT GTAAGTA---TTGGTTCTCAATACTTGGTAGAGAAAGGCAAATATGACCCTGGTAGACTGA-CCAG-GAA---ATTGCTCAA-AGTTTTTGTATCTCT GTAGGCC-CTGGGGTCCAGGACA-AGGCAGAGGAGGAATGAAACTGAGCCTGGCAGGACTC-C--- AGGCCCTTTCTCAGGACTTGTGAAGCTCTCT GTAAGTA-TGGGAG--- CAGTGGTA-GAAATTGAGCCCAGGAGTAACA-T---ACTGGCCT--TAAAAACTTCTGGCTCACTAT
GTAAGAA-TTG--- TTTTTTAGTGTA-CAAAGAG---CTAGGG-AAATC--- AAGAATTCTGAGGCTCCCT"
3 ' NON-CODING
210 220 230 240 250 260 270 280 290 300
---AAACTTGACT-ACCTCCTTTCTATTTCTTT-CCCAAAG GCCTTGCCCATCTGGTGGTCTTCA---TTGAGCTGAGTCCACTATGTTCCATATAGTCT GTGTATCTGCAAACTAATTTTTCCCTTC---"TCCTACAG ATATAGCCCCGTCTATG---G--- TGGGGGCCTGTGAACACATGGAGGC ---AACTTTCAGTGTCCCCTGT-CTATGTTTCCCTTTTTAG AC----CCCCTTTCCTGCTCTTGCCTGT-GAACAATGGTTAAT-TGTTCCCAAGAGAGC ---TATATTCT-ACTTGTCTTTCTCCAC""-TTAC-CAG GC-"-CCTCTCTCTAGCT-""" GTCCAGCAATCCTGT--GTGTCCGCTAT-GCCT ---GATTTTTTAACTGCTAATGCACTAT--"-GTCT-TAG AC-"-TCCAT-TCCAGT"""- ACACTGGCAATCCCAT--GTGTCTATGAT-GCCC
---GGCTTCCTCTGAC-CTTGTGCTGTTTT-CTCCCCCTAG GC----TCCCmCCTGC"""- TTTCCAGGAAAGGTTTTT-TCATCCTCAGAGCCC ---GATTTTCCATCTGCTATGTTTC""-- CATCTCATAG AT----TCTCT-TTACAAT----TCACCATTTTGTG--- TCCCCAGT-GCCT
---GACTTCTTATCTGTTCTGTGACTATGATCATCCCATAG TT-"-GCC---TG---"-""--- GCCTACCATGCTGGTGCCTATCTGAAGGC
---GACTCTCTCTGCCTATTGGTCTATTTTCCCACCCTTAG GC-"-TCGCTTTCTTGCTGTCCAATTTCTATTAAAGGTTCCT-TTGTTCCCTAAGTCC ---AATTTTGTATCTGATATGGTGT""" CATTTCATAG GT----TCTCT-TCCAGTT---TGCAGGTGTTCCTGT----GACCCTGAC-ACCC ---GACTGTCAAACTGTTCTTG-TCAAT""-CTC-ACAG GC""""" TCACT"""""-- GCCCATGA--TGCAGAGCTTTCAAGGATAG
---GACT-TCTCTCCC--CTGGGCTGTTTTCATTTTCTCAG G A ~ ~ ~ - T C T T T T T C C C T C T G C C A A A ~ ~ ~ ~ ~ ~ ~ ~ ~ ~ ~ ~ ~ ~ - ~ ~ ~ ~ ~ ~ ~ ~ ~ ~ ~ ~ ~ ~ ~ ~ ~ ~ ~ ---GATTTTCTATTTGCTGT'TGTCC-""- CATCATATAG AC----TCTCT-TCCCAGT--- TTCTTTAGTGCCCCTACTCATCCCCAGC-GTCC
---GATACTCCCACCACTATTGTTCTGT""-CTCTATAG A""""" CCCCTT"""""-- CACTGTAG--GACAGAGCTTCTAGGAAGAA OPOSSUM f3
OPOSSUM E MOUSE f3 MOUSE y2 MOUSE p H 1
cow f3
GOAT ~l
GOAT q HUMAN B HUMAN E HUMAN G y R A B B I T B 1 R A B B I T 8 4 R A B B I T 83
OPOSSUM f3
MOUSE f3
MOUSE y2 MOUSE p H 1
cow f3
GOAT ~l
GOAT q
HUMAN f3 HUMAN E HUMAN Gy R A B B I T f31 R A B B I T 84 R A B B I T 83 OPOSSUM E
OPOSSUM B
MOUSE f3
MOUSE y2 MOUSE p H 1
cow f3
GOAT ~l
GOAT q HUMAN f3
HUMAN E HUMAN G y R A B B I T f31 R A B B I T 84
R A B B I T 83 OPOSSUM E
OPOSSUM f3 OPOSSUM E MOUSE f3 MOUSE y2 MOUSE p H 1
cow f3
GOAT €1
GOAT q HUMAN f3
HUMAN E HUMAN G y R A B B I T 8 1
R A B B I T f34
R A B B I T f33
310 320 330 340 350 360 3 7 0 380
ACCTT-CTGCACATGGAATGAATAGGGTCTGACCCTGTGGGCATGGTCCCTGACCAATAAACTGCATTC----" CTTCCA
ATCTG-TCAGTTGTTGGCAAA--ATGATAGACATTTGAAAATCTGTCTTCTGACAAATAAAAAGCATTT--- ATGTTC
CCTCT-CTGCA-CATGAATACT--G---CTGTTCCTGA-AGCACA---TCATGTTAATAAAGCACCTCCGAATCAAAATCG T-CTT-TGACTCCATGGGGACT--GAATTAGGCATTGAGAGCACAAATTTTGTTTAATAAAATTGATTCTTAATAACATTG AAAGA-TTGAATATGGAAAAATTATGA-AGTGTTTTGAGCATCTGGCCTCTGCCTAAT-AAAGACATTT--- ATTTTC
CCAGTGTCCCAGA---A--- GT-TCATCTCCTGAA-G-ACAGAGGGAGAGAGCTTTCTGCAGACATATAACTCCA AACTA-CTAAACTGGGGGATATTATGA-AGGGCCTTGAGCATCTGGATTCTGCCTAATA~AACATTT--- ATTTTC
TCCTT-CTGCA-CATGGGGACT--GGGCTTGGCCTTGAGAGAAAGCCTTCTGTTTAATAAAGTACATTTTCTTCAGTAATC GCTTTATTCTGCAAGCAATA---CAAATAAT--- AAATCTATTCTGCTAA--- GAGATCA """" AATTATGGGGACATCATGA-AGCCCCTTGAGCATCTGACTTCTGGCTAATAAAGGAAATTT--- ATTTTC
TCCTT-CTGTACCTTGGGGACT--AGGCTCAGCCTTGATGGCACAGTTTCTGTTTAATAAAATACATTCTATTCAGTAATC GCTTTATCCCTCAAATAATAATGAAAATAAT--- AAAACTACTCTAAGAAATTATTTGTGATGGTATTGAGTTTA
CCATCTC"-""""-- TTACATGTAAGGAAGGGAGCA-ATGGTTACGTACTGCCTTGTGCTCCCACCCCTTGACCAA
TCCTT-CTGCCCCTTGGGACTG--GGG~GGCCTTGTGAACCCAGATTCTGTTTAATAAAATACATTCTATTCAGTGATC
FIGURE 1.-Multiway alignment of 5' (nucleotides 1-100) 3' (nucleotides 242-381) noncoding sequences and intron 1 (nucleotides 101- 241) for the mammalian functional &like globin genes analyzed. A gap penalty of 2.5 was used for alignment. Gaps are indicated by dashes.
168 S. Easteal
TABLE 1
Rates of nucleotide substitution at synonymous sites between eutherian and marsupial genes
Eutherian order Gene N Rodent Unculate Lacomoroh Primate
a-Globin @-Globin e-Globin
104 102.7 f 20.4 97.1 f 17.6 106.5 f 19.6 114.9 f 24.1
100 90.0 f 16.8 106.9 f 19.4 101.2 f 17.4
101
103.1 f 17.9
92.6 f 16.3 61.5 f 11.2 69.3 f 12.4 67.2 f 12.2
Globin mean 305 96.2 f 10.1 85.2 ? 8.5 89.2 f 9.0 91.2 -t 9.4
a-Lactalbumin 80 86.8 f 17.5 97.2 f 20.0 97.0 f 20.1
Mean 385 94.3 f 8.7 87.5 f 7.8 92.1 f 8.0
Rodent genes are all from mouse except a-lactalbumin from guinea pig. Ungulate genes are all from goat except 8-globin from cow. Lagomorph genes are from rabbit and primate genes are from human.
TABLE 2
Rates of nucleotide substitution at nonsynonymous sites between eutherian and marsupial genes
Eutherian order Gene N Rodent Ungulate Lagomorph Primate
a-Globin 324 17.5 k 2.6 13.9 f 2.2 17.9 f 2.6 13.8 & 2.2
8-Globin 343 23.3 f 3.0 20.7 f 2.9 20.3 k 2.7 20.8 f 2.8
e-Globin 344 13.2
*
2.1 10.5 f 1.9 11.5 f 1.9 12.2 k 2.0Globin mean 1012 18.0 f 1.5 1 4 . 9 f 1.3 16.3 f 1.4 15.5 f 1.4
a-Lactalbumin 334 42.6 f 4.7 38.5 f 4.3 36.4 f 4.1
Mean 1347 23.3 f 1.5 20.1 f 1.4 20.1 f 1.4
~~ ~
TABLE 3
Rates of nucleotide substitution in noncoding regions between eutherian and marsupial genes
Eutherian order Gene N Rodent Uneulate LaeomorDh Primate
8-Globin 314 98.3 f 11.2
r-Globin 31 1 82.4 ? 8.8
Mean 625 89.9 f 6.9
orders; all four orders have the highest and the lowest rate in different comparisons. There does not appear therefore to be any taxon-specific effect on rate such as cell-generation time or global mutation rate.
T h e magnitude of rate differences between taxa can be estimated approximately. Following LI and TANIMURA (1987), for a relative rate test the number of substitutions per site ( K ) between the reference sequence (3) and the point of divergence (0) of the two compared sequences (1 and 2) is obtained as: K O 3
= ( K 1 3
+
K 2 3-
K I 2 ) / 2 . T h e numbers of substitutionsper site in the lineages leading to the compared se- quences are estimated as: KO1 = K 1 3
-
K O 3 and K o ~ =K 2 3
-
K o 3 . T h e ratios, Kol:K02 for the comparisons showing significant differences, range from 1.65 to 1.8 1. For other “total” comparisons (Tables 4-6) and for the different genic regions combined (data not shown) the ratios are closer to 1 .O. Overall the degree of differences in rate between taxa appear to be sub- stantially less than twofold. For this degree of differ- ence the simulations of LI et al. (1987) indicate that93.4 f 10.3 101.9 f 11.8 91.4 k 9.7
77.3 f 8.1 74.0 f 7.5 80.3 f 8.3
84.9 f 6.4 85.8 f 6.5 85.6 f 6.3
maximum parsimony is a more effective method of estimating phylogenies than is evolutionary parsi- mony.
Phylogenetic relationships: T h e single most parsi- monious branching order of the functional genes of the @-globin complex in the four eutherian orders and in marsupials (obtained using DNAMETRO) is shown in Figure 2. T h e numbers at the branches in the tree indicate the percentage of bootstrap samples (of 100 samples) that gave the branch or cluster indicated. All branches are found in a high percentage of bootstrap samples except those leading to: (1) human
p
and rabbitpl
(58%); (2) human Gr, rabbit P3, goat ?I and opossum t (33%); (3) goat 9 and opossum t (52%).Mammalian molecular clock
TABLE 4
Comparisons of the numbers of synonymous substitutions per 100 nucleotides between orthologous eutherian genes by the relative rate test using marsupial genes for reference
Gene
a-Globin &Globin r-Globin Globin total a-Lactalbumin Total
104
66.9 5.6 f 21.1 1.18
74.0 -3.8 f 22.6
0.90
79.8 -12.2 f 26.5
0.73
35.1 -9.4 f 15.4
0.58
38.5 -17.8 f 20.1
0.37
31.5 0.0 f 23.6 0
105
56.6 -16.9 f 18.5
0.54
59.5
-1 1.2 f 17.7
0.68
48.7 -13.1 f 16.7
0.58
37.8 5.7 f 14.6 1.36
36.6 3.8 f 14.7 1.23
35.6 -1.9 f 13.4
0.90
101
76.7 31.1 f 16.5
2.36
66.9 23.3 k 15.9
2.07
57.0 25.4 f 15.1
2.61
56.3 -7.8 f 12.8
0.76
46.0 -5.7 f 12.0
0.78
55.4 2.1 f 13.2 1.08
310
67.1 11.0 f 10.1
1.39
66.4 7.0 f 10.3 1.23
62.5 5.0 f 10.4 1.17
41.8 -4.0 f 7.7
0.82
40.0 -6.0 f 8.0
0.74
40.7 -2.0 f 8.2
0.91
80
69.3 -10.4 f 20.7
0.85
54.2 -10.2 f 19.1
0.68
34.1 0.2 k 16.7 1.01
390
66.8 6.8 f 8.9 1.23
60.6 2.2 f 8.5 1.07
39.4 -4.6 f 6.6
0.94
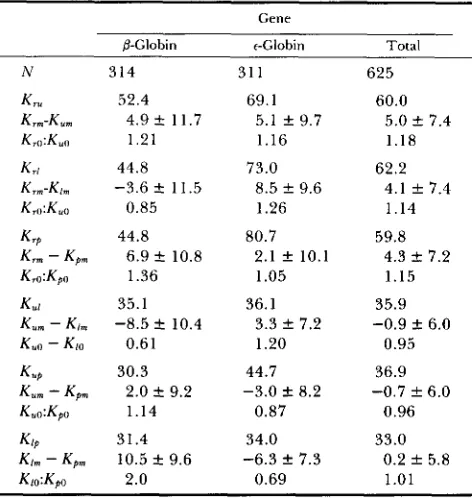
K,] is the substitution rate between orders i and j ; i, j = m , r , u , p and 1 where m = marsupial, r = rodent, u = ungulate, p = primate, 1 =
lagomorph. K,o:K,o is the ratio of substitution rates between orders i and j since their divergence (at point 0) estimated as described in the text.
TABLE 5
Comparisons of the numbers of nonsynonymous substitutions per 100 nucleotides between orthologous eutherian genes by the relative rate test using marsupial genes for reference
Gene
a-Globin &Globin r-Globin Globin total a-Lactalbumin Total
N 320 337 345 1002 337 1339
KT, 9.4 15.7 7.4 10.7 19.6 13.1
Krm
-
Kum 3.6 f 1.9 2.6 f 2.7 2.7 f 1.7 3.1 f 1.2* 4.1 f 3.9 3.2 f 1.3*K,o:Klu 2.24 1.40 2.15 1.81 1.52 1.65
K,I 11.1 12.8 10.4 11.4
K m - K I , -0.4 f 2.2 2.5 f 2.5 1.7 f 1.9 1.7 f 1.3
K,o:K,u 0.93 1.48 1.11 1.35
K , 8.7 12.5 8.8 9.9 17.0 11.6
K m - Kpm 3.7 f 1.9 3.0 f 2.3 1.0 f 1.8 2.5 f 1.3 6.2 f 3.6 3.2 f 1.2*
K,o:Kpo 2.49 1.63 1.26 1.49 2.15 1.76
K,I 10.3 9.2 7.6 9.1
Kum - K I , -4.0 f 2.0 0.1 f 2.1 -1.0 f 1.7 -1.4 f 1.1
K.o:KIo 0.44 1.02 0.77 0.73
KUP 8.6 8.3 4.9 7.1 15.2 9.0
Kwm
-
Kpm 0.1 f 1.8 0.4 f 1.9 -1.7 f 1.4 -0.6 f 1.0 2.1 f 3.3 0 f 1.1KaoXpo 1.02 1.10 0.49 0.84 1.32 1 .O
KIP 11.3 5.2 7.7 8.0
Km
-
Kpm 4.1 f 2.1 0.5 f 1.5 -0.7 f 1.6 0.8 f 0.1Klo:Kpo 2.14 1.21 8.33 1.22
Abbreviations are as in Table 4. * P < 0.05.
170 S. Easteal
TABLE 6
Comparisons of the numbers of nucleotide changes per 100 sites in noncoding regions between orthologous eutherian genes by
the relative rate test using marsupial genes for reference
Gene
&Globin &lobin Total 314
52.4 4.9 f 11.7
1.21
44.8 -3.6 f 11.5
0.85
44.8 6.9 f 10.8
1.36
35.1 -8.5 f 10.4
0.61
30.3 2.0 f 9.2 1.14
31.4 10.5 f 9.6
2.0
31 1
69.1 5.1 & 9.7 1.16
73.0 8.5 f 9.6 1.26
80.7 2.1 & 10.1 1.05
36.1 3.3 & 7.2 1.20
44.7 -3.0 & 8.2
0.87
34.0 -6.3 f 7.3
0.69
625
60.0 5.0 -+ 7.4 1.18
62.2 4.1 f 7.4 1.14
59.8 4.3 & 7.2 1.15
35.9 -0.9 k 6.0
0.95
36.9 -0.7 & 6.0
0.96
33.0 0.2 & 5.8
1.01
~
Abbreviations are as in Table 4.
~~
embryonic-expressed genes, shown branching to the top right, is the same. The order is rodent then ungulate then lagomorph and primate.
T h e tree was constructed by comparison of coding and noncoding sequences. T h e alignment of the non- coding sequences (Figure 1) was made using an itera- tive multiway method. While this is a more rational approach than the intuitive combining of two-way alignments, the alignments produced are not neces- sarily correct as they depend on an arbitrary choice of gap penalties. T h e noncoding sequences were in- cluded in the analysis to maximize the length of the compared sequences. However, because of alignment problems, their inclusion does introduce some uncer- tainty about the results. For this reason the coding and noncoding sequences were analysed separately.
T h e maximum likelihood trees, which have the same topologies as the corresponding maximum par- simony trees (using DNAPENNY) for the @- and a- globin genes and for the coding regions of three classes of genes combined (Figure 3) are the same as those in Figure 2. The proportions of bootstrap sam- ples indicating this branching order for @-globin and total coding regions are approximately the same as the coding and noncoding regions combined (Figure 2). For the a-globin coding regions the branching order is indicated by a smaller proportion of bootstrap samples (59% indicate a primary branching of rodents and 46% indicate a lagomorph-primate monophyletic group). A different branching order is indicated for
the t-globin gene coding regions with the ungulates and primates forming a monophyletic group separate from the rodents and lagomorphs which form a sep- arate group. Both of these groups however are indi- cated by a minority of bootstrap samples. Their valid- ity is thus highly questionable and, rather than indi- cating an alternative branching order, analysis of the globin coding region alone would appear to be insuf- ficient to resolve the branching order.
T h e maximum likelihood trees for the
0-
and E- globin noncoding regions (Figure 4) both have topol- ogies consistent with Figure2.
In both cases, a primary branching of rodents is indicated in a high proportion of bootstraps (100% and 95% for t-globin andP-
globin, respectively). Primates and lagomorphs cluster in 84% of bootstrap samples of 0-globin noncoding regions but in only a low proportion of bootstrap samples of @-globin noncoding regions; the proportion is not shown in Figure 4 because an equally parsimon- ious topology exists that groups ungulates with pri- mates, and which was indicated by a greater propor- tion of bootstrap samples (36%).T h e rodent/ungulate/primate and lagomorph
branching order is thus clearly indicated by one (@-
globin) of three coding regions as well as the combined coding regions and by one (€-globin) of two noncoding regions. T h e a-globin coding region also indicates this topology but with lower probability, and the @globin noncoding region indicates this topology when ana- lyzed by maximum likelihood and indicates that it is one of two most parsimonious topologies. Only one region (€-globin coding region) positively identifies an alternative topology with both maximum likelihood and maximum parsimony methods, however the valid- ity of this alternative topology has low probability as indicated by bootstrap sampling. T h e branching order is thus indicated by different genes and by both coding and noncoding regions. It does not appear to be an artifact arising from analysis of particular genes or from the incorrect alignment of noncoding sequences. T h e topologies of the maximum parsimony and maximum likelihood trees based on the combined coding and noncoding regions are the same (Figure 5). A primary branching of rodents and a clustering of lagomorphs and primates are indicated in 100% and 86% of bootstrap samples respectively. T h e nodes of both trees are widely separated. T h e maximum parsimony and likelihood methods, respectively, in- dicate that in the ungulate, lagomorph and primate lineages, 43% and 37% of the average genetic change since their divergence from rodents occurred before the divergence of ungulates. Similarly the two meth- ods respectively indicate that 34% and 22% of the average genetic change in the lagomorph and primate lineages, arising since their divergence from ungu- lates, occurred before they split (Figure 5).
Mouse BH1
M o u s e E
7 5
-
G o a t c lOpossum I3
c o w
B
1001 R a b b i t P 4
M o u s e B m a j 100 Human E
95
199 100 Human G Y
R a b b i t B1
-
33 R a b b i t 8 3Human
-k
H 1 OOsubs
a -globin
@-globin
L
E-globin
total
H
0.01
FIGURE 3.-Maximum likelihood cladograms for four eutherian
orders (R = rodent, U = ungulate, L = lagomorph, P = primate) rooted by marsupial (M) outgroup based on the coding regions of individual and combined globin genes. The percentage of bootstrap samples showing the branches in the trees are indicated. The scale indicates the expected number of substitutions per site.
E-globin
-R
M- U
q
841 PL
B-globin 071
M i - - T f j = U p
FIGURE 4.-Maximum likelihood cladograms for four eutherian
orders rooted by marsupial outgroup based on the noncoding regions of t and &globin genes. The percentage of bootstrap samples
showing the branches in the trees are indicated. Abbreviations are as in Figure 3. The scale indicates the expected number of substi- tutions per site.
one obtained here have been proposed. Three of these are compared in Table
7.
Tree 1 is that obtained in the present study. Tree 2 is that proposed by Koopand GOODMAN (1 988) in which ungulates diverge first,
followed by Tree
2
alsoFIGURE 2.--Single most parsimonious un-
rooted cladogram of mammalian &like globin
genes (obtained using DNAMETRO). Coding se-
quences, and noncoding sequences shown in Fig- ure 1 were analyzed. the percentage of (100) boots- trap samples showing the branches in the tree are indicated.
primates then rodents and lagomorphs. indicates that primates and rodents are more closely related to eadh other than either is to ungulates, and thus that ungulates are an appropriate reference species for a relative rate test of rodents and primates as suggested by WU and LI (1985). Trees 3 and 4 are two other trees indicating a relatively close relatioqship between rodents and primates. Tree 3 has a branching order of ungulate then lagomorph then rodent and primate. In tree 4 there are two separate monophyletic groups, one consisting of un- gulates and lagomorphs and the other of primates and rodents.
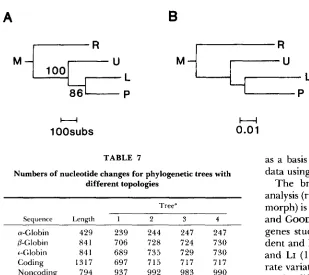
T h e number of nucleotide changes occurring in each of the trees was determined using DNAPARS with the topologies defined. For each of the three globin genes, for the combined coding regions and the combined noncoding regions, and for all regions combined, the numbers of nucleotide changes occur- ring in trees 2, 3 and 4 are similar and substantially greater than in tree 1. Trees 2, 3 and 4 do not therefore appear to be probable alternatives to tree
1.
DISCUSSION
172 S. Easteal
B
FIGURE 5.-Maximum parsimony (A) and max- imum likelihood (B) cladograms for four eutherian orders rooted by marsupial outgroup based on the coding regions of a-, P- and c-globin genes and the noncoding regions of 0- and e-globin genes com- L bined. The percentage of bootstrap samples show-
ing the branches of the maximum parsimony tree are indicated. Abbreviations are as in Figure 3. The scale for the maximum likelihood tree indi- cates the expected number of substitutions per site.
M = p
U
0.0
1A
“1
loo]-”
7 LH
1 OOsubs
TABLE 7
Numbers of nucleotide changes for phylogenetic trees with different topologies
Tree”
Seauence Lencth 1 2 3 4
a-Globin 429 239 244 247 247
P-Globin 841 706 728 724 730
+Globin 841 689 735 729 730
Coding 1317 697 715 717 717
Noncoding 794 937 992 983 990
Total 2111 1634 1707 1700 1707
Tree topologies are as follows:
1 . (Marsupial, (((Lagomorph, Primate), Ungulate), Rodent)). 2. (Marsupial, (((Lagomorph, Rodent), Primate), Ungulate)), 3 . (Marsupial, (((Primate, Rodent), Lagomorph), Ungulate)). 4 . (Marsupial, ((Primate, Rodent), (Lagomorph, Ungulate)).
factors), and may be better explained as reflecting variation in divergence time.
Earlier studies (OHTA and KIMURA 197 1 ; LANGLEY and FITCH 1974) also reported greater variance in the rate of mammalian protein evolution than expected from neutral theory, although different approaches were used in arriving at this conclusion. OHTA and KIMURA’S (1 97 1) approach relied on assumptions ab- out the geological divergence times of species derived from fossil record interpretation which may not be reliable. For instance they assumed a polychotomous divergence of eutherian orders (occurring 80 mya) which, as has been shown here, is an incorrect as- sumption. Their other assumed divergence times may be similarly incorrect.
LANGLEY and FITCH’S (1 974) analysis is based on an assumed eutherian phylogeny that has been shown here to be incorrect. Their approach to testing for evolutionary rate variation should be more sensitive than the relative rate test. However, although both methods involve assumptions about phylogeny, the only assumption made here in applying the relative rate test has been that eutherians comprise a mono- phyletic group when compared with marsupials. On the other hand, LANGLEY and FITCH’S (1974) method requires a complete knowledge of the phylogeny of all compared species. It would be inappropriate to use the phylogeny derived from the DNA sequence data
as a basis for testing for rate variation for the same data using the LANGLEY and FITCH approach.
T h e branching order indicated by the cladistic analysis (rodent then ungulate then primate and lago- morph) is quite different from that indicated by KOOP and GOODMAN’S (1 988) analysis of many of the same genes studied here (ungulate then primate then ro- dent and lagomorph), and from that assumed by W u and LI (1985) in their investigation of evolutionary rate variation (ungulate then primate and rodent).
T h e difference with KOOP and GOODMAN’S (1 988) phylogeny may result from their use of “local-branch- swapping” algorithm (GOODMAN et al. 1979) which is not guaranteed to find the most parsimonious tree. T h e branch-and-bound algorithm used here (DNA- PENNY) is guaranteed to do so. In neither of the other studies was any attempt made to assess the reliability of the trees obtained. In the present study the appropriateness of the use of maximum parsi- mony, compatibility and likelihood methods was es- tablished by a lack of evidence of evolutionary rate variation among taxa. This was assessed independ- ently of the cladistic analysis. The tree obtained here is shown to be reliable by its being indicated from analysis of different genes and of both coding and noncoding regions, and by a high proportion of boots- trap samples. It is also a substantially more parsimon- ious tree than the alternatives discussed above.
T h e results reported here emphasize the impor- tance of accurate phylogenetic information in inves- tigations of evolutionary processes and demonstrate how this information can be reliably obtained from DNA sequence data. Previous comparative studies of molecular data from different eutherian orders
(LANGLEY and FITCH 1974; KIMURA 1983; GILLESPIE 1984, 1986a, b; W u and LI 1985) have concluded that the rate of molecular evolution is variable among lineages. These conclusions depend on phylogenetic assumptions that appear from the present analysis to be incorrect. T h e phylogeny presented here is con- sistent with the results of the relative rate tests which showed that overall there is stochastic uniformity of molecular evolutionary rate among the eutherian or- ders.
the Tammar wallaby a-lactalbumin gene before publication and to J. H. GILLESPIE and D. PENNY for their valuable comments. I also thank D. SMITH, W.-H. LI and J. FELSENSTEIN for providing their computer programs for sequence alignment, estimation of rates of synonymous and nonsynonymous substitutions and phylogenetic reconstruction respectively.
LITERATURE CITED
CLEMENS, W. A,, J. A. LILLEGRAVEN, E. H. LINDSAY and G. G.
SIMPSON, 1979 Where, when and what-a survey of known
Mesozoic mammal distribution. pp. 7-58 in Mesozoic Mammals,
edited by J. A. LILLEGRAVEN, Z. KIELAN-JAWOROWSKA and W.
A. CLEMENS. University of California Press, Berkeley.
CZELUSNIAK, J., M. GOODMAN, D. HEWETT-EMMETT, M. L. WEISS,
P. J. VENTA and R. E. TASHIAN, 1982 Phylogenetic origins and adaptive evolution of avian and mammalian haemoglobin genes. Nature 298: 297-300.
EASTEAL, S., 1988 Rate constancy of globin gene evolution in placental mammals. Proc. Natl. Acad. Sci. USA 85: 7622- 7626.
FELSENSTEIN, J., 1978 Cases in which parsimony and compatibility methods will be positively misleading. Syst. 2001. 27: 401-410.
FELSENSTEIN, J., 1981 Evolutionary trees from DNA sequences: a
maximum likelihood approach. J. Mol. Evol. 17: 368-376.
FELSENSTEIN, J., 1985 Confidence limits on phylogenies: an a p proach using the bootstrap. Evolution 3 9 783-791.
FENG, D.-F., and R. F. DOOLITTLE, 1987 Progressive sequence
alignment as a prerequisite to correct phylogenetic trees. J. Mol. Evol. 25: 351-360.
FITCH, W. M., 1971 Towards defining the course of evolution: minimum change for a specified tree topology. Syst. Zool. 2 0
GILLESPIE, J. H., 1984 The molecular clock may be an episodic clock. Proc. Natl. Acad. Sci. USA 81: 8009-8013.
GILLESPIE, J. H., 1986a Natural selection and the molecular clock. Mol. Biol. Evol. 3: 138-155.
GILLESPIE, J. H., 1986b Variability of evolutionary rates of DNA. Genetics 113: 1077-1091.
G O O D M A N , M., J. CZELUSNIAK, G . W. MOORE, A. E. ROMERO-
HERRERA and G. MATSUDA, 1979 Fitting the gene lineage
into its species lineage. A parsimony strategy illustrated by cladograms constructed from globin sequences. Syst. Zool. 2 8
GOODMAN, M., A. E. ROMERO-HERRERA, H. DENE, J. CZELUSNIAK
and R. E. TASHIAN, 1982 Amino acid sequence evidence on
the phylogeny of primates and other eutherians, pp. 115-191
in Macromolecular Sequences in Systematic and Evolutionay Biol-
ogy, edited by M. GOODMAN. PLENUM, NEW YORK.
HALL, 1. L., R. K. CRAIG, M. R. EDBROOKE and P. N. CAMPBELL,
1982 Comparison of the nucleotide sequence of cloned hu- man and guinea-pig pre-alpha-lactalbumin cDNA with that of chicken pre-lysozyne cDNA suggests evolution from a common ancestral gene. Nucleic Acids Res. 1 0 3503-3515.
HENDY, M. D., and D. PENNY, 1982 Branch and bound algorithms
to determine minimal evolutionary trees. Math. Biosci. 5 9
KIELAN-JAWOROWSKA, A., T . M. BROWN and J. A. LILLEGRAVEN,
1979 Eutheria, pp. 221-258 in Mesozoic Mammals, edited by
406-4 16.
132-163.
277-290.
J. A. LILLEGRAVEN, Z. KIELAN-JAWOROWSKA and W. A. CLE-
MENS. University of California Press, Berkeley.
KIMURA, M., 1968 Evolutionary rate at the molecular level. Na- ture 217: 624-626.
KIMURA, M., 1983 The Neutral Theory of Molecular Evolution.
Cambridge University Press, Cambridge.
KIMURA, M., 1987 Molecular evolutionary clock and the neutral theory. J. Mol. Evol. 2 6 24-33.
KOOP, B. F., and M. GOODMAN, 1988 Evolutionary and develop-
mental aspects of two hemoglobin @-chain genes (e" and p) of opossum. Proc. Natl. Acad. Sci. USA 85: 3893-3897.
KUMAGAI, I., E. TAMAKI, S. KAKINUMA and K. MIURA,
1987 Molecular cloning and sequencing of cDNA encoding goat pre a-lactalbumin. J. Biochem. 101: 51 1-517.
LAKE, J. A., 1987 A rate-independent technique for analysis of nucleic acid sequences: evolutionary parsimony. Mol. Biol.
LANGLEY, C. H., and W. M. FITCH, 1974 An examination of the
constancy of the rate of molecular evolution. J. Mol. Evol. 3:
LI, W.-H., and M. TANIMURA, 1987 The molecular clock runs
more slowly in man than in apes and monkeys. Nature 326:
LI, W.-H., C.-I. Wu and C. C. Luo, 1985 A new method for estimating synonymous and nonsynonymous rates of nucleotide substitution considering the relative likelihood of nucleotide and codon changes. Mol. Biol. Evol. 2: 150-174.
LI, W.-H., K. H. WOLFE, J. SOURDIS and P. M. SHARP,
1987 Reconstruction of phylogenetic trees and estimation of divergence times under nonconstant rates of evolution. Cold Spring Harb. Symp. Quant. Biol. 52: 847-856.
METROPOLIS, N., A. W. ROSENBLUTH, M. N. ROSENBLUTH, A. H.
TELLER and E. TELLER, 1953 Equation of state calculations
by fast computing machines. J. Chem. Phys. 21: 1087-1092.
NOVACEK, M. J., 1982 Information for molecular studies from anatomical and fossil evidence on higher eutherian phylogeny, pp. 3-4 1 in Macromolecular Sequences in Systematics and Evolu-
tionary Biology, edited by M. GOODMAN. Plenum, New York.
OHTA, T., and M. KIMURA, 1971 On the constancy of the evolu- tionary rate of cistrons. J. Mol. Evol. 1: 18-25.
PENNY, D., and M. D. HENDY, 1985 Estimating the reliability of
evolutionary trees. Mol. Biol. Evol. 3: 403-417.
PENNY, D., M. D. HENDY and I . M. HENDERSON, 1987 Reliability of evolutionary trees. Cold Spring Harbor Symp. Quant. Biol.
SARICH, V. M., and A. C. WILSON, 1967 Immunological time scale
for hominid evolution. Science 158: 1200-1203.
TAKAHATA, N., 1987 On the over-dispersed molecular clock.
Genetics 116: 169-179.
WAINWRIGHT, B., and R. HOPE, 1985 Cloning and chromosomal
location of the a- and &globin genes from a marsupial. Proc.
Natl. Acad. Sci. USA 82: 8105-8108.
WU, C.-I., and W.-H. LI, 1985 Evidence for higher rates of nucleotide substitution in rodents than in man. Proc. Natl. Acad. Sci. USA 82: 1741-1745.
WYSS, A. R., M. J. NOVACEK and M. C. MCKENNA, 1987 Amino
acid sequence versus morphological data and the interordinal relationships of mammals. Mol. Biol. Evol. 4 99-1 16.
EvoI. 26: 59-73.
161-177.
93-96.
52: 847-856.