Static Analysis of Plate Made of
Carbon/Epoxy Composite Material by Using
ANSYS
Dr. P. Ravinder Reddy
1, Dr. P. Ramalakshmi
2, K. Niranjan Kumar
3Professor & Head, MED, Chaitanya Bharathi Institute of Technology, Hyderabad, Telangana, India1
Assistant Professor, MED, Chaitanya Bharathi Institute of Technology, Hyderabad, Telangana, India2
PG Student, MED, Chaitanya Bharathi Institute of Technology, Hyderabad, Telangana, India3
ABSTRACT: The static analysis of plate made of composite material under concentrated and distributed loads with simply supported and clamped boundary conditions are used to predict the deflection. The deflection ratio is estimated for the plate with number of layers, and thickness of entire composite pate. In each boundary condition there are two load conditions namely concentrated and uniformly distributed load. A laod of 1000 N is applied in the Z direction. Hence there are four different thicknesses in terms of 6 types of l/t ratio in the order of 10,20,40,60,100,200. Variation of nodal displacements in Z direction with respect to distance from the center is studied. Influence of l/t ratio on the thickness of the plate and the deflection ratio is estimated with different boundary conditions. ANSYS APDL 14.5 is used to carry out the analysis of the plate.
KEYWORDS: Carbon/Epoxy, square plate, FEA, l/t ratio, nodal displacements
I. INTRODUCTION
Static analysis is a type of structural analysis which determines the displacements, stresses, strains, and forces in structures or components caused by loads that do not induce significant inertia and damping effects. Ochola et al and Mahmood Shokrieh et al [1] worked on strain rate behaviour of glass and carbon fibre reinforced composites at varying strain rates and temperatures. Material and structural response vary significantly under impact loading conditions as compared to Quasi-static loading. Gilat et al [2] investigated on Experimental study of strain-rate-dependent behaviour of carbon/epoxAy composite. The strain rate dependent behaviour of IM7/977-2 carbon/epoxy matrix composite in tension is studied by testing the resin and various laminate configurations at different strain rates. Mahmood Shokrieh et al and Reis et al [3, 4] worked on tension behavior of unidirectional glass/epoxy composites under different strain rates. The composite presents an elasto–viscoplastic behavior – the rate dependency only occurs for loading levels above a given elasticity limit. Zubaidy et al [5] developed Mechanical Behaviour of Normal Modulus Carbon Fibre Reinforced Polymer (CFRP) and Epoxy under Impact Tensile Loads. The mechanical properties of unidirectional normal modulus carbon fibre reinforced polymer (CFRP) sheet and Araldite 420 epoxy under quasi-static and medium impact tensile loads. It is found that both the CFRP sheet and Araldite resin were strain rate dependent. Lal Ninan et al [6] developed a Use of split Hopkinson pressure bar for testing off-axis composites. This work attempted to characterize the high strain rate behaviour of composites using off-axis composite specimens.Hosur et al [7] investigated on High strain rate compression of carbon/epoxy laminate composites. The response of carbon/epoxy laminated composites under high strain rate compression loading is considered using a modified Split Hopkinson Pressure Bar (SHPB)
performance polyethylene fibers and composites. The impact energy of these laminates were described quantitatively in terms of fibre, matrix and delamination effects by combining the tensile test results on fibres and unidirectional composites with fracture toughness experiments on laminates. Ferreira et al [11] developed on Static and fatigue behaviour of glass-fibre-reinforced polypropylene composites. Reddy P R et all [12-16] studied the carbon/epoxy material with CNTs and they characterized the parameters for finding ILSS and fracture behaviors using FEA.
II. PROBLEM STATEMENT
A Carbon/epoxy composite orthotropic square plate of 500 mm is taken to analyze. In order to do that the area of the square plate is divided into four parts. The four square plates each plate having the dimension of 250 mmX 250 mm. Therefore only this quarter plate is analyzed as the whole plate possesses the same properties. According to the l/t ratios the total thickness of plate is calculated. As the length „l‟ is constant i,e 250mm then the thickness with respect to l/t ratio are 10, 20 40, 66.6, 100, 200 and the thickness is calculated in mm successively as 25.4, 12.7, 6.35, 3.8, 2.54, 1.27. As the thickness of each layer is constant i,e 0.3mm, the number of layers differs such as 85, 42, 21, 13, 8, 4. Two types of boundary conditions are applied like simply supported (SS) and clamped supported (Clamped). In each type of boundary condition two types of load conditions are applied, they are concentrated load (CL) and uniformly distributed load (UDL). A load of 1000N is applied in Z direction in four cases. The four cases are (i) Simply Supported Plate Under Concentrated Load (SS_CL), (ii)Simply Supported Plate Under Uniformly Distributed Load (SS_UDL), (iii) Clamped Plate Under Concentrated Load (Clamped_CL) and (iv) Clamped Plate Under Uniformed Distributed Load (Clamped_UDL).
III. FINITE ELEMENT MODELING OF THE PLATE
The laminate orientations of all the laminae are 00 as the composite is woven-Fabric. Material properties of orthotropic
Carbon/epoxy are EX= 70.03MPa; EY = 70.03 MPa; EZ = 12.65 MPa; PRXY = 0.04; PRYZ = 0.31; PRXZ = 0.31; GXY =
3.81 MPa; GYZ = 4.19 MPa; GXZ = 4.19 MPa. Mesh refinement is as per the convergence critera.
IV. RESULTS AND DISCUSSIONS
A. Comparison of l/t ratio values with respect to deflection ratio and distances along axes in different cases:
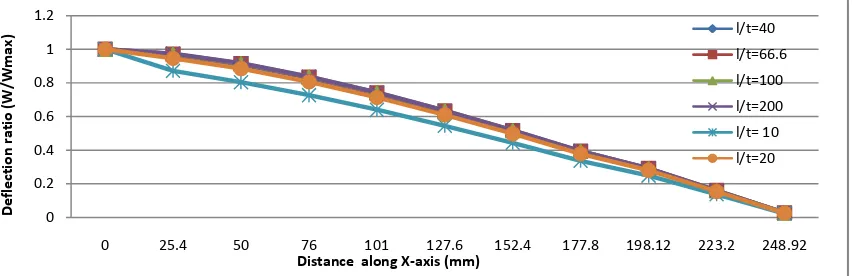
From the Fig.1and 2, it is observed that there is no variation in deflection of thin plates of ranging l/t ratios from 40 to 200 as all the linear curves are completely overlapped with each other. Deflection is decreasing from unity with respect to increase in the distance from the origin as the curve falls linearly from a distance of 0 to 250mm along X- axis from the origin. For thin plates irrespective of any l/t ratio the strength will be same. It won‟t differ. The deflection ratio (W/Wmax) reduced from a distance of 0 to 250mm along X-axis is because the load applied at the centre (concentrated load), the deflection as usually be more at 1st node (central deflection). Though the two curves are originating at distance 0mm, they are diverging each other and finally converging at a distance of 250mm. Deflection ratio is decreasing from unity with respect to increase in the distance from the origin as the curve falls linearly from a distance of 0 to 250mm along X- axis from the origin. Comparatively with the thin plates there is change in deflection for thick with respect to their individual l/t ratio. In thick plates it is seen that the deflection had decreased with increase of plate thickness i, e deflection ratio for l/t=10 has less deflection ratio than l/t =20. This is because l/t=20 has more thickness compared to l/t=10. The deflection ratio (W/Wmax) reduced from a distance of 0 to 250mm along X-axis is because the
load applied at the centre (concentrated load), the deflection as usually be more at 1st node (central deflection) .
(a) Thin plate (b) Thick plate
Fig 1: Deflection ratio of thin and thick plates for simply supported plate with concentrated load at the centre with varying distance along X-axis
Fig 2: Deflection ratio of thick and thin plates for simply supported plate under concentrated load at the centre with varying distance along X-axis
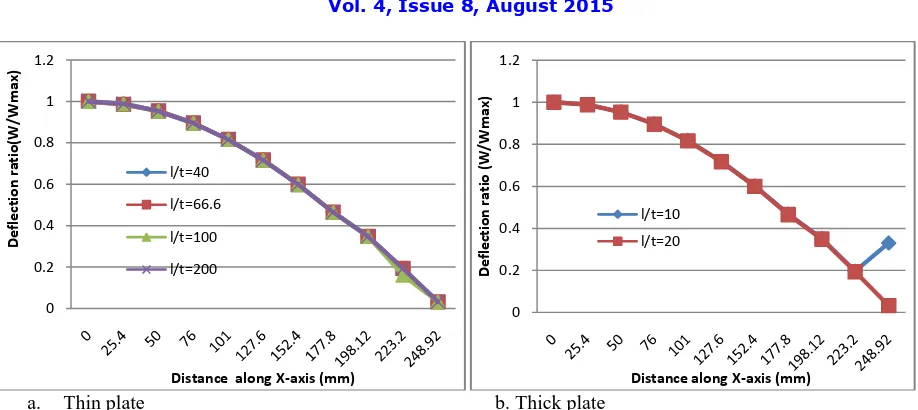
From Fig.3 and 4, comparatively thick plates have less deflection ratio (W/Wmax) than the thin plates. Out of two thick plates, the thick plate which has the l/t ratio of 20 has its deflection nowhere related to the thin plates. But l/t=10 thick plate has its deflection nearer to thin plates as the curve slowly coincides with the thin plates. Finally all the curves start at deflection ratio (W/Wmax) of 1 and end at 0 in the end. Thin plates have more deflection when compared to thick plates due to low strength.
0 0.2 0.4 0.6 0.8 1 1.2
D
e
fl
e
ct
ion
rat
io(W
/W
m
ax)
Distance along X-axis (mm) l/t=40
l/t=66.6 l/t=100 l/t=200
0 0.2 0.4 0.6 0.8 1 1.2
D
e
fl
e
ct
ion
rat
io (W
/W
m
ax)
Distance along X-axis (mm) l/t=10
l/t=20
0 0.2 0.4 0.6 0.8 1 1.2
0 25.4 50 76 101 127.6 152.4 177.8 198.12 223.2 248.92
D
e
fl
e
ct
ion
rat
io (W
/W
m
ax)
Distance along X-axis (mm)
a. Thin plate b. Thick plate
Fig 3: Deflection ratio of thin and thick plates for simply supported under uniformly distributed load with varying distance along X-axis
Fig 4: Deflection ratio of thick and thin plates for simply supported plate under uniformly distributed load with varying distance along X-axis
0 0.2 0.4 0.6 0.8 1 1.2
D
e
fl
e
ct
ion
rat
io(W
/W
m
ax)
Distance along X-axis (mm) l/t=40
l/t=66.6
l/t=100
l/t=200
0 0.2 0.4 0.6 0.8 1 1.2
D
e
fl
e
ct
ion
rat
io (W
/W
m
ax)
Distance along X-axis (mm) l/t=10
l/t=20
0 0.2 0.4 0.6 0.8 1 1.2
0 25.4 50 76 101 127.6 152.4 177.8 198.12 223.2 248.92
D
e
fl
e
ction
r
atio
(W/Wm
ax)
Distance along X-axis (mm) l/t=40
l/t=66.6
l/t=100
l/t=200
l/t=10
a. Thin plate b. Thick plate
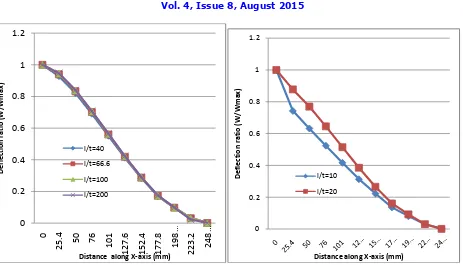
Fig 5: Deflection ratio of thin and thick plates for clamped plate under concentrated load with varying distance along X-axis
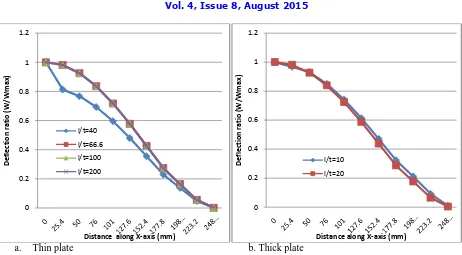
Fig.5 and 6 shows the deflection ratio of thin and thick plates for clamped plate under concentrated load at the centre with varying distance along X-axis. It is observed that the deflection is decreasing as the thickness is increasing and varying maximum at the centre and least at the supported end. Fig.7 and 8 shows the deflection ratio of thin and thick plates for clamped plate under uniformly distributed load at the centre with varying distance along X-axis. It is bserved that the deflection is decreasing as the thickness is increasing and varying maximum at the centre and least at the supported end
Fig 6: Deflection ratio of thin and thick plates for clamped plate under concentrated load at the centre with varying distance along X-axis.
0 0.2 0.4 0.6 0.8 1 1.2
0
25.4 50 76 101 127.6 152.4 177.8 198
…
223.2 248
…
D
e
fl
e
ct
ion
rat
io (W
/W
m
ax)
Distance along X-axis (mm) l/t=40
l/t=66.6
l/t=100
l/t=200
0 0.2 0.4 0.6 0.8 1 1.2
D
e
fl
e
ct
ion
rat
io (W
/W
m
ax)
Distance along X-axis (mm) l/t=10
l/t=20
0 0.2 0.4 0.6 0.8 1 1.2
0 25.4 50 76 101 127.6 152.4 177.8 198.12 223.2 248.92
D
e
fl
e
ct
ion
rat
io (W
/W
m
ax)
Distance along X-axis (mm)
l/t=40
l/t=66.6
l/t=100
l/t=200
l/t=10
a. Thin plate b. Thick plate
Fig 7: Deflection ratio of thin and thick plates for clamped plate under uniformly distributed load with varying distance along X-axis
Fig. 8: Deflection ratio of thick and thin plates for clamped plate under uniformly distributed load with varying distances along X-axis
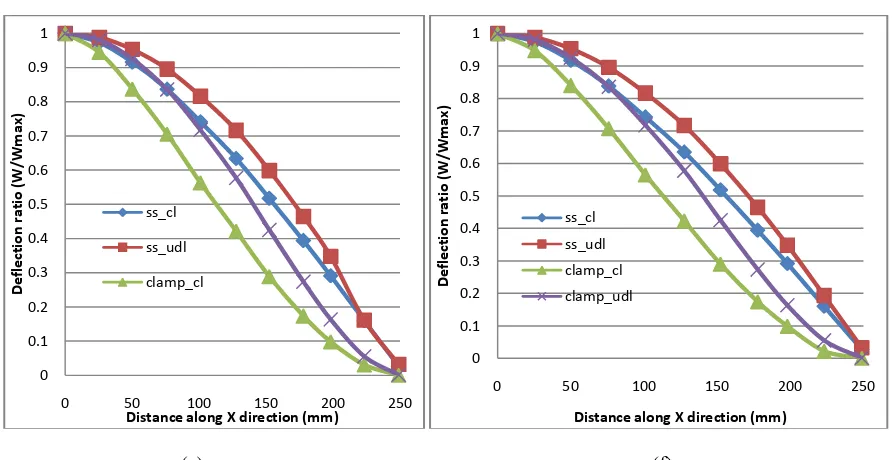
B. Comparison of distance to deflection ratio with respect to different load and boundary conditions at different l/t ratios : At different l/t ratios the deflection ratio is shown in Fig.9 to 14, from the figurers it is observed that the deflection is higher for all the l/t values at the centre. The first case i, e simply supported concentrated load(SS_CL) holds the maximum value of central displacement in Z direction. The remaining one holds in order are clamped concentrated load (clamped_CL) and simply supported uniformly distributed load (SS_UDL) and finally clamped
uniformly distributed load (Clamped_UDL).Central deflection values are maximum at l/t =200 in all the boundary and
0 0.2 0.4 0.6 0.8 1 1.2
D
e
fl
e
ct
ion
rat
io (W
/W
m
ax)
Distance along X-axis (mm) l/t=40
l/t=66.6
l/t=100 l/t=200
0 0.2 0.4 0.6 0.8 1 1.2
D
e
fl
e
ct
ion
rat
io (W
/W
m
ax)
Distance along X-axis (mm) l/t=10
l/t=20
0 0.2 0.4 0.6 0.8 1 1.2
0 25.4 50 76 101 127.6 152.4 177.8 198.12 223.2 248.92
D
e
fl
e
ct
ion
rat
io(W
/W
m
ax)
Distance along X-axis (mm) l/t=40
(a) (b)
(c) (d)
0 0.1 0.2 0.3 0.4 0.5 0.6 0.7 0.8 0.9 1
0 50 100 150 200 250
D e fl e ct ion rat io (W /W m ax)
Distance along X direction (mm) ss_cl ss_udl clamp_cl clamp_udl 0 0.1 0.2 0.3 0.4 0.5 0.6 0.7 0.8 0.9 1
0 50 100 150 200 250
D e fl e ct ion rat io(W /W m ax)
Distance along X direction (mm) ss_cl ss_udl clamp_cl clamp_udl 0 0.1 0.2 0.3 0.4 0.5 0.6 0.7 0.8 0.9 1
0 50 100 150 200 250
D e fl e ct ion rat io (W /W m ax)
Distance along X direction (mm) ss_cl ss_udl clamp_cl clamp_udl 0 0.1 0.2 0.3 0.4 0.5 0.6 0.7 0.8 0.9 1
0 50 100 150 200 250
D e fl e ct ion rat io (W /W m ax)
Distance along X direction (mm) ss_cl
ss_udl
clamp_cl
(e) (f)
Figure 9 :Variation of distance along X-axis with respect to (a) l/t=10 (b) l/t= 20 (c) l/t =40 (d) l/t=66.6 (e)l/t=100 (f)
l/t=200 at different load and boundary conditions
C. Comparison of central deflection with respect to different boundary and load conditions at different l/t ratios :
From table 1 it is observed that for all the l/t values the first case i, e simply supported concentrated load(SS_CL) holds the maximum value of central displacement in Z direction. The remaining one holds in order are clamped concentrated load (clamped_CL) and simply supported uniformly distributed load (SS_UDL) and finally clamped uniformly
distributed load (Clamped_UDL). Central deflection values are maximum at l/t =200 in all the boundary and load
conditions, central deflection values are increasing when thickness is decreasing.
Table 1: Central deflection in a square plate at different l/t ratio for different boundary and load conditions
S.No. Case Central deflection (Uz) in mm
l/t ratio
10 20 40 66.6 100 200
1 SS_CL 0.25279 1.8168 13.993 58.512 250.29 1999.5
2 SS_UDL 0.078505 0.62996 4.994 21.039 90.221 721.56
3 Clamped _CL 0.12086 0.72398 5.251 21.664 92.178 734.55
4 Clamped_UDL 0.020327 0.14731 1.373 4.7582 20.358 162.65
D. Comparison of central deflection of the plate with respect to l/t ratio in the respective boundary conditionFrom tables 2 to 5 in all the boundary condition cases the l/t=200 holds the maximum value of the central deflection. Here also it is predicted that if thickness decreases then the central deflection increases. In the case of simply supported concentrated load at l/t =200, the central deflection is maximum of all
0 0.1 0.2 0.3 0.4 0.5 0.6 0.7 0.8 0.9 1
0 50 100 150 200 250
D
e
fl
e
ct
ion
rat
io (W
/W
m
ax)
Distance along X direction (mm) ss_cl
ss_udl
clamp_cl
0 0.1 0.2 0.3 0.4 0.5 0.6 0.7 0.8 0.9 1
0 50 100 150 200 250
D
e
fl
e
ct
ion
rat
io (W
/W
m
ax)
Distance along X direction (mm) ss_cl
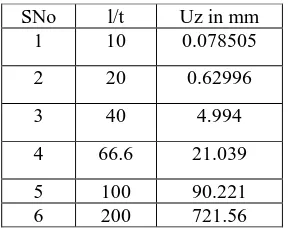
Table 2: Central deflection in a square plate subjected Table 3: Central deflection in a square plate subjected to
simply supported concentrated load to simply supported uniformly distributed load
SNo l/t Uz in mm
1 10 0.25279
2 20 1.8168
3 40 13.993
4 66.6 58.512
5 100 250.29
6 200 1999.5
Table 4: Central deflection in a square plate subjected Table 5:Central deflection in a square plate
clamped concentrated load subjected to clamped uniformly distributed load
SNo l/t Uz in mm SNo l/t Uz in mm
1 10 0.12086 1 10 0.020327
2 20 0.72398 2 20 0.14731
3 40 5.251 3 40 1.373
4 66.6 21.664 4 66.6 4.7582
5 100 92.178 5 100 20.358
6 200 261.532 6 200 162.65
V. CONCLUSIONS
For thin plates the deflection ratio (W/Wmax) is completely unaffected by the l/t ratio. As the l/t ratio i,e the thickness of the plate changes then there is no change in the deflection ratio as the curves are completely alike. The deflection ratio is only affected by the increase or decrease of the distance on the X-axis from the origin. As the distance from the X-axis increases the deflection ratio decreases. For thick plates, the deflection ratio decreases with increase in thickness. The plates which have less l/t ratio have more thickness. If the thickness is more then the deflection and deflection ratio will be more. Comparing to thin and thick, the thick plates has the maximum deflection ratio as it has less thickness. Irrespective of l/t ratio, the deflection ratio for SS_UDL holds the maximum displacement is occurring in this boundary and load conditions. The case of Clamped_CL holds the minimum deflection ratio and holds minimum displacement. The remaining two types of boundary conditions like SS_CL and Clamped_UDL are alike. At any boundary and load condition, the nodal displacement in Z directions is maximum at l/t =200 i, e the maximum thickness plate of all and l/t is the minimum one i, e the maximum thickness plate. At any l/t ratio the ILSS in XY rises from 1st to last layer as maximum to minimum. In YZ and XZ direction it follows the property of symmetry and equality in both the directions.
REFERENCES
1. Mahmood M.Shokrieh and Majid Jamal Omidi. “Tension behaviour of unidirectional glass/epoxy composites under different strain rates”
Composite Structures 88:595-601(2009)
2. Gilat A, Goldberg RK and Roberts GD. “Experimental study of strain-rate-dependent behaviour of carbon/epoxy composite” Composites Science and Technology 62:1469–1476(2002)
3. Mahmood M.Shokrieh and Majid Jamal Omidi. “Compressive response of glass–fiber reinforced polymeric composites to increasing compressive strain rates” Composite Structures 89:517-523(2009)
SNo l/t Uz in mm
1 10 0.078505
2 20 0.62996
3 40 4.994
4 66.6 21.039
5 100 90.221
4. Alcock B, Cabrera N.O , Barkoula N.M, Wang Z , Peijs T, “The effect of temperature and strain rate on the impact performance of recyclable all-polypropylene composites”, Composites Part B: 39; 537–547; (2008)
5. Haider Al-Zubaidy, Xiao-Ling Zhao and Riadh Al-Mihaidi. “Mechanical behaviour of Normal modulus Carbon Fibre Reinforced Polymer (CFRP) and Epoxy under Impact Tensile Loads” Procedia Engineering 10:2453-2458(2011).
6. Ninan L, Tsai J and Sun CT. “Use of split Hopkinson pressure bar for testing off-axis composites” International Journal of Impact Engineering
25:291–313 (2001).
7. Hosur MV, Alexander J and Vaidya UK. “High strain rate compression of carbon/epoxy laminates composites” Composite Structures; 52:405– 417(2001).
8. Yuan Qinlua, Li Yulonga, Li Hejunb, Li Shupingb and Guo Lingjunb. “Quasi-static and dynamic compressive fracture behaviour of carbon/carbon composites” Carbon 46:699-670 (2008).
9. Peijs T, Smets E.A.M, Govaert L.E. “Strain rate and Temperature effects on energy absorption of polyethylene fibers and composites”. Applied composite materials 1:35-54;(1994).
10. Zhen wang, Yuanxin Zhou, Mallick P.K. “Effects of Temperature and strain rate on the Tensile behaviour of short fiber reinforced polyamide-6”.Polymer composites: Vol.23, No.5, 858-871 ;( 2002).
11. Ferreira J.A.M, Costa J.D.M, Reis P.N.B, “Static and fatigue behaviour of glass-fibre-reinforced polypropylene composites”, Theoretical and Applied Fracture Mechanics 31; 67-74(1999).
12. P. Rama Lakshmi, Dr P.Ravinder Reddy, Investigation of interlaminar shear strength in carbon epoxy and carbon epoxy carbon nanotubes using experimental and finite element technique, International Journal of Engineering Research and Applications (IJERA), ISSN: 2248-9622 ,Vol. 2, Issue 3, May-Jun 2012, pp.001-010
13. P. Rama lakshmi and P. Ravinder Reddy, Investigation of Fracture Parameters in Carbon Epoxy and Carbon Epoxy carbon nano tubes using Experimental and Finite element technique, IJMEMS,5(I),Jan-June 2012,pp.13-18
14. P. Ravinder Reddy, P. RamaLakshmi, P. Anjani Devi, Influence of Stiffeners on Fracture Parameters in Isotropic and Orthotropic Materials, International Journal Of Scientific Research,Volume : 2 , Issue : 8 , August 2013, ISSN No 2277 – 8179,pp.157-159
15. A.Joshi Gowri Sankar, Dr. P. Ravinder Reddy, Ch.V.Sushma, Buckling Analysis of Thin Carbon/Epoxy Plate by Using FEA, International Journal of Engineering Research & Technology (IJERT), Vol. 2 Issue 9,pp.515-523., September – 2013, ISSN: 2278-0181
16. P. Ravinder Reddy, Dr P.RamaLakshmi, K. Sukanya, P. Shashikanth Reddy, Estimation of Fatigue Behaviour In Dog Bone and Three Point Specimen By Finite Element Analysis, International Journal of Advanced Mechanical Engineering, Volume 5, Number 1 (2015), pp. 1- 10, ISSN 2250-3234
BIOGRAPHY
facilitator for the learning process organized 27 STTPs/Workshops /FDP
Was a chief and principal investigator for 17 research and 27 industrial consultancy projects sponsored by AICTE, UGC, NSTL, DRDL, BHEL, RR Industries, ICOMM Tele services and ACD communications. He is a recipient of Raja Rambapu Patil National award for promising Engineering Teacher by ISTE for the year 2000 in recognition of his outstanding contribution in the area of Engineering and Technology, Excellence “A” Grade awarded by AICTE monitoring committee (2003) for the MODROB project sponsored by AICTE, “Engineer of the year Award-2004” for his outstanding contribution in Academics and research by the Govt. of Andhra Pradesh and Institution of Engineers (India), AP State Centre on 15th September 2004 on the occasion of 37th Engineer‟s Day, Best Technical Paper Award in the year Dec. 2008 in Industrial Application titled “Online quality monitoring welding &weld upset in resistance projection welding process”, in Journal of Non-Destructive Testing &Evaluation, the official journal of ISNT during the year 2007 by National Governing Council of Indian Society for Non Destructive Testing.
Dr. P. Ravinder Reddy was born on August 12th 1965, graduated in B.Tech in
Mechanical Engineering from Kakatiya University (1987) Warangal, M.E Engineering Design from PSG college of Technology, Coimbatore (1991) and Ph.D from Osmania University in 2001. He has 27 years of Teaching, Industrial and Research experience. He published over 215 technical and research papers in various international and national journals and conferences. He has guided 15 Ph.D
scholars and 600 M.E/M. Tech projects. As a facilitator for the learning process
organized 27 STTPs/Workshops /FDPs /SDPs, 2 international conferences
beneficial to Faculty, Researchers and Industry and delivered 105 keynote and
invited talks.
Dr.P. Ramalakshmi was born on 28th July 1979. She did her B.E Mechanical
Engineering from DCET and M.S from Canada and Ph.D from JNTU Hyderabad. She published papers in International Journal-04, International Conferences-02 and National Journal-01.