PDF-to-Text Reanalysis for Linguistic Data Mining
Michael Wayne Goodman, Ryan Georgi, Fei XiaLinguistics Department University of Washington
[email protected], [email protected], [email protected]
Abstract
Extracting semi-structured text from scientific writing in PDF files is a difficult task that researchers have faced for decades. In the 1990s, this task was largely a computer vision and OCR problem, as PDF files were often the result of scanning printed documents. Today, PDFs have standardized digital typesetting without the need for OCR, but extraction of semi-structured text from these documents remains a nontrivial task. In this paper, we present a system for the reanalysis of glyph-level PDF-extracted text that performs block detection, respacing, and tabular data analysis for the purposes of linguistic data mining. We further present our reanalyzed output format, which attempts to eliminate the extreme verbosity of XML output while leaving important positional information available for downstream processes.
Keywords:Low Resource Languages, Interlinear
Glossed Text (IGT), Corpus Creation
1. Introduction
[image:1.595.305.550.295.392.2]A great deal of linguistic information exists online in the form of academic publications. ODIN, the Online Database of INterlinear text (Lewis and Xia, 2010) was created upon this premise, a resource which makes available language data for approxi-mately 1,500 languages, including linguistic glosses and resource-rich language translations (Lewis et al., 2015). The data targeted by ODIN is Interlinear Glossed Text, or IGT, a semi-structured data format for presentation of linguistic examples, as shown in Figure 1. This data has been shown to have interest-ing characteristics, makinterest-ing some NLP analysis possi-ble for resource-poor languages (Lewis and Xia, 2008; Georgi et al., 2014; Georgi et al., 2015).
Figure 1: An IGT instance of Kurmanji (kmr) in situ from (van de Visser, 2006).
All the IGT instances in ODIN, including the one in Figure 1, were extracted from linguistic articles that were distributed electronically as Portable Docu-ment Format (PDF) docuDocu-ments, a format developed by
Initial Page First Cut Second Cut Third Cut
Figure 2: An illustration of the XY-Cut algorithm re-cursing on a document. The regions created by the current cut (if any) are represented by a dotted border, while regions not under consideration at the current recursion are shaded.
Adobe Systems for the purposes of standardizing doc-ument display and typesetting across platforms. As this format was primarily designed to “communicate visual material between different computer applica-tions and systems” (Warnock, 1991), re-extracting the displayed text for automated systems was not an in-tended aspect of the format design. In the PDF spec-ification, text is represented as glyphs of a specified font in a “Character Space” coordinate system, em-bedded within a “Text Space” renderer (Bienz et al., 1997). One of the downsides of this document struc-ture is that the internal strucstruc-ture of a PDF file gives text as glyph-coordinate pairs, and guarantees only the positioning of text rendered on the page. It does not guarantee that the order of the encoded text resembles the order in which it is intended to be read.
[image:1.595.53.286.589.694.2]We present in this paper a system that consumes the extracted text-coordinate information from an off-the-shelf PDF-to-text converter, but reanalyzes this out-put to perform block detection, respacing, and tabu-lar data analysis. The output format of this system is more human-readable than the verbose xml format produced by the off-the-shelf converters, while mak-ing the important positional information available to downstream processes.
2. Previous Work
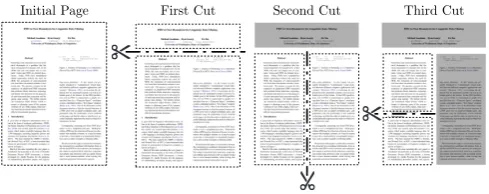
In the 1980s and 1990s, as access to electronic resources increased, researchers began investigating ways to convert previously printed content into elec-tronic content that could be indexed and searched more easily. A part of the OCR task of transforming pixels into electronic characters was detecting what portions of the page were contiguous blocks. (Nagy and Seth, 1984) introduced the recursive XY-Cut al-gorithm, with (Nagy et al., 1992) refining the tech-nique for the specific domain of technical articles. For an informative comparison of different algorithms for layout analysis, please see (Shafait et al., 2006).
2.1. The XY-cut algorithm
The XY-cut algorithm works by searching for the largest rectangle of whitespace (or “valley”) that runs the length of the current region of the page either ver-tically or horizontally. This region is then “cut” into two smaller regions, and the algorithm recurses until no more cuts can be found. Rather than cutting only on valleys of complete whitespace, a whitespace thresh-old can give some tolerance to noise within a valley. Another threshold on the minimum region size to cut can prevent the algorithm from cutting too far. Fig-ure 2 provides an illustration of the first several cuts that the algorithm might make on a sample document.
2.2. Existing PDF-to-text converters
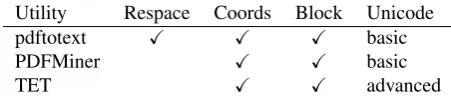
There are several existing PDF-to-text converters, which extract text from PDFs and produce output files with glyph-position information in easily parsable XML formats, such as the open-source PDFMiner (Shinyama, 2016) and the commercial product from PDFLib called Text and Image Extraction Toolkit (TET) (PDFLib GmbH, 2015). The XML output is extremely verbose; for instance, the original PDF doc-ument containing Figure 1 is 3MB in size, but the converted XML output of TET, TETML1 is 58MB uncompressed, 5.5MB with gzip compression. Fig-ure 3 gives an example of the representation of
1https://www.pdflib.com/tet-cookbook/
tetml-and-xslt/tetml/
the PROG-wash-PST-2SGtoken from Figure 1 in TETML format.
[image:2.595.308.534.281.331.2]A third converter we have tested is the pdftotext util-ity of the Poppler PDF library2. A nice property of pdftotext is that it can output text with whitespace to approximate the layout of the page (aka respacing). However, the respaced text was often corrupted, with lines of text being split, or with columns becoming misaligned.
Table 1 compares the three converters with respect to features that we find useful when extracting text from scientific documents. All produce markup (XML or HTML) and plain-text formats, where the markup formats contain the coordinates of glyphs and fine-grained blocks (i.e., at word or line-level).
Utility Respace Coords Block Unicode pdftotext X X X basic
PDFMiner X X basic
TET X X advanced
Table 1: Features of three existing PDF-to-text con-verters
3. Extraction and Reanalysis
When designing our PDF-to-text system (called Freki3), we elected not to reimplement PDF-to-text extraction but instead built on top of off-the-shelf con-verters that produce the XML format. From the ver-bose XML format, Freki identifies larger blocks (e.g., a paragraph or an IGT) and performs respacing. It also makes modifications to the XY-cut algorithm.
3.1. Block Detection
The core of our layout analysis is in block detection, which is a two-stage algorithm. In the first stage, we create a 2D array where non-zero values represent the bounding boxes of text tokens in the PDF, then ana-lyze this array for blocks. We aim to create a block for every distinct region of a document, e.g., each para-graph, section header, footnote, figure, etc. The re-cursive part of the algorithm is similar to the stan-dard XY-cut implementation, but we use three types of thresholds: (1) maximum valley noise; (2) mini-mum valley width; and (3) minimini-mum non-valley size. Furthermore, all three types of thresholds are defined for both the x and y axes, resulting in six threshold values.
For our task, we set the first threshold to 0 for both axes, as there is little noise to account for in text ex-tracted from generated PDFs. We explore two ways
2
https://poppler.freedesktop.org/
3“Freki” is one the wolves that accompanies the Norse
<Text>PROG-wash</Text>
<Box llx="238.92" lly="587.60" urx="289.09" ury="597.56">
<Glyphfont="F47" size="8.04" x="238.92"y="587.60" width="5.36"fill="C0">P</Glyph> <Glyphfont="F47" size="8.04" x="244.32"y="587.60" width="5.80"fill="C0">R</Glyph> <Glyphfont="F47" size="8.04" x="250.08"y="587.60" width="6.25"fill="C0">O</Glyph> <Glyphfont="F47" size="8.04" x="256.32"y="587.60" width="6.25"fill="C0">G</Glyph> <Glyphfont="F47" size="9.96" x="262.56"y="587.60" width="3.31"fill="C0">-</Glyph> <Glyphfont="F47" size="9.96" x="265.92"y="587.60" width="7.19"fill="C0">w</Glyph> ...
</Box>
Figure 3: The TETML output produced by TET for a portion of the tokenPROG-wash-PST-2SGin Fig 1.
(24) Kurmanji: passive construction (present) a. ez te di--m
1SG 2SG.ACC PROG-wash.PRS-1SG I am washing you.
b. tu t-ł(-y) t-in
2SG PROG-come-2SG wash-INF You are being washed (by me).
Figure 4: The TET platext output for the IGT in-stance in Figure 1.
of choosing the second type of threshold: the first simply uses the average character height in the page for both the x and y axes; the second method ana-lyzes a histogram of valley sizes to select one greater than the median size, which is intended to cut section boundaries but not individual lines. Our experiments show that the first method worked better in general, although the second does better for documents with double-spaced lines. The third type of threshold pre-vents a cut from resulting in too small a block. We limited vertical cuts so the resulting blocks must be at least 1/6 of the original page width and 1/32 of the original page height, and horizontal cuts so the result-ing blocks must be at least 1/6 of the original page width and 1/128 of the original page height.
The second stage of block-detection is line detection. Each block is reanalyzed individually with no mini-mum valley width for horizontal cuts, which allows each line to be cut. Some PDFs have lines whose bounding boxes are completely abutted, resulting in zero valleys between them. In response, when Freki constructs the 2D array of bounding boxes, it shrinks the boxes vertically by removing 1/5 of its height from the top and bottom.
3.2. Other changes to the XY-cut algorithm
XY-cut, and layout analysis algorithms in general, are often described for analyzing scanned documents. In contrast, we are analyzing the layout of PDFs gener-ated by a typesetting system or word processor, and we ignore non-text elements, so we are not affected by the noise and scanning artifacts that can hinder layout analysis algorithms. Instead, we transform the bound-ing boxes of encoded glyphs into a 2D array for image analysis. This approach shares some similarities with (Ha et al., 1995), although that work computed
bound-ing boxes for characters from scanned documents, not from PDFs.
XY-cut is a recursive algorithm, so a na¨ıve traversal of the tree of cuts can give an order through the blocks that may correspond well with the intended reading order4, but block ordering has also been a separate object of research (Meunier, 2005; Sutheebanjard and Premchaiswadi, 2010). We only use the implicit order from the tree traversal, but we record the path to each block, as well as source block coordinates, so that later analysis on block order can be performed. There are also known complex layouts that are not handled by the XY-cut algorithm, but as our focus is on academic articles that do not commonly use such layouts, we choose to ignore these cases for now.
Other work in layout analysis focused on accurately detecting and extracting tabular data (Perez-Arriaga et al., 2016; Oro and Ruffolo, 2009). We also aim to re-cover data presented tabularly, but rather than being able to accurately predict rows and cells for a table, we aim to maintain visual alignment in tabularly ar-ranged text when converted to a monospaced font, as explained below.
3.3. Respacing and Tabular Data Analysis
Our use case is primarily to enable the automatic pro-cessing of text extracted from PDFs, with emphasis on text presented tabularly, such as IGT. Therefore, it is important to maintain the visual alignment of text elements when projecting coordinate-positioned text in a variable-width font to columns in a monospaced plain-text file. If we projected a token’s x coordi-nate to a column by multiplying the coordicoordi-nate by, e.g., the average character width, words with many narrow characters would occupy proportionally more projected space than words with many wide charac-ters. The effect of this mismatch is that some words would get overwritten by the following words. We could instead multiply the coordinate by the widest character width, or something larger, to prevent the overlap, but this would amplify misalignments across
4E.g., for languages that write from left-to-right and
doc_id=3667 page=226 block_id=226-6 bbox=... label=tbbtt 6836 6842
line=6836 fonts=F47-10.0,F48-10.0 bbox=... : (24) Kurmanji: passive construction (present)
line=6837 fonts=F47-10.0,F49-10.0 tabscore=0.25 bbox=...: a. ez te di-s¸ˆu-m
line=6838 fonts=F47-10.0,F47-8.0 tabscore=1.00 bbox=... : 1SG 2SG.ACC PROG-wash.PRS-1SG
line=6839 fonts=F47-10.0 bbox=... : ‘I am washing you.’
Figure 5: The Freki output (see Section 4.) for the first IGT instance from Figure 1. The bounding box (bbox) information has been truncated to save space.
lines when the original tokens did not have exactly the same x coordinate.5 We could project to a column, then adjust it to the next available column in cases of overlap, but then tables quickly become misaligned. Instead, we compute the intended column position and compare it to other lines within a block. The propor-tion of tokens sharing a projected column6is a metric we calltab-score. Successive lines meeting a thresh-old for tab-score (which we set to 60%) are marked as belonging to a tabular group. We then apply the project-and-adjust strategy described above, but all to-kens within a tabular group sharing a projected col-umn are adjusted to the next available colcol-umn across all lines in the group. It’s possible for non-tabular (i.e., prose) lines to surpass the tab-score threshold, but be-cause we are not explicitly marking the groups as ta-bles and merely adjusting the spacing, the only conse-quence is extra whitespace between words.
4. Output Format
While XML files produced by TET and PDFMiner of-fer a great deal of information, as shown in Fig 3, they are both verbose and far less human readable. While disk space may be cheap, reviewability of the output by a human domain expert is necessary to ensure that the resulting content is sensible and useful for con-sumption by downstream processes.
Compromising between exposing the rich positional information provided by these XML output formats and maintaining human readability, our output format preserves block information and the lines that com-prise them, with both block-level and line-level meta-data before the text content. Figure 5 shows an exam-ple block from the document in which Figure 1 was extracted. The Freki output is more informative than the plain-text output of TET in Fig 4 and more human readable than the XMT output of TET in Fig 3. The information contained in the block and line preambles is explained below.
5We’ve observed a number of documents with ad-hoc
tables created, presumably, by the author inserting spaces until the content is visually in the intended spot, but the coordinates will not be exactly the same across rows.
6Sometimes things like example numbers inflate the
number of unaligned tokens, so we begin counting from the rightmost first token between the two lines.
4.1. Block-Level Information
The first line of the block contains primarily identi-fying and positional information, including doc_id
(Source document identifier), page (Page number),
block_id(Unique block identifier),bbox (Bound-ing box of entire block), and label (XY-Cut tree path to this block). While the source document and block identifier information is largely for reference, the bounding box, XY-Cut path, and page number are all interesting positional features for downstream pro-cessing tasks.
4.2. Line-Level Information
Freki breaks each block into lines of text, which serve as the atomic unit of the output format. Each line is provided with a preamble that containsline
(line number), fonts (list of font-size pairs found in the line), bbox (bounding box for the line), and
tabscore(tab-score, see Section 3.3.).
While the line number is not much more than an identifier, the other data exposed are valuable fea-tures for the downstream task of identifying the semi-structured, semi-tabular data. For instance, from the bounding box information, one might create a feature for whether a line is offset significantly from the sur-rounding text, as is common with examples such as the one in Figure 1. The tab-score described in Sec-tion 3.3. may help in identifying the word-by-word alignment shown in the first two lines of each exam-ple of the IGT instances in Figure 1, as they line up neatly in columns. Finally, the line content following the preamble is additionally respaced to be natural for human readability.
5. Conclusion
6. Bibliographical References
Bienz, T., Cohn, R., and Meehan, J. R., (1997). Portable Document Format Reference Manual, Au-gust. http://www.adobe.com/content/ dam/Adobe/en/devnet/acrobat/pdfs/ pdf_reference_1-7.pdf.
Georgi, R., Lewis, W. D., and Xia, F. (2014). Captur-ing divergence in dependency trees to improve syn-tactic projection. Language Resources and Eval-uation, 48(4):709–739, October. http://doi. org/10.1007/s10579-014-9273-4.
Georgi, R., Xia, F., and Lewis, W. D. (2015). En-riching interlinear text using automatically con-structed annotators. In Proceedings of the 9th SIGHUM Workshop on Language Technology for Cultural Heritage, Social Sciences, and Humani-ties (LaTeCH-2015), in conjunction with ACL 2015, Beijing, China, July. http://www.aclweb. org/anthology/W15-3709.
Ha, J., Haralick, R. M., and Phillips, I. T. (1995). Re-cursive xy cut using bounding boxes of connected components. In Document Analysis and Recogni-tion, 1995., Proceedings of the Third International Conference on, volume 2, pages 952–955. IEEE. Lewis, W. D. and Xia, F. (2008). Automatically
identifying computationally relevant typo-logical features. In Proceedings of the Third International Joint Conference on Natural Lan-guage Processing, Hyderabad, India, January.
http://www.aclweb.org/anthology/I/ I08/I08-2093.pdf.
Lewis, W. D. and Xia, F. (2010). Developing ODIN: A multilingual repository of annotated language data for hundreds of the world’s languages. Liter-ary and Linguistic Computing, 25(3):303–319. Lewis, W. D., Xia, F., Georgi, R., and
Good-man, M. (2015). ODIN corpus download.
xigt.org/odin.
Meunier, J.-L. (2005). Optimized XY-cut for de-termining a page reading order. In Eighth Inter-national Conference on Document Analysis and Recognition (ICDAR’05), pages 347–351 Vol. 1. IEEE, September.
Nagy, G. and Seth, S. (1984). Hierarchical represen-tation of optically scanned documents. In Proceed-ings of the 7th International Conference on Pattern Recognition (ICPR), pages 347–349, January. Nagy, G., Seth, S., and Viswanathan, M. (1992).
A Prototype Document Image Analysis System for Technical Journals . Computer, 25(7):10–22, July. Oro, E. and Ruffolo, M. (2009). PDF-TREX: An
ap-proach for recognizing and extracting tables from PDF documents. InICDAR.
PDFLib GmbH. (2015). PDFLib TET
5 – text and image extraction toolkit.
pdflib.com/products/tet/.
Perez-Arriaga, M. O., Estrada, T., and Abad-Mota, S. (2016). TAO: System for table detection and extrac-tion from PDF documents. InFLAIRS Conference. Shafait, F., Keysers, D., and Breuel, T. M. (2006).
Performance comparison of six algorithms for page segmentation. InDocument Analysis Systems. Shinyama, Y. (2016). pdfminer, December.
github.com/euske/pdfminer.
Sutheebanjard, P. and Premchaiswadi, W. (2010). A modified recursive X-Y cut algorithm for solving block ordering problems. 2010 2nd International Conference on Computer Engineering and Technol-ogy, pages V3–307 – V3–311, May.
van de Visser, M. (2006). The Marked Status of Erga-tivity. Landelijke Onderzoekschool Taalweten-schap. http://www.lotpublications. nl/Documents/141_fulltext.pdf. Warnock, J. (1991). The Camelot Project .