Exploiting Category-Specific Information
for Multi-Document Summarization
Jun
−
Ping N g
1P raveen B ysani
1Ziheng Lin
2M in
−
Yen Kan
1Chew
−
Lim Tan
1(1) National University of Singapore, 13 Computing Drive, Singapore 117417 (2) SAP Research, SAP Asia Pte Ltd, 30 Pasir Panjang Road, Singapore 117440
{junping,bpraveen,kanmy,tancl}@comp.nus.edu.sg,[email protected]
A
BSTRACTWe show that by making use of information common to document sets belonging to a common category, we can improve the quality of automatically extracted content in multi-document summaries. This simple property is widely applicable in multi-document summarization tasks, and can be encapsulated by the concept ofcategory-specific importance (CSI). Our experiments show that CSI is a valuable metric to aid sentence selection in extractive summarization tasks. We operationalize the computationCSIof sentences through the introduction of two new features that can be computed without needing any external knowledge. We also generalize this approach, showing that when manually-curated document-to-category mappings are un-available, performing automatic categorization of document sets also improves summarization performance. We have incorporated these features into a simple, freely available, open-source extractive summarization system, called SWING. In the recent TAC-2011 guided summariza-tion task, SWING outperformed all other participant summarizasummariza-tion systems as measured by automated ROUGE measures.
1 Introduction
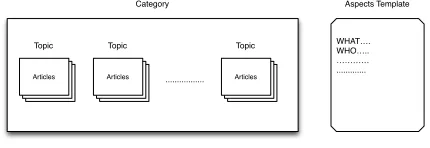
Studies have been done on many facets of text summarization including multi-document summarization (Radev et al., 2004), query focused summarization (Daumé III and Marcu, 2006), personalized summarization (Díaz and Gervás, 2007), temporal summarization (Bysani et al., 2009), and more recently guided summarization (Owczarzak and Dang, 2010, 2011). In multi-document summarization, atopicconsists of a set of related documents. The goal is to generate a coherent summary from this set of documents with minimal information redundancy. In the guided summarization tasks defined by the recent Text Analysis Conference’s (TAC) shared tasks, each topic is additionally assigned to one of several broadcategoriessuch asAccidents and Natural DisastersorAttacks(see Figure 1). In traditional query-focused summarization, a narrative specific to each topic serves as a hint to the content required in the target summary. However in guided summarization, the narrative is replaced with a series of category-specific templates which contain information elements, oraspects. For example,WHENis an aspect that is shared by both theAccidents and Natural DisastersandAttackscategories. Note that aspects are not specific to a topic; rather, they are associated with the category to which the topic belongs. A summary for a topic should cater to all the aspects of its associated template. Such guided summarization can be usefully applied to product opinion summarization, personalization of summaries for users, and improving user experience in question answering scenarios.
Articles Topic
Articles Topic
[image:2.420.96.311.265.339.2]Articles Topic
... Category
WHAT…. WHO….. ………… ...
Aspects Template
Figure 1: How articles, topics, categories and aspects come together.
Recently, Haghighi and Vanderwende (2009) proposed several content models for summa-rization. Their models find aspects within a topic which are subsequently combined using KL-divergence as a criterion for selecting relevant sentences. Conroy et al. (2010) augmented theirCLASSYsystem with a query generation component that expands query terms for each
aspect of the associated category by performing searches over Google, dictionaries, thesauri and authored world knowledge. Steinberger et al. (2010) generated guided summaries by framing the problem as an information extraction task. Aspect information extracted from an entity extractor is coupled with latent semantic analysis to capture relevant information. They also built lexicons for some category aspects that are not identified by the event extractor. External knowledge such as Wikipedia is also used by many groups for this task. In (Varma et al., 2010), a large set of relevant articles were manually selected from Wikipedia for each category. These articles were used to build domain models, and later to extract important sentences containing events mentioned in the template.
encode a useful signal that can improve the quality of guided summaries. To this effect, we propose and develop a robust sentence-extractive summarizer adopting the standard, supervised machine learning framework: we extract features from the input documents, utilize the features to rank the importance of input sentences through a regression model, and finally apply the model on new, unseen test documents.
The fundamental innovation that our summarizer makes over the previous state-of-the-art is that it makes use of the information derived from the category of a topic to calculate the category-specific importance (CSI) of each sentence. We capture CSI through two novel features –category relevance scoreandcategory Kullback-Liebler divergence score– that are explained in
later sections of the paper.
Our approach is different from (Conroy et al., 2010; Steinberger et al., 2010) which compiled lexicons manually for each category aspect. Words in these pre-compiled lexicons are treated with equal importance for a category, whereas our method automatically discerns between the different saliency of words across a category. This allows us to address the problem of low recall that hampers the performance of manually-compiled lexicons.
Aker and Gaizauskas (2009) had also made use of the concept of category-specific information for automatic captioning of images. Similar to our proposed approach, they exploited the inherent differences across different object types to influence content selection. Our work is different in two key aspects: 1) our computed statistics are based on actual content to be summarized, instead of a pre-assembled corpus, and 2) besides considering information across categories, we also make use of information across topics, within a category.
When compared with the state-of-the-art summarizers submitted to TAC-2011, our system significantly outperforms all other systems as reported in (Ng et al., 2011).
2 Corpus
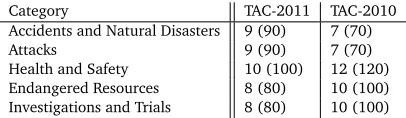
The categorization of topics in the guided summarization task at TAC makes the shared task datasets suitable corpora for our work. We use the dataset provided in TAC-2010 for training our system and the TAC-2011 dataset for testing purposes. The documents in TAC-2010 are extracted from AQUAINT and AQUAINT-2; documents used in TAC-2011 came from the newswire portion of the TAC-2010 KBP source data. The test dataset consisted of 44 topics, divided into five categories. The structure of the training data is similar, containing 46 topics. We use only the articles from Set A for our experiments as the task of summarizing Set B, was an update summarization task, a separate task by itself. The distribution of topics into categories for TAC-2010 and TAC-2011 is provided in Table 1. In the rest of this paper, we abbreviate some of the category names for brevity. For example instead ofAccidents and Natural Disasters, we will useAccidents.
Category TAC-2011 TAC-2010
Accidents and Natural Disasters 9 (90) 7 (70)
Attacks 9 (90) 7 (70)
Health and Safety 10 (100) 12 (120)
Endangered Resources 8 (80) 10 (100)
[image:3.420.115.318.448.507.2]Investigations and Trials 8 (80) 10 (100)
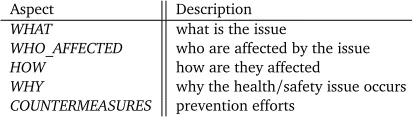
The TAC-2011 guided summarization task was to write a 100-word summary for a given topic covering all the aspects. A template of aspects for the categoryHealth and Safetyis shown in Table 2 as an example.
Aspect Description
WHAT what is the issue
WHO_AFFECTED who are affected by the issue
HOW how are they affected
WHY why the health/safety issue occurs
COUNTERMEASURES prevention efforts
Table 2: Template of aspects for theHealth and Safetycategory.
Four human-written model summaries are provided per topic for each set. These summaries are used as a gold standard for evaluating machine generated summaries. Both automatic and man-ual measures were utilized by the TAC organizers to evaluate summaries. Automatic evaluation is commonly performed using ROUGE (Lin, 2004), and was used in TAC. ROUGE determines the quality of a summary through overlapping units such as n-grams, word sequences, and word pairs with human written summaries. Manual measures adopted by TAC organizers included pyramid scoring (Nenkova et al., 2007) and subjective assessments about the quality of the summaries. Since the original TAC manual evaluation team is not known or available, manual evaluation of new summarization systems is not possible. As such, we need a fair, objective comparison of our results with previously published results, and can only adopt automated methods. For this reason, we adopt the automatic ROUGE-2 and ROUGE-SU4 measures. While not ideal, these measures have been found to generally correlate well with manual judgments (Lin and Hovy, 2003).
3 Methodology
Our system,SWING, is a sentence-extractive summarizer that is designed to be an easy-to-use
and an effective testbed for comparative evaluation of summarization methods. Input data is pre-processed using standard techniques, incorporating stop word removal and stemming for better computation of relevance. Our summarization system is fundamentally based on a supervised learning framework. A set of features is derived for each sentence in the input documents to measure their importance. We compute two classes of features, at the topic and category levels. We first discuss a set ofgenericfeatures used inSWING. The feature scores are
combined together with a set of weights derived from support vector regression (SVR) (Gunn, 1998). Finally, the Maximal Marginal Relevance (MMR) algorithm (Carbonell and Goldstein, 1998) is used to perform sentence re-ranking and selection. Later in Section 4, we introduce features to compute our key innovation: the category-specific importance (CSI) of sentences.
SWINGcombines both generic features and CSI features to produce guided summaries.
3.1 Generic Features
Each sentence is represented by a vector of feature scores for learning. We used three features: (1) sentence position, (2) sentence length, and (3) a modified version of document frequency to calculate the generic topic relevance of a sentence.
important, summary-worthy information. Accordingly, the score of this feature is gradually decreased from the first sentence to the last sentence in a document based on its position.
Sentence lengthis a binary feature that helps in avoiding noisy short text in the summary. The value of this feature is 1 if the length of sentence is at least 10, and zero otherwise. The value 10 is empirically determined in our system tuning.
Interpolated N-gram Document Frequency (INDF) is an extended formulation of the popu-lar document frequency (DF) measure. The efficacy of DF in summarization has been previously demonstrated by (Schilder and Kondadadi, 2008; Bysani et al., 2009). It computes the im-portance of a token as the ratio of the number of documents in which it occurred to the total number of documents within a topic. We extend the use of DF from unigrams to bigrams. INDF is the weighted linear combination of the DF for unigrams and bigrams of a sentence. Since bigrams encompass richer information and unigrams avoid problems with data sparseness, we choose a combination of both. The INDF of a sentences, is computed as:
IN DF(s) =α( P
wu∈sDF(wu)) + (1−α)( P
wb∈sDF(wb))
|s|
wherewuare the unigram andwbare the bigram tokens in sentences.αis the weighting factor
that is set to 0.3, after tuning on the development set.
3.2 Training and SVR
Each sentence is scored with the three features explained above. The features are given weights by a support vector regression model, following the methodology described in (Bysani et al., 2009). We train the regression model using the ROUGE-2 similarity of the sentences with human models as the objective to maximize. Data from TAC-2010 is used as the training corpus, and the trained regression model is used to predict the saliency scores of each sentence in the TAC-2011 test set.
3.3 Sentence Re-ranking
After each sentence has been scored, the maximal marginal relevance (MMR) (Carbonell and Goldstein, 1998) algorithm is used to re-rank and extract the best sentences to generate a 100-word summary. In our implementation, the MMR of a sentencesis computed as:
M MR(s) =Score(s)−R2(s,S)
whereScore(s)is the score predicted by the regression model,Sis the set of sentences already
selected to be in the summary from previous iterations, andR2 is the predicted ROUGE-2 score of the sentence under consideration (s) with respect to the selected sentences (S).
3.4 Post-Processing
There are many extraneous text fragments in the corpus that are uninformative. These include news agency headers and the reporting date of the articles, among others. These are removed automatically during processing from the summaries with the use of a modular post-processing system that matches regular expressions.
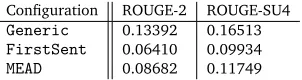
Table 3 provides the evaluation results of a baseline summarizer,Generic, when using only
baseline systems commonly used in TAC for comparison.FirstSentreturns the top sentences
from the most recent article until the summary length (100 words) is reached, andMEADis the
output ofMEAD, a popular open-source summarizer1.
Configuration ROUGE-2 ROUGE-SU4
Generic 0.13392 0.16513 FirstSent 0.06410 0.09934
[image:6.420.128.279.109.149.2]MEAD 0.08682 0.11749
Table 3: ROUGE scores for baseline summarizer with generic features and common TAC baselines.
The ROUGE scores indicate that putting these generic features together surpassed the baseline systems by a huge margin, and is a competitive configuration used to compare with in the remaining parts of this paper.
4 Category Specific Information
In the guided summarization task, summaries are generated for each topic, where each topic belongs to one or more categories. The purpose for providing this manually-given classification is so that the summaries can focus on the content related to the aspects associated with the category. We want to leverage this knowledge of the category of a topic to improve generated summaries.
In this extractive summarization scenario, we formulate the summarization task as supervised regression, where the system learns to score the saliency of sentences. The idea behind CSI is to exploit information which is specific to a particular category, and use this as a guide to the saliency of sentences from the source documents. One such possible category-specific information could be how words are used within the category’s topics. For a category such asAccidents, we may expect to see words like “died”, “collision” in the associated source documents more commonly than we would in a general piece of English text. For multi-document summarization, we hypothesize that the word frequency statistics will be similar for document sets within the same category and will be different than those across document sets from different categories. For example, a set of news articles on “Borneo Ferry Sinking” may share similar word statistics with another set of news articles reporting “Minnesota Bridge Collapse” as these two sets belong to the category ofAccidents. However, the word statistics will have a different distribution when compared to a set of news articles on “Pet Food Recall” (Health) as they are from different categories.
To find out if there is indeed a difference in word frequencies across each of the categories, we independently performed an analysis of the word usage in each category. To quantify this difference, we applied the log-likelihood ratio test (LLR) (Dunning, 1993). The LLR of a word
wacross two categoriesc1andc2is defined as:
L LR(w) =2× X
i∈c1,c2
ai× log
a
i×F bi×f(w)
whereaiis the frequency of wordwandbiis the total frequency of all words in categoryci. Fis the total frequency of all words, andf(w)is the frequency ofwacross all categories. A
word with a high LLR value implies that it co-occurs in both categories surprisingly often, or surprisingly rarely.
We obtained a list of words with high LLR value (99th percentile; 0.1% level; value=6.63) for each category with respect to all other categories. For illustration, the top ten words for each of the five categories are shown in Table 4.
Category Words
Accidents bridge, bangladesh, crane, weather, spill, cyclone,
survivor, earthquake, oil, crash
Attacks attack, school, police, gunman, terrorist, shoot,
condemn, fbi, molest, nuclear
Health food, safety, children, recall, sleep, cancer, organ,
heart, blood, risk
Endangered Resources water, turtle, coral, ivory, global, conserve, warm, decline, poach, tuna
[image:7.420.83.347.134.241.2]Investigations charge, trial, guilty, investor, testify, plead, robbery, taylor, former, conspiracy
Table 4: Top ten words listed in decreasing order of LLR values in each of the TAC categories. The table shows that almost all of the words are semantically related to their corresponding categories. For example, the first word for the categoryAttacksis actually “attack”, while that for the categoryEndangered Resourcesis “water”. We expect that a good summary will contain a fair amount of these category-specific words. To validate this, we examine the densities of these words in both the model summaries and all of the document sets that belong to a category. Here, density is computed as the ratio of the sum of the term frequencies of all the words found in the list to the total term frequency of the category. If a word is used more frequently in a model summary compared to a more general document set, we would expect a higher density value for the model summary.
Accidents Attacks Health Endangered
Resources Investigations 0.05
0.10 0.15 0.20 0.25
TAC Categories
Density
Model Documents
Figure 2: Comparison of density of category-specific words across model summaries and document sets.
[image:7.420.99.336.356.465.2]contain more category-specific words, and thus gives solid evidence for our intuition that the difference in word usage across each category is a useful guide in generating a good summary.
4.1 Category-Specific Features
Having determined the efficacy of category-specific word usage, we design two features, category relevance score (CRS), and category KL-divergence score (CKLD), to model and exploit this property.
Category Relevance Score (CRS)computes the importance of a word with respect to a category, using the frequency statistics of the word in constituent topics and topic documents of the category. As every topic in the category is related, the topic frequency of a word is directly proportional to its categorical relevance. Similarly, the larger the number of documents a word appears in within the category, the more relevant it is to the category. CRS is the linear interpolation of frequency scores at topic (TLF) and document level (DLF). The score of a sentencesin categoryc, is calculated as:
CRSc(s) = P
w∈s(β×T LFc(w) + (1−β)×DLFc(w)) |s|
whereT LFc(w)andDLFc(w)are computed as:
T LFc(w) =|{t:w∈t, ∀t∈c}|
|Tc|
DLFc(w) =|{d:w∈|dD, ∀d∈c}| c|
wheretanddrepresent topic and document, respectively, andTcandDcare the sets of topics
and documents in categoryc, respectively. The value ofβwas determined empirically, optimally set to 0.7. This setting highlights that topic-level influence is more important that of the document level.
Category KL-Divergence Score (CKLD)is a differential measure that calculates the importance of a word using KL Divergence. Also known as information divergence, it quantifies the information gain between two probability distributions. Category KLD (CKLD) measures the divergence of probability distribution of a word in the current category (c) to its distribution in the whole corpus (C). The greater the divergence fromC, the more informative the word is for categoryc. The CKLD value of a sentencesin categorycis given as:
CK LDc(s) =X w∈s
pc(w)×logpc(w) pC(w)
wherepc(w)is the probability of wordwin categorycandpC(w)is the probability of wordw
in the corpus.
Consider two words such as “report” and “Madoff” for the category ofInvestigations. The word “report” ranks top for CRS in this category and appears in three categories, while “Madoff” ranks top for CKLD and only appears inInvestigations. CKLD will be able to detect if these two words are used differently from how they are used in the other categories, which explains the fact that most words in the list appear only in one category. In this example, the word “Madoff” is a person name which is likely important only in some topics inInvestigationsbut not in other categories. On the other hand while “report” is important to theInvestigationscategory (it appears in seven out of eight topics in this category), it is also found important in two other categories (AccidentsandAttacks). We hypothesize that these intra- and inter-category aspects of CRS and CKLD will be complementary to each other, which we will validate in the experiment section.
Category CRS CKLD
Accidents official, people, report, news, accident crane, bridge, construction, java, people
Attacks attack, report, killed, state, police attack, pirate, police, school, israel
Health product, research, company, increase, food, toy, sleep, vitamin, product
time
Resources conserve, world, protect, manage, coral, water, tuna, elephant, turtle
country
Investigations report, charge, people, killed, family madoff, taylor, alvarez, prosecutor,
[image:9.420.63.365.184.267.2]charge
Table 5: Top five words listed in decreasing order of CRS and CKLD, for each category.
4.2 Experiments
To evaluate the efficacy of the proposed category-specific importance features (i.e., CRS and CKLD), we add them to the baseline summarizer described earlier. Table 6 shows the ROUGE measures of the various summarizer configurations when tested on the TAC-2011 dataset.
Generic+CRSuses the CRS feature alongside the generic features described in the
previ-ous section (i.e., sentence position, sentence length, and INDF). LikewiseGeneric+CKLD
uses the CKLD feature in addition to the generic features, andSWINGwhich is essentially Generic+CRS+CKLDuses both CRS and CKLD. We also include the results achieved by two
other top-performing systems,CLASSY(Conroy et al., 2011) andPOLYCOM(Zhang et al., 2011),
at TAC-2011 for comparative purposes.
Configuration ROUGE-2 ROUGE-SU4
SWING 0.13796 0.16808 Generic+CRS 0.13702 0.16788 Generic+CKLD 0.13525 0.16649 CLASSY 0.12780 0.15812 POLYCOM 0.12269 0.15974
Table 6: ROUGE scores over TAC-2011 dataset. Results forCLASSYandPOLYCOMare reported
after the jackknifing procedure, as released by the shared task organizer.
The table shows that adding either one of the category-specific features toGenericoutperforms
the two top-performing summarizers on both ROUGE-2 and ROUGE-SU4. When comparing
Generic+CRSandGeneric+CKLD,Generic+CRSslightly outperformsGeneric+CKLDwith
[image:9.420.137.292.401.460.2]captures intra-category importance of words which focuses on word usage within a topic of a specific category. As TAC systems are to summarize a single topic (as opposed to a whole category), it is reasonable that CRS provides more improvement when we look at the ROUGE scores on the topics. We expect that if systems were asked to instead summarize categories, CKLD would yield a larger improvement as CKLD captures inter-category importance of words which would be more pertinent to this hypothetical task.
When both category-specific features are used (i.e.,SWING), the performance for both ROUGE-2
and ROUGE-SU4 are higher than that forGeneric+CRSandGeneric+CKLD. This validates
our hypothesis that both features are complementary to each other as they measure word statistics from different angles (i.e., intra- vs. inter-category). Two-tailed student’s t-test verifies thatSWINGsignificantly outperformsGeneric,CLASSY, andPOLYCOM(p-value<0.05).
4.2.1 Chunk-sensitive CSI Scoring
Up to this point, we have assigned sentence-wide CSI scores; the sentence score aggregates the CSI scores of all words in the sentence. However consider the word “bridge” from the category ofAccidents— “bridge” can be part of a NP chunk (e.g.,The bridge across the road...), or part of a VP chunk (e.g.,Let’s bridge our differences...). When found in a NP chunk, we can (casually) associate the use of the word with accidents. For example traffic accidents can happen on bridges, or bridges can collapse. When found in a VP chunk however, this association is lost. It is unfair then to regard a sentence as being more salient to the categoryAccidentsif it contains the word “bridge” outside of a NP chunk.
We postulate that there is a need to first determine the word’s role within a sentence, before deciding if it contributes to the saliency of the sentence. To verify this, we build variants of our scorer that ignores the CSI scores of word occurrences when they appear in chunks outside of a target chunk type.
To implement this, we parse all the input sentences from the source documents using the OpenNLP constituent grammar parser2. From the parses, we identify the constituent noun
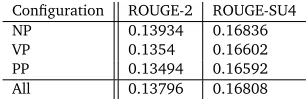
phrases (NP), verb phrases (VP) and prepositional phrases (PP). Instead of computing the CSI value of every word in the sentence, only the words found in a particular syntactic chunk (i.e., one of NP, VP, and PP) are used to compute its score. The ROUGE evaluation results of the experiments are shown in Table 7.
Configuration ROUGE-2 ROUGE-SU4
NP 0.13934 0.16836
VP 0.1354 0.16602
PP 0.13494 0.16592
[image:10.420.125.278.402.452.2]All 0.13796 0.16808
Table 7: ROUGE scores ofSWINGwhen CSI computation is restricted to specific syntactic chunks.
“All” denotes the non-chunk specific system, where results are repeated from Table 6. By restricting CSI scores to word occurrences found only within NP chunks, we obtain a statistical significant improvement (p<0.05) on the ROUGE-2 score. This result suggests that it is indeed useful to also consider the function of a word within a sentence.
We note that restricting scoring to either just VP or PP chunks reduced performance significantly when compared to the baseline on the other hand. We suspect that word usage within VP and PP chunks could be more generic, and thus do not convey additional notions of saliency. It will be insightful to investigate this further in future work.
4.2.2 Clustering Accuracy
So far, we definitively demonstrated the utility of CSI features in guided summarization. How-ever, the previous experiments made use of gold-standard, human-assigned categories for each topic, provided manually by the TAC organizers. In more typical multi-document summarization scenarios, such gold-standard categorization is unavailable. Might CSI features still be useful when such categorization is generated using less-than-perfect automatic categorization? To answer this, we set out to measure the effect that the quality of category assignments have on CSI feature efficacy.
We start by placing all the topics into one large cluster, ignoring the original human-assigned categories. Various automated clustering algorithms are then run to cluster the topics. The summarizer is then provided with these automatic clustering results to compute summaries as per the pipeline previously discussed.
Since our focus in this experiment is to measure the robustness of the CSI features, a simple clustering method suffices. We used a simple approach in which a bag-of-words feature is used for the clustering, considering only words from the first sentence of each document. This is reasonable as the first few sentences of a news article often give a good indication of the content to follow in the rest of the article.
We experiment with three clustering algorithms of K-Means, X-Means and Expectation Maxi-mization (EM), using different numbers of clusters. All experiments were carried out using the
WEKA(Hall et al., 2009) package and used only the simple bag-of-words feature to construct clusters. Evaluation results of the clustering algorithms are shown in Table 8 along with p-values from the two-tailed Student’s t-test when compared withSWINGthat used the gold-standard
clusters provided by TAC. Each configuration in the table uses the automatic clustering results assigned by the corresponding clustering algorithm while computing the relevant CSI scores.
Clustering Method Size ROUGE-2 p-value
EM 34 0.135470.13659 0.1560.158
5 0.13647 0.154
X-Means 34 0.13640.13603 0.1010.146
5 0.13546 0.117
K-Means 34 0.135740.13696 0.1730.311
[image:11.420.130.302.375.472.2]5 0.13569 0.365
Table 8: ROUGE scores ofSWINGwhen paired with different clustering schemes.p-valuesare
with respect to results obtained whenSWINGis paired with human-assigned categories from
the TAC datasets.
statistically significant. This is a positive result as it shows that our CSI features can be useful even if perfect categorization results are not available; automatic clustering can be employed to create the necessary input to calculate CSI features.
The drop in performance is expected: since CSI features measure information specific to a category, noisy clusters produced by the automatic algorithms are more likely to be less well-defined than the human assigned gold-standard categories. Any category-specific information will be diluted, and thus features seeking to exploit this information will be adversely affected. Results among the clustering methods were inconclusive. Variation in the methods employed and the number of clusters used led to mixed results that did not point towards a clear direction to favor.
5 Analysis
To gain insight on how category specific information affects our system, we manually examined the improvementsSWINGmade overGeneric. In the test topics, we found that the CSI version
selected alternative sentences in 14 out of the 44 topics, roughly 1/3 of all summaries. The categoriesAccidents,Attacks, andInvestigationshave 3 replacements each whileHealthand
Endangered Resourceshave 1 and 4 replacements, respectively. Less important a phenomenon is that the summary sentences were re-ordered in 10 instances, resulting in minor changes in ROUGE scores, as the last sentence is trimmed to keep the summary length to 100 words. The changes made by CSI in the selection are thus frequent, altering some summaries in a substantial way, made evident by the change in ROUGE score.
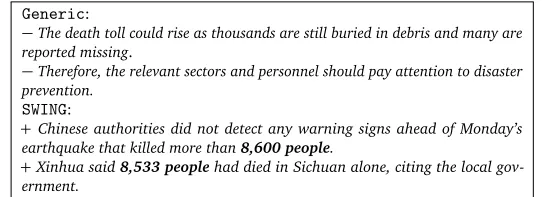
To illustrate the utility of leveraging on category specific information, differences between both systems for a topic inAccidentscategory are provided in Figure 3. The ‘−’ sign represents that the sentence is excluded and ‘+’ sign shows that the sentence is included inSWING. The first
sentence that was replaced has more category specific words like “warning”, “earthquake”, “killed”, “people”. The original sentence only contains words such as “death”, “buried”. The new sentence thus offers more information content.
Generic:
−The death toll could rise as thousands are still buried in debris and many are reported missing.
−Therefore, the relevant sectors and personnel should pay attention to disaster prevention.
SWING:
+Chinese authorities did not detect any warning signs ahead of Monday’s earthquake that killed more than8,600 people.
[image:12.420.66.340.352.451.2]+Xinhua said8,533 peoplehad died in Sichuan alone, citing the local gov-ernment.
Figure 3: Difference in summaries for the topic “Earthquake in Sichuan”, from the category
Accidents.
In the future, we plan to use category specific statistics in a more organized way to remove category-specific redundancy (akin to MMR) and to include all aspects of information in the summary.
Numerical information in a topic, such as casualties, temporal markers, monetary damages can also conflict within documents in a set on a topic, as they are compiled by different sources and at different points of time. For example, the number of casualties (boldedin summaries) is specified as 8,533 and more than 8,600 in different sentences from different sources. While any of these sentences could be selected into a summary due to similar content words, the corresponding model summary has only the most updated information (12,000 people). As a result the evaluation scores are dropped although the summarizer picks an informative sentence. This highlights the need to normalize such numerical information in the summaries which are important in categories like accidents and attacks where quantitative information is key.
Accidents Attacks Health Endangered
Resources Investigations 0.100
0.150 0.1489 0.1476
0.1340
0.0830
0.1512
0.1589 0.1524
0.1343
0.0840
0.1548
TAC Categories
ROUGE-2
[image:13.420.99.337.202.322.2]Generic SWING
Figure 4: ROUGE-2 scores for each category forGenericandSWING.
We further observed that the difficulty in summarizing a topic may vary by category. We show ROUGE-2 performance by category in Figure 4, revealing that the topics inHealthand
Endangered Resourcesare the most difficult to summarize. We believe that the larger presence of subjective aspects (How, Why, Threats) in both of these categories increases the difficulty for automatic summarizers to recognize relevant information. The topics in the other three categories are easier to summarize: we note that the improvements onAccidentsandAttacks
with the CSI features are more pronounced than in the remaining categories. When we look at the aspects defined by TAC for bothAccidentsandAttacks, we notice that seven of their aspects overlap, as shown in Table 9. This suggests that the more general aspects a category has, the easier it is to compute its category-specific information. In our future work, we plan to look at how we can utilize general versus specific aspects to improve our model of CSI.
Conclusion
Category Aspects
Accidents and Natural Disasters WHAT, WHEN, WHERE, WHY, WHO_AFFECTED,
DAMAGES, COUNTERMEASURES
Attacks WHAT, WHEN, WHERE, PERPETRATORS, WHY,
[image:14.420.46.356.71.121.2]WHO_AFFECTED, DAMAGES, COUNTERMEASURES
Table 9: Aspects for categoriesAccidentsandAttacksdefined in TAC. Seven aspects overlap in these two categories.
To probe more deeply, we assessed how to improve CSI features by limiting its calculation to word occurrences that occur within NP chunks. We also showed that automatically acquired category information (through clustering) still yields improved results, even when the artificially induced categories are noisy. Finally we performed a micro-analysis of the effect of CSI, studying the changes in sentence selection in the test dataset. This process showed that the incorporation of CSI changed selection selection significantly. The analysis also yielded insights about future directions for extractive sentence selection.
The use of CSI can be incorporated with sophisticated sentence post-processing that is a focus of current summarization research. As such, we see CSI as a foundational contribution that we urge other summarization platforms to adopt. To aid this adoption, we have open-sourced our package for the research community to use3.
Acknowledgements
We like to thank Dr. Jian Su for her help with the data sets that we have used as part of our work. This research is supported by the Singapore National Research Foundation under its International Research Centre @ Singapore Funding Initiative and administered by the IDM Programme Office.
References
Aker, A. and Gaizauskas, R. (2009). Summary Generation for Toponym-referenced Images using Object Type Language Models. InProceedings of the International Conference on Recent Advances in Natural Language Processing (RANLP), pages 6–11.
Bysani, P., Reddy, V. B., and Varma, V. (2009). Modeling Novelty and Feature Combination using Support Vector Regression for Update Summarization. InProceedings of the 7th International Conference on Natural Language Processing (ICON).
Carbonell, J. and Goldstein, J. (1998). The Use of MMR, Diversity-based Reranking for Re-ordering Documents and Producing Summaries. InProceedings of the 21st Annual International ACM Conference on Research and Development in Information Retrieval (SIGIR), pages 335–336.
Conroy, J. M., Schlesinger, J. D., Kubina, J., Rankel, P. A., and O’Leary, D. P. (2011). CLASSY 2011 at TAC: Guided and Multi-lingual Summaries and Evaluation Metrics. InProceedings of the Text Analysis Conference (TAC).
Conroy, J. M., Schlesinger, J. D., Schlesinger, J. D., and O’Leary, D. P. (2010). CLASSY 2010: Summarization and Metrics. InProceedings of the Text Analysis Conference (TAC).
Daumé III, H. and Marcu, D. (2006). Bayesian query-focused summarization. InProceedings of the 21st International Conference on Computational Linguistics and the 44th Annual Meeting of the Association for Computational Linguistics, pages 305–312.
Díaz, A. and Gervás, P. (2007). User-model Based Personalized Summarization.Information Processing & Management, 43(6):1715 – 1734.
Dunning, T. (1993). Accurate Methods for the Statistics of Surprise and Coincidence. Compu-tational Linguistics, 19(1):61–74.
Edmundson, H. P. (1969). New Methods in Automatic Extracting.Journal of ACM, 16:264–285.
Gunn, S. (1998). Support Vector Machines for Classification and Regression.ISIS Technical Report, 14.
Haghighi, A. and Vanderwende, L. (2009). Exploring Content Models for Multi-document Summarization. InProceedings of Human Language Technologies: The Annual Conference of the North American Chapter of the Association for Computational Linguistics (NAACL-HLT), pages 362–370.
Hall, M., Frank, E., Holmes, G., Pfahringer, B., Reutemann, P., and Witten, I. H. (2009). The WEKA Data Mining Software: An Update.ACM SIGKDD Explorations Newsletter, 11:10–18.
Lin, C. (2004). Rouge: A Package for Automatic Evaluation of Summaries. InText Summariza-tion Branches Out: Proceedings of the ACL-2004 Workshop, pages 74–81.
Lin, C. and Hovy, E. (2003). Automatic Evaluation of Summaries Using N-gram Co-occurrence Statistics. InProceedings of the Conference of the North American Chapter of the Association for Computational Linguistics on Human Language Technology (NAACL-HLT), pages 71–78.
Nenkova, A., Passonneau, R., and Mckeown, K. (2007). The Pyramid Method: Incorporating Human Content Selection Variation in Summarization Evaluation.ACM Transactions on Speech and Language Processing (TSLP), 4(2).
Ng, J. P., Bysani, P., Lin, Z., Kan, M. Y., and Tan, C. L. (2011). SWING: Exploiting Category Specific Information for Guided Summarization. InProceedings of the Text Analysis Conference (TAC).
Owczarzak, K. and Dang, H. T. (2010). Overview of the TAC 2010 Summarization Track. In
Proceedings of the Text Analysis Conference (TAC).
Owczarzak, K. and Dang, H. T. (2011). Overview of the TAC 2011 Summarization Track: Guided Task and AESOP Task. InProceedings of the Text Analysis Conference (TAC).
Radev, D. R., Jing, H., Sty, M., and Tam, D. (2004). Centroid-based Summarization of Multiple Documents.Information Processing & Management, 40:919–938.
Varma, V., Bysani, P., Reddy, K., Reddy, V. B., Reddy, V. B., Kovelamudi, S., Vaddepally, S. R., Nanduri, R., N, K. K., Gsk, S., and Pingali, P. (2010). IIIT Hyderabad in Guided Summarization and Knowledge Base Population. InProceedings of the Text Analysis Conference (TAC).
Zhang, R., Ouyang, Y., and Li, W. (2011). Guided Summarization with Aspect Recognition. In