Evaluating the Impact of Light Post-Editing on Usability
Sheila Castilho and Sharon O’Brien
Adapt Centre/SALIS. Dublin City University Ireland
E-mail: [email protected], [email protected]
Abstract
This paper discusses a methodology to measure the usability of machine translated content by end users, comparing lightly post-edited content with raw output and with the usability of source language content. The content selected consists of Online Help articles from a software company for a spreadsheet application, translated from English into German. Three groups of five users each used either the source text - the English version (EN) -, the raw MT version (DE_MT), or the light PE version (DE_PE), and were asked to carry out six tasks. Usability was measured using an eye tracker and cognitive, temporal and pragmatic measures of usability. Satisfaction was measured via a post-task questionnaire presented after the participants had completed the tasks.
Keywords: post-editing, usability, eye tracking
1.
Introduction
Recent advances in machine translation (MT) have enabled post-editing (PE) to become a more common practice in the translation industry, which has led to much research in the area (De Almeida and O’Brien, 2010; Depraetere, 2010; Plitt and Masselot, 2010; Sousa et al., 2011; Specia, 2011; Koponen, 2012; O’Brien et al., 2013; Guerberof, 2014; Moorkens et al., 2015). However, we know little about how end users engage with raw machine-translated text or post-edited text, or how usable such texts are, in particular if users have to follow instructions and subsequently act on them. This paper reports on a methodology to measure usability of machine translation output. The main objectives of this study are: i) to investigate the extent to which light human post-editing of machine translation impacts on the usability of instructional, online help content and, ii) to compare this with usability levels of the source text. The paper is structured as follows: Section 2 discusses related research, Section 3 and Section 4 describe the content used and the participants of the experiment respectively, Section 5 discusses the methods deployed to measure usability, Section 6 provides the preliminarily results, while Section 7 presents conclusions and plans for future work.
2.
Related Work
Existing work measuring the usability of machine translated content is still somewhat limited. Tomita et al. (1993) compare different MT systems by using reading comprehension tests from texts extracted from an English proficiency exam and translated into Japanese. They show that reading comprehension is a valid evaluation methodology for MT. Fuji et al. (2001) examine the “usefulness” of machine translated text from two commercial MT systems compared to the original English version. The experiment consists of participants reading the texts and answering comprehension questions.
Afterwards, participants evaluate the MT outputs on a 5-point scale using comprehensibility and awkwardness as concepts. Results suggest that the MT output reduces the time to answer questions for the lower score group. The authors claim their evaluation approach delivers statistically significant results easily understood by the general public.
Twenty native speakers of Danish were presented with 80 different logic puzzles and asked to solve and judge the puzzles while having their eye movements recorded. The results demonstrated a greater number of fixations on the MT version of the original text (with no simplification). Regarding task efficiency, results show that participants were less efficient when using the MT version of the original puzzles; however, the simplified MT version seemed to ease task performance when compared to the original English version.
The present paper builds on previous work by the authors (see Castilho et al., 2014), which demonstrates that lightly post-edited instructions present a higher level of usability when compared to raw MT output for Brazilian Portuguese. In this instance, German was selected as the TL due to the fact that German is frequently reported as being a challenging target language for MT. As such, we expected that the post-edited instructions would have a higher level of usability and a greater level of satisfaction when compared with the unedited instructions. We also expected that the source language English instructions would have higher usability and satisfaction compared with the machine translated/post-edited instructions.
3.
Content
In collaboration with one industry partner, we selected Online Help Content articles for one specific software program, i.e. a spreadsheet application, as the corpus for the experiment. The articles describe features of the application as well as instructions on how to use such features. The articles are published on the company’s website and the total number of words in the source content is 457. The articles were translated using Microsoft Translator1,with a custom domain for end-user content which was trained using the Microsoft Translator Hub2. It is the production system used for the company’s standard raw-MT publishing. Post-editing was carried out by the company’s translation providers and was only applied if terminology did not conform to the client-specific glossary and only if there were grammatical errors in the output. No edits were implemented for purely stylistic reasons.
4.
Participants
Fifteen participants were recruited from the student and staff body of Dublin City University3 for the experiment, five of whom were native speakers of English (EN) and ten of whom were native speakers of German. The latter were randomly assigned to one of two groups: the unedited MT group (DE_MT) or the light PE group (DE_PE). Participants were seated at the eye tracker (a Tobii T60XL) and were instructed not to reposition any of
1 https://www.microsoft.com/en-us/translator
2https://hub.microsofttranslator.com/SignIn?returnURL=%2FH
ome%2FIndex
3 Ethics approval was granted by the relevant university research
ethics committee.
the windows relating to the software product or the instructions, so as to facilitate eye-tracking analysis. Each group was initially presented with a baseline text to read in order to measure their normal reading speed. The source language group was presented with a text in English4 and both the DE_MT and DE_PE group read the same text in German (not machine translated, all related to the topic).
All users were asked to read the instructions and to carry out tasks using the spreadsheet application. Neither of the DE groups were told that the texts had been translated. While the users were carrying out the tasks, fixation data was collected via the eye tracker. This data was used to measure cognitive effort for each condition, as part of the usability measurement.
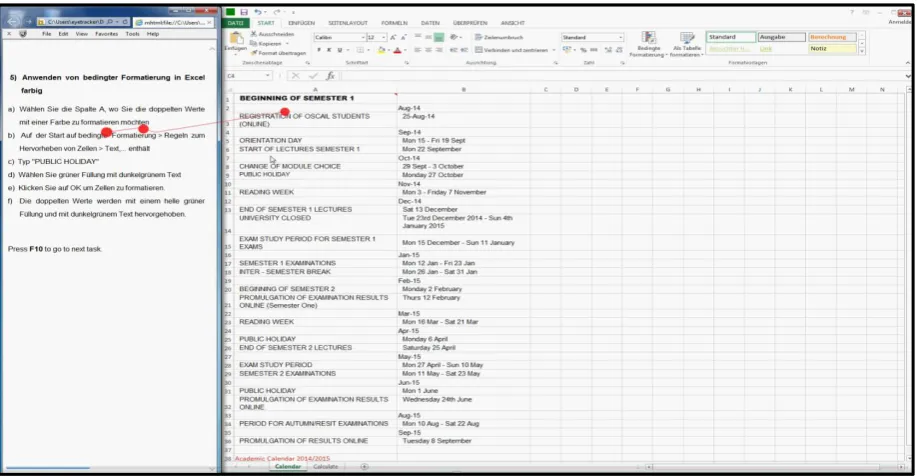
The instructions were displayed on the left-hand side of the monitor and the application where tasks were carried out took up the centre and right-hand sides of the monitor (Figure 1). The tasks consisted of: changing colors, fonts and effects in the worksheet; changing font format for hyperlinks; formatting headers and footers; applying conditional formatting with color; inserting an ‘exploding pie chart’; and inserting a ‘bar of pie chart’.
After each task, users were asked to specify whether they had completed the task. When all tasks were completed, users were asked to fill in a post-task questionnaire specifying their levels of satisfaction with the instructions.
5.
Measuring Usability
For the measurement of usability, we adopt the ISO/TR 16982 definition: “the extent to which a product can be used by specified users to achieve specified goals with
effectiveness, efficiency, and satisfaction in a specified content of use” (ISO 2002).
Effectiveness is measured through task completion, that is, how successful the users were at accomplishing tasks documented in the instructions measured by observing the user interactions as recorded by an eye tracker.
Efficiency is measured as the number of successful tasks completed (out of all possible tasks) when total task time is taken into account. A second measure of efficiency is
cognitive effort, i.e. how much cognitive effort is evident when users are reading the instructions and trying to complete their tasks? Cognitive effort is measured using typical indicators recorded via the eye tracking apparatus, i.e. fixation duration, fixation count and visit duration.
Fixation duration (FD) is the total length of fixations inside an area of interest (AOI). Fixation count (FC) is the total number of fixations within an AOI. Visit duration (VD) is the total time (in seconds) spent looking at an AOI, starting with a fixation within the AOI and ending with a fixation outside this AOI, that is, saccades
4With a total of 160 words in the English text and 150 in the
(or rapid eye movements between fixations) are also counted. Such fixation data are well established as indicators of cognitive effort (Rayner 1998, Radach et al. 2004). For example, the more fixations there are on a set of instructions, the more probable it is that the reader is having difficulties in processing the instructions.
Satisfaction is a measure of user satisfaction with the translated content and, by extension, the product itself. As satisfaction is a multi-faceted concept, we measure it using a questionnaire with a Likert scale ranging from 1 (Strongly Disagree) to 5 (Strongly Agree). In our questionnaire, “satisfaction” is addressed using a number of statements (see Section 6.6).
6.
Results
We first present the fixation data as measures of cognitive load and then present the task time and questionnaire data.
6.1 Fixation Duration
We report the Mean Fixation Duration, which is the sum of the fixation lengths (for all participants) divided by the number of all fixations. It was measured for three AOIs: baseline reading task, instructions and user interface (UI). Figure 2 presents the baseline reading task mean fixation duration (in seconds) for each group (EN=0.19, DE_MT=0.18, DE_PE=0.20). We can see that the groups present slightly different means, however the differences were not statistically significant F(2, 12) = 1.47, p = .268), which indicates that all participants read at a similar speed.
Results for mean FD for the actual task itself also show no significant differences between groups for the
Instructions (p = .355) and (p = .366) UI AOIs (EN=.19, DE_MT=.19 and DE_PE=.21).
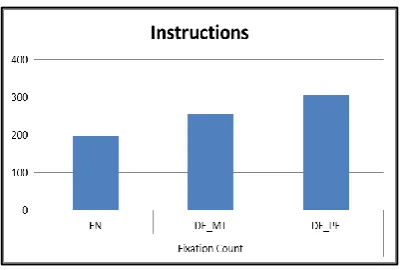
6.2 Fixation Count
For the FC, a one-way ANOVA found a significant difference between two groups for the instructions AOI, where F(2, 12)=6.81, p=.01 (see Figure 3). Tukey post-hoc comparisons indicate that the mean score for the EN condition (M=198.9, SD=22.0) was significantly different to the DE_PE condition (M=305.8, SD=62.2). However, the DE_MT (M=255, SD=43.9) condition did not significantly differ from the EN and DE_PE conditions. There are no statistically significant differences for fixation count on the UI AOI. These results show that the DE_PE group has more fixations on the instructions AOI.
Figure 1: Task design
Figure 3: Total Fixation Count
6.3 Visit Duration
We report the mean visit duration (in seconds), which is the sum of the visit length (for all participants) divided by the number of total visits. For the visit duration, a one-way ANOVA found a significant difference between two groups for the instructions AOI, where F(2, 12) = 3.7, p=.05 (see Figure 4). Tukey post-hoc comparisons indicate that the mean score for the EN condition (M=2.1, SD=.38) was significantly different to the DE_PE condition (M=3.0, SD=.52). However, the DE_MT (M=2.7, SD=.62) condition did not significantly differ from EN and DE_PE conditions.
There was a significant difference for the UI AOI, where
F(2,12) = 5.0, p=.02. Tukey post-hoc comparisons indicate that the mean score for the DE_MT condition (M=3.6, SD=1.0) was significantly different to the DE_PE (M=2.4, SD=.52) and EN (M=2.3, SD=.32) conditions.
Figure 4: Mean Visit Duration (secs)
Summary
For fixation count and visit duration, significant differences were found for the Instructions between the EN and PE groups. No significant differences were found for mean fixation duration. For visit duration, only the MT group had a significant difference for visits to the UI. The lack of difference between the MT and PE groups was surprising. However, we note that the MT group seems more reliant on the UI and less so on the instructions, which we speculate to be caused by the fact that the instructions were abandoned by the MT group in search of clarity on the UI, whereas the instructions were actually
more “usable” for the PE group, which explains why they fixated on them more.
6.4 Effectiveness - Goal Completion
Goal Completion is the total number of successfully completed tasks; this was self-reported after each task via the question: “Was the task completed?” (‘Yes’, ‘No’ and ‘Parts of it’). The validity of answers was verified by the researchers.
Table 1 summarises the total number of completed tasks for all the participants. Note that DE_PE group presents a higher number of tasks successfully completed (76%), with 13% of tasks partially completed. Even though both the DE_MT and EN groups have the same percentage for the number of tasks completed, it is interesting to note that EN has 33% of tasks partially complete against 20% for the DE_MT group, and 10% for tasks not completed against 23% for the DE_MT group.
Another metric used to compute Effectiveness is the total task time. Table 2 summarises the total task time (in seconds) per group. A one way ANOVA found significant difference between groups for the total task time, where F(2,12) = 5.28, p=.02. Tukey post-hoc comparisons indicate that the mean score for the EN condition was significantly different to both DE_MT and DE_PE conditions. No significant difference was found between the conditions DE-MT and DE_PE.
6.5 Efficiency
Efficiency is measured as the number of successful tasks completed divided by the total task time. Table 3 shows the results for Efficiency per group. Even though no statistically significant differences were found, these results suggest that the EN group was the most efficient, followed by the DE_PE group. Although having a higher total time, the DE_PE group completed more tasks than the DE_MT group, which might indicate that the latter ‘gave up’ on the tasks more easily.
YES
NO
PARTS
EN
56%
10%
33%
DE_MT
56%
23%
20%
DE_PE
76%
10%
13%
Table 2: Total Number of Completed Tasks
Total Time (secs)
Total number of
complete tasks
TOTAL (secs per task)
6.6 Satisfaction
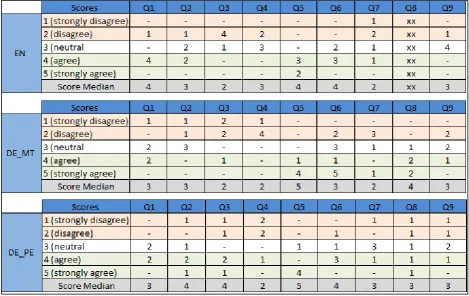
Once tasks were finished, participants were presented with a 5-point scale questionnaire (1- strongly disagree – 5- strongly agree) with the following statements:
Q1-The instructions were usable
Q2-The instructions were comprehensible
Q3-The instructions allowed me to complete all of the necessary tasks
Q4-I was satisfied with the instructions provided Q5-The instructions could be improved upon
Q6-I would be happy to consult these instructions again in the future
Q7-I would be able to use the software again in the future without re-reading the instructions
Q8-I would rather have seen the original (English) version of the instructions5
Q9-I would recommend the software to a friend/colleague
For all statements, except numbers 5 and 8, the higher score (5) indicates higher satisfaction (the opposite is true for statements 5 and 8). Table 4 presents the results for each statement and each group, while Table 5 summarises the median scores.
As can be seen, the EN and DE_PE group seem to be more satisfied with the instructions given, finding them more usable/comprehensible when compared to the DE_MT group. It is interesting to note that for Q3, the DE_PE group has a median of 4, which supports the Efficiency scores; that is, the DE_PE group had a higher number of complete tasks and, therefore, scored the
5 Note that statement 8 was not displayed for the EN group.
Total Time
Mean
SD
EN
3963.29
792.66 137.54DE_MT
5643.93
1128.79 177.19DE_PE
5965.39
1193.08 284.51Table 3: Total Task Time (Seconds)
Table 4: Post-task Questionnaire Scores
Q1
Q2
Q3
Q4
Q5
Q6
Q7
Q8
Q9
EN
4
3
2
3
4
4
2
xx
3
DE_MT
3
3
2
2
5
3
2
4
3
DE_PE
3
4
4
2
5
4
3
3
3
Score Median
instructions as “helpful”. Finally, all groups agreed that the instructions need to be improved upon (Q5).
7.
Conclusion and Future Work
This paper describes an evaluation experiment designed to measure the usability of machine translated, light post-edited and source versions for Online Help Content. Our goal was to verify whether light-post editing would increase usability compared to the raw machine translated versions.
The results show no significant differences in cognitive effort between raw and post-edited instructions, but differences exist between the post-edited versions and the source language. The cognitive data should not be viewed in isolation, however, since task time measures show the PE group to be faster and more efficient, as well as more satisfied than the MT group. This highlights the importance of collecting qualitative data for measuring usability. The observations are somewhat limited due to the relatively small number of participants and also the fact that only one language pair is used for the experiments.
For the next phase, we are collecting data from Japanese and Chinese native speakers (a further two challenging languages for MT) in order to learn if results from this paper are replicated.
8.
Main References
Castilho, S., O’Brien, S., Alvez, F. and O’Brien, M. (2014). Does post-editing increase usability? A study with Brazilian Portuguese as target language. In
Proceedings of the Seventeenth Annual Conference of the European Association for Machine Translation.
Dubrovnik, HR: EAMT, pp. 183--190.
De Almeida, G. and O’Brien, S. (2010). Analysing Post-Editing Performance: Correlations with Years of Translation Experience. In Proceedings of the 14th Annual Conference of the European Association for Machine Translation. St. Raphael, FR.
Depraetere, Ilse. (2010). What Counts as Useful Advice in a University Postediting Training Context? Report on a case study. In Proceedings of the 14th Annual Conference of the European Association for Machine Translation. St. Raphael, FR.
Doherty, S. and O’Brien, S. (2012) A User-Based Usability Assessment of Raw Machine Translated Technical Instructions. In Proceedings of the Tenth Conference of the Association for Machine Translation in the Americas. San Diego, CA: AMTA, pp. 1--10. Doherty, S. and O’Brien, S. (2014). Assessing the
Usability of Raw Machine Translation Output: A User-Centered Study using Eye Tracking.International Journal of Human-Computer Interaction, 30(1), pp. 40--51.
Fuji, M., Hatanaka, E., Ito, S., Kamai, H., Sukehiro, T., Yoshimi, T., & Ishara, H. (2001). Evaluation method for determining groups of users who find MT useful. In
Proceedings of MT Summit VIII, Santiago de (Eds.), Post-Editing of Machine Translation: Processes and Applications. Cambridge Scholars Publishing, pp. 51--76.
International Organization for Standardization. 2002.
ISO/TR 16982: Ergonomics of human-system interaction – Usability methods supporting human
centered design. Available from:
http://www.iso.org/iso/catalogue_detail?csnumber=31 176.
Jones, D., Shen, W., Granoien, N., Herzog, M. and Weinstein, C. (2005). Measuring Translation Quality by Testing English Speakers with a New Defense Language Proficiency Test for Arabic. In Proceedings of the International Conference on Intelligence Analysis. McLean, VA.
Klerke, S., Castilho, S., Barret, M. and Søgaard, A. (2015). Reading metrics for estimating task efficiency with SMT output. In Proceedings of the Sixth Workshop on Cognitive Aspects of Computational Language Learning. Lisbon, PT: Association for Computational Linguistics, pp. 6--13.
Koponen, M. (2012). Comparing Human Perceptions of Post-editing Effort with Post-editing Oper-ations. In
Proceedings of the Seventh Workshop on Statistical Machine Translation. Montreal, Canada: Association for Computational Linguistics, pp. 181--190.
Moorkens, J., O’Brien, S., Silva, I.A.L., Lima Fonseca, N.B. and Alves, F. (2015). Correlations of perceived post-editing effort with measurements of actual effort.
Machine Translation, 29(3), pp. 267--284.
O’Brien, S., Simard, M. and Specia, L. (Eds.). (2013). Workshop on Post-editing Technology and Practice (WPTP 2013). Machine Translation Summit XIV. Nice, September 2-6.
Plitt, M. and Masselot, F. (2010). A Productivity Test of Statistical Machine Translation Post-editing in a Typical Localisation Context. The Prague Bulletin of Mathematical Linguistics. Prague: pp. 7--16.
Radach, R., Kennedy, A. and Rayner, K. (2004). Eye Movements and Information Processing during Reading. Hove: Psychology Press.
Rayner, K. (1998). Eye Movements in Reading and Information Processing: 20 Years of Research.
Psychological Bulletin, (124), pp. 372--422.
Sousa, S.C.M., Aziz, W. and Specia, L. (2011). Assessing the post-editing effort for automatic and semiautomatic translations of DVD subtitles. In Proceedings of the Recent Advances in Natural Language Processing Conference. Hissar, Bulgaria: RANLP, pp. 97--103. Specia, L. (2011). Exploiting Objective Annotations for
Measuring Translation Post-editing Effort. In
Leuven, Belgium: EAMT, pp. 73--80.
Stymne, S., Danielsson, H., Bremin, S., Hu, H., Karlsson, J., Lillkull, A.P., and Wester, M. (2012). Eye Tracking as a Tool for Machine Translation Error Analysis. In Proceedings of the Language Resources and Evaluation Conference. Istanbul, pp. 1121--1126. Tomita, M., Shirai, M., Tsutsumi, J., Matsumura, M. and