Open Access
Proceedings
Comparison of the power of haplotype-based versus single- and
multilocus association methods for gene × environment (gene ×
sex) interactions and application to gene × smoking and gene × sex
interactions in rheumatoid arthritis
Astrid Dempfle
†1, Rebecca Hein
†2, Lars Beckmann
2, André Scherag
1,3,
Thuy Trang Nguyen
1, Helmut Schäfer
1and Jenny Chang-Claude*
2Address: 1Institute of Medical Biometry and Epidemiology, Philipps-University Marburg, 35037 Marburg, Germany, 2Division of Cancer
Epidemiology, German Cancer Research Center DKFZ, 69120 Heidelberg, Germany and 3Institute of Medical Informatics, Biometry and
Epidemiology, University of Duisburg-Essen, 45122 Essen, Germany
Email: Astrid Dempfle - [email protected]; Rebecca Hein - [email protected]; Lars Beckmann - [email protected]; André Scherag - [email protected]; Thuy Trang Nguyen - [email protected];
Helmut Schäfer - [email protected]; Jenny Chang-Claude* - [email protected] * Corresponding author †Equal contributors
Abstract
Accounting for interactions with environmental factors in association studies may improve the power to detect genetic effects and may help identifying important environmental effect modifiers. The power of unphased genotype-versus haplotype-based methods in regions with high linkage disequilibrium (LD), as measured by D', for analyzing gene × environment (gene × sex) interactions was compared using the Genetic Analysis Workshop 15 (GAW15) simulated data on rheumatoid arthritis with prior knowledge of the answers. Stepwise and regular conditional logistic regression (CLR) was performed using a matched case-control sample for a HLA region interacting with sex. Haplotype-based analyses were performed using a haplotype-sharing-based Mantel statistic and a test for haplotype-trait association in a general linear model framework. A step-down minP algorithm was applied to derive adjusted p-values and to allow for power comparisons. These methods were also applied to the GAW15 real data set for PTPN22.
For markers in strong LD, stepwise CLR performed poorly because of the correlation/collinearity between the predictors in the model. The power was high for detecting genetic main effects using simple CLR models and haplotype-based methods and for detecting joint effects using CLR and Mantel statistics. Only the haplotype-trait association test had high power to detect the gene × sex interaction.
In the PTPN22 region with markers characterized by strong LD, all methods indicated a significant genotype × sex interaction in a sample of about 1000 subjects. The previously reported R620W single-nucleotide polymorphism was identified using logistic regression, but the haplotype-based methods did not provide any precise location information.
from Genetic Analysis Workshop 15
St. Pete Beach, Florida, USA. 11–15 November 2006
Published: 18 December 2007
BMC Proceedings 2007, 1(Suppl 1):S73
<supplement> <title> <p>Genetic Analysis Workshop 15: Gene Expression Analysis and Approaches to Detecting Multiple Functional Loci</p> </title> <editor>Heather J Cordell, Mariza de Andrade, Marie-Claude Babron, Christopher W Bartlett, Joseph Beyene, Heike Bickeböller, Robert Culverhouse, Adrienne Cupples, E Warwick Daw, Josée Dupuis, Catherine T Falk, Saurabh Ghosh, Katrina A Goddard, Ellen L Goode, Elizabeth R Hauser, Lisa J Martin, Maria Martinez, Kari E North, Nancy L Saccone, Silke Schmidt, William Tapper, Duncan Thomas, David Tritchler, Veronica J Vieland, Ellen M Wijsman, Marsha A Wilcox, John S Witte, Qiong Yang, Andreas Ziegler, Laura Almasy and Jean W MacCluer</editor> <note>Proceedings</note> <url>http://www.biomedcentral.com/content/pdf/1753-6561-1-S1-info.pdf</url> </supplement>
This article is available from: http://www.biomedcentral.com/1753-6561/1/S1/S73
© 2007 Dempfle et al; licensee BioMed Central Ltd.
Background
The inclusion of gene × environment interaction terms in association analyses may improve the power to detect genetic effects and may contribute to the identification of important environmental effect modifiers [1]. Current technology makes it possible to genotype very dense sets of markers and the underlying genomic structure can be captured using haplotypes. The merits and drawbacks of haplotype-based compared with unphased genotype-based methods in the analysis of joint effects of genetic and non-genetic factors in regions with high linkage dise-quilibrium (LD, as measured by D') are of particular inter-est. When investigating candidate genes using dense markers that are in strong LD, the goal is to distinguish potentially causal variant(s) from those showing associa-tion merely due to LD. Using the Genetic Analysis Work-shop 15 (GAW15) simulated data, we compared the power of three genotype- and haplotype-based methods to account for gene × environment interactions both to identify the genetic region and to identify the causal vari-ant(s) in case-control scenarios. The methods are ordinary conditional logistic regression (CLR) and stepwise condi-tional logistic regression (SCLR) [2], Mantel statistics using haplotype sharing [3], and a haplotype-trait associ-ation statistic using a maximum likelihood estimate to test for interaction effects [4]. In contrast to the haplotype-trait association statistic, which provides a statistical test for each haplotype, CLR, SCLR, and the Mantel statistics provide a statistical test for each genetic marker. The meth-ods also differ in the number of tests performed as well as in the number of degrees of freedom. To account for mul-tiple hypotheses testing when investigating mulmul-tiple sin-gle-nucleotide polymorphisms (SNPs) in a candidate gene and to obtain comparable power estimates, we applied a step-down minP algorithm [5].
In addition, we explored the performance of these meth-ods in the GAW15 real data set for PTPN22 using markers in strong LD (in terms of D'). The data are a subset of the published data on rheumatoid arthritis (RA) [6]. RA is a complex autoimmune disease more common in women and in smokers [7] and with a moderately strong genetic component. Genetic association with RA was found in the
PTPN22 gene [6,8,9], where the SNP R620W has been
found to have a stronger effect in males than in females [6,10].
Methods
Simulated data sets
From the GAW15 simulated data modeling RA, we selected 100 replicate samples to represent a matched case-control study. For each replicate, the first affected off-spring within an affected sibling pair of the first 500 fam-ilies (1500 famfam-ilies in total) was chosen as case. Out of 2000 unrelated unaffected controls, 500 were matched to the cases by age and sex. The proportion of females:males in the case-control pairs was 2:1. In the simulated HLA
region from the high-density scan on chromosome 6 with 18,000 SNPs, the disease loci DR and C have the same physical position and are in high LD. The DR locus has been simulated to have a strong effect on the risk of RA independently of sex, while locus C was generated to interact with sex, such that it increases risk only in women. We investigated these loci and the 10 flanking SNPs on either side, spanning a region of about 300 kb. The alleles of the multiallelic DR locus were recoded as biallelic based on the answers, i.e., the risk allele vs. all other alleles combined.
Patients and genotypes in the RA sample
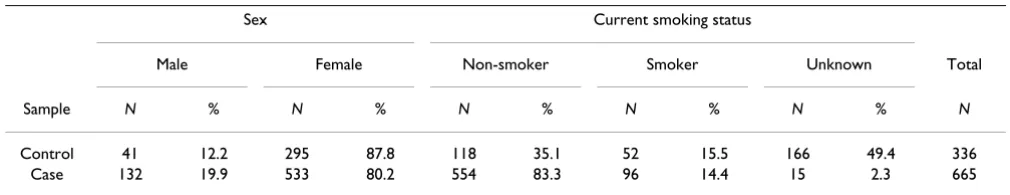
For the analysis of the real data set on PTPN22, we used all 1001 individuals from the NARAC (North American Rheumatoid Arthritis Consortium) sample for whom gen-otypes were available, these were 665 unrelated RA cases and 336 unrelated unaffected controls (Table 1, see Plenge et al. [6] for details of ascertainment). For the anal-ysis of interaction effects of SNPs and smoking, we excluded individuals whose smoking status was not known. The control sample is not representative of the population regarding the distribution of sex and smoking because it includes a higher percentage of females and smokers than the case sample. Thus the estimated main effects of sex and smoking are strongly biased and not pre-sented here. All 14 SNPs provided in PTPN22, which span approximately 58 kb, were investigated (Table 2).
Table 1: Descriptive statistics of the PTPN22 sample investigated
Sex Current smoking status
Male Female Non-smoker Smoker Unknown Total
Sample N % N % N % N % N % N
Control 41 12.2 295 87.8 118 35.1 52 15.5 166 49.4 336
Statistical analysis methods 1. Logistic regression
We investigated four different sets of CLR models: 1) the main effect of each marker individually in 22 separate regression models; 2) only the joint effect of each geno-typed marker individually with sex as an interaction term. This approach was considered in order to compare CLR and the Mantel statistics for joint effects, M1, mentioned below; 3) both the main effect of each marker individually and their interaction with sex; 4) SCLR (stepwise CLR with backwards model selection based on the Akaike informa-tion criterion) with the full model including all main and first-order interaction effects of the 22 markers simultane-ously. The SCLR approach was proposed specifically to distinguish between causal variants and those merely in LD [2]. Note that these analyses only use unphased mul-tilocus genotype data. We used an additive genetic model on the logit scale, i.e., multiplicative on the odds ratio scale, without dominance effects to reduce the number of degrees of freedom.
We employed analogous unconditional LR models for the real data on PTPN22 because cases and controls were not matched. Here, gene × environment (current smoking) and gene × sex interactions were investigated. All CLR and LR analyses were performed using the computer program R (version 2.3.1), using the general linear model (glm)
procedure and the step function for stepwise model selec-tion.
2. Haplotype-based analysis
2.1 Mantel statistic using haplotype sharing
We applied the approach of Mantel's statistics for space-time clustering to correlate genetic and phenotypic
simi-larity [3]: whereby x denotes a
putative disease locus, i and j are haplotypes, Lij(x) is measured as the number of intervals surrounding x
flanked by markers identical by state (haplotype sharing). The sum is over all pairwise comparisons of haplotypes. denotes the phenotypic similarity of the individuals
si and sj, and is defined as the mean-corrected product
, where μy denotes the sample mean, and and the disease status of si and s j. To
analyze the joint effect of a marker locus and an environ-mental factor, a measure of exposure similarity was
introduced: . is
com-puted as = 1, = , and = 0 else, where
M x L x Yij s s
i j i j
0
( ) := ( )
<
∑
Ys s
i j
Ys s ys y ys y
i j =( i −μ )( j −μ )
ys
i ysj
Zs s
i j
M x L x Yij s s Zs s
i j i j i j
1
( ) := ( )
<
∑
Zs si jZs si j zsi zsj Zs si j zsi
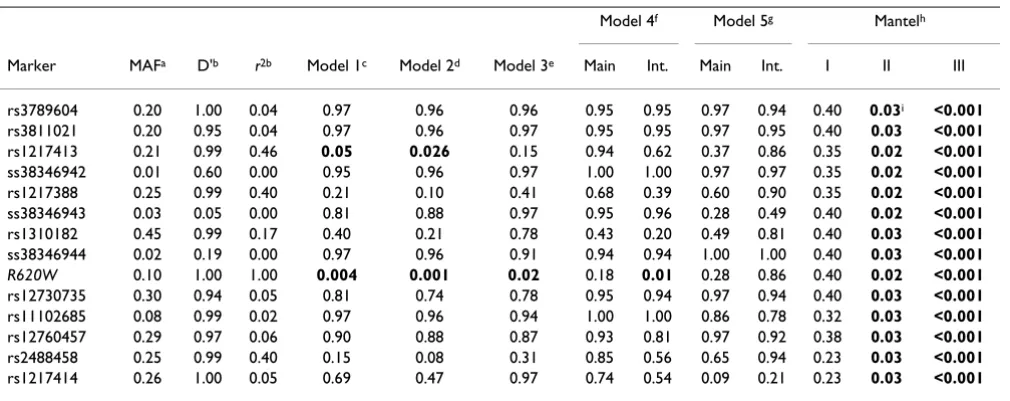
Table 2: PTPN22 analysis with LR and the Mantel statistic (adjusted p-values)
Model 4f Model 5g Mantelh
Marker MAFa D'b r2b Model 1c Model 2d Model 3e Main Int. Main Int. I II III
rs3789604 0.20 1.00 0.04 0.97 0.96 0.96 0.95 0.95 0.97 0.94 0.40 0.03i <0.001 rs3811021 0.20 0.95 0.04 0.97 0.96 0.97 0.95 0.95 0.97 0.95 0.40 0.03 <0.001 rs1217413 0.21 0.99 0.46 0.05 0.026 0.15 0.94 0.62 0.37 0.86 0.35 0.02 <0.001 ss38346942 0.01 0.60 0.00 0.95 0.96 0.97 1.00 1.00 0.97 0.97 0.35 0.02 <0.001 rs1217388 0.25 0.99 0.40 0.21 0.10 0.41 0.68 0.39 0.60 0.90 0.35 0.02 <0.001 ss38346943 0.03 0.05 0.00 0.81 0.88 0.97 0.95 0.96 0.28 0.49 0.40 0.02 <0.001 rs1310182 0.45 0.99 0.17 0.40 0.21 0.78 0.43 0.20 0.49 0.81 0.40 0.03 <0.001 ss38346944 0.02 0.19 0.00 0.97 0.96 0.91 0.94 0.94 1.00 1.00 0.40 0.03 <0.001 R620W 0.10 1.00 1.00 0.004 0.001 0.02 0.18 0.01 0.28 0.86 0.40 0.02 <0.001 rs12730735 0.30 0.94 0.05 0.81 0.74 0.78 0.95 0.94 0.97 0.94 0.40 0.03 <0.001 rs11102685 0.08 0.99 0.02 0.97 0.96 0.94 1.00 1.00 0.86 0.78 0.32 0.03 <0.001 rs12760457 0.29 0.97 0.06 0.90 0.88 0.87 0.93 0.81 0.97 0.92 0.38 0.03 <0.001 rs2488458 0.25 0.99 0.40 0.15 0.08 0.31 0.85 0.56 0.65 0.94 0.23 0.03 <0.001 rs1217414 0.26 1.00 0.05 0.69 0.47 0.97 0.74 0.54 0.09 0.21 0.23 0.03 <0.001
aMinor allele frequency among controls
bLD values calculated using the control population. All LR models consider one SNP at a time and include main effects of sex and smoking. cModel 1, main effect
dModel 2, interaction term with sex eModel 3, interaction term with smoking fModel 4, main and interaction with sex gModel 5, main and interaction with smoking
and denote the environmental factor of si and sj. M1 is
a test for joint effects and does not distinguish between genetic main effects and interaction effects.
2.2 Haplotype-trait association
We applied a test for haplotype-trait association in a gen-eral linear model framework, using maximum likelihood estimates for main and interaction effects of haplotypes and non-genetic factors, allowing for haplotype phase to be ambiguous [4,11]. Two regression models were applied. The first model contained sex and all main effects of haplotypes. The second model included all main effects and first-order haplotype-sex interaction effects. The effects of the haplotypes were modeled as additive. We first used the most frequent haplotype, which included the risk alleles on the loci DR and C, as baseline category. We also analyzed the data using a less frequent haplotype, which did not include any risk alleles, as the baseline hap-lotype. Certainly, without prior knowledge of the answers, we would not have done so. Only haplotypes with a fre-quency of at least 5% were considered. We modified the function haplo.glm, which is included in the haplo.stats R-library [4].
For the PTPN22 data set, we used a model which included the main effects of the haplotypes, sex, and smoking, as well as the first-order haplotype-sex or haplotype-smok-ing interaction terms.
3. Permutation procedure and step-down minP adjusted p-values
The numbers of tests and degrees of freedom differed between the statistical methods and models. Thus, we per-muted the case-control status while keeping together gen-otypes and sex-as well as smoking status in the analysis of the real data-for each individual, and calculated adjusted
p-values by a step-down minP algorithm [5].
Results
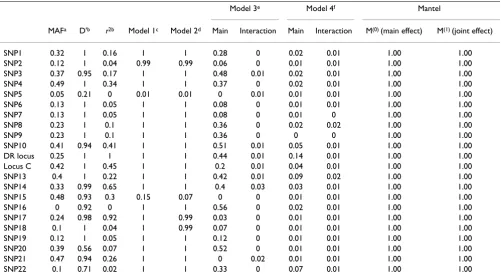
Simulated dataAs depicted in Table 3, power of CLR was generally high for Model 1 to detect the genetic main effect at the DR locus and for Model 2 to detect the joint effect of the SNPs and sex. For SNPs 5 and 15 only, there was hardly any power. In contrast, modeling of both a genetic main effect and an interaction effect resulted in very low power to detect the interaction and low to moderate power to detect the genetic main effect. SCLR performed highly unsatisfactorily and had very low power for all effects modeled.
The haplotype-sharing-based Mantel statistics had 100% power for all markers both for the genetic main effect and for the joint effect (Table 4) even when no more than 50 case-control pairs were investigated (data not shown). For
the haplotype-trait association test, we present results only for the four haplotypes, which were observed in at least 80 of 100 samples (Table 2). The GAW15 data were simulated such that the allele coded 3 at the DR locus increases RA risk while the allele coded as 1 at locus C was simulated to increase risk for RA only in women. Thus it was surprising that both risk-related alleles were also included in the most common haplotype, the reference haplotype by default. All three haplotypes indicated the main and the interaction effect with power estimates rang-ing between 0.82 and 1, and 0.65 and 0.78, respectively. We reexamined the data using as reference the second most frequent haplotype, which did not comprise the risk alleles. The estimated power was moderate to high for the detection of the main effect (0.57 to 1) and low for the detection of the interaction effect with sex (0.08 to 0.51, data not shown).
Real data
In the PTPN22 region, LR identified significant effects at R620W (p = 0.04) and rs1217413 (0.05), considering main effects only and when considering also interaction effects with sex (p = 0.007 and p = 0.026, respectively) (Table 2). The remaining SNPs surrounding R620W did not show significant results. An interaction effect with smoking was not observed. As observed for the simulated data, power was low for all effects modeled using stepwise LR (data not shown).
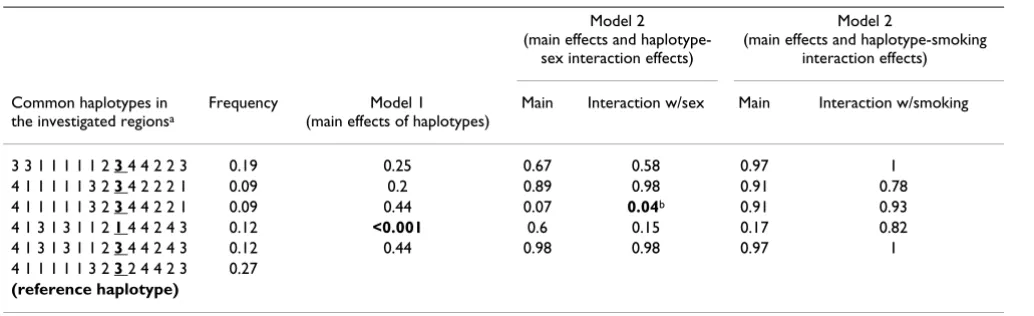
The Mantel statistics did not yield significant main effects of the investigated SNPs with the lowest adjusted p-value at 0.23 (Table 2). However, evidence for joint effects (M1) both with sex and with smoking was found (lowest adjusted p-values of 0.02 and <0.001, respectively). Six common haplotypes with frequencies ≥ 5% were esti-mated in PTPN22 (Table 5). Applying the haplotype-trait association test, one haplotype detected with a frequency 13.6% was associated with a significantly increased risk in the model comprising only main effects. This haplotype differed from all other haplotypes at locus R620W (Table 5). One haplotype with frequency 8.52%, which was found to be significant in the haplotype-sex analysis, was associated with a decreased risk. Compared to the refer-ence haplotype, this haplotype carries the same allele at R620W, but differs for SNPs rs12730735 and rs1217414. In both cases, the respective alleles are also present on other haplotypes, which do not show an interaction, thus a specific interacting disease variant could not be identi-fied. There was no evidence for a haplotype-smoking interaction.
Discussion
Current technology permits genotyping of dense marker sets across the whole genome. Once associated regions have been identified, efforts will be made to confirm these zs
results in independent samples by a hypothesis-based candidate gene approach in which control of the type I error rate will be of great importance. Accounting for gene × environment interaction given moderate genetic main effects may improve the power to detect or confirm an association with a gene, a genetic region, or causal
vari-ant(s). Given this scenario, we investigated the perform-ance of some methods proposed for detecting genetic main and gene × environmental interaction effects. We found that stepwise LR or CLR performed poorly given strong LD (as measured by D') between markers-a phe-nomenon called (multi-)collinearity that results in
over-Table 4: Power of the haplotype-trait association test using 500 case-control pairs
Common haplotypesa Frequencyb Model 1c (main effects of
haplotypes)
Model 2c
(main effects and haplotype-sex interaction effects)
Main Interaction
2122111112122221211221 0.06 1 0.95 0.78
1111111111311111111211 0.07 0.99 0.82 0.66
2122111112122221211121 0.11 1 0.99 0.65
1111111111311111111111 (reference haplotype) 0.39
a Haplotypes present in at least 80 replicates of the 100 replicates (risk loci are underlined, DR locus italicized, C locus not italicized), including the alleles at the 22 loci
b Estimated haplotype frequencies (combined sample) in the 100 replicates
c Power is the percentage of replicates in which the main or interaction effect of the respective haplotype had an adjusted p-value of ≤ 0.05. Table 3: Power for the CLR and Mantel statistic using 500 case-control pairs
Model 3e Model 4f Mantel
MAFa D'b r2b Model 1c Model 2d Main Interaction Main Interaction M(0) (main effect) M(1) (joint effect)
SNP1 0.32 1 0.16 1 1 0.28 0 0.02 0.01 1.00 1.00
SNP2 0.12 1 0.04 0.99 0.99 0.06 0 0.01 0.01 1.00 1.00
SNP3 0.37 0.95 0.17 1 1 0.48 0.01 0.02 0.01 1.00 1.00
SNP4 0.49 1 0.34 1 1 0.37 0 0.02 0.01 1.00 1.00
SNP5 0.05 0.21 0 0.01 0.01 0 0.01 0.01 0.01 1.00 1.00
SNP6 0.13 1 0.05 1 1 0.08 0 0.01 0.01 1.00 1.00
SNP7 0.13 1 0.05 1 1 0.08 0 0.01 0 1.00 1.00
SNP8 0.23 1 0.1 1 1 0.36 0 0.02 0.02 1.00 1.00
SNP9 0.23 1 0.1 1 1 0.36 0 0 0 1.00 1.00
SNP10 0.41 0.94 0.41 1 1 0.51 0.01 0.05 0.01 1.00 1.00
DR locus 0.25 1 1 1 1 0.44 0.01 0.14 0.01 1.00 1.00
Locus C 0.42 1 0.45 1 1 0.2 0.01 0.04 0.01 1.00 1.00
SNP13 0.4 1 0.22 1 1 0.42 0.01 0.09 0.02 1.00 1.00
SNP14 0.33 0.99 0.65 1 1 0.4 0.03 0.03 0.01 1.00 1.00
SNP15 0.48 0.93 0.3 0.15 0.07 0 0 0.01 0.01 1.00 1.00
SNP16 0 0.92 0 1 1 0.56 0 0.02 0.01 1.00 1.00
SNP17 0.24 0.98 0.92 1 0.99 0.03 0 0.01 0.01 1.00 1.00
SNP18 0.1 1 0.04 1 0.99 0.07 0 0.01 0.01 1.00 1.00
SNP19 0.12 1 0.05 1 1 0.12 0 0.01 0.01 1.00 1.00
SNP20 0.39 0.56 0.07 1 1 0.52 0 0.01 0.01 1.00 1.00
SNP21 0.47 0.94 0.26 1 1 0 0.02 0.01 0.01 1.00 1.00
SNP22 0.1 0.71 0.02 1 1 0.33 0 0.07 0.01 1.00 1.00
Power is the percentage of replicates in which the main or interaction effect of the respective marker had an adjusted p-value ≤ 0.05. aMinor allele frequency among controls
bLD values calculated using the control population in Replicate 1 cModel 1, main effect of one SNP at a time
fiting of the model and weak robustness [12]. It is well known that automated stepwise methods do not necessar-ily produce the best model if there are redundant predic-tors; often the model created will have poor predictive accuracy [13-15]. Although stepwise model selection was proposed for elucidating which of several markers in LD might be functionally relevant [2], this strategy seems to be inefficient when strong LD (in terms of D') exists. In this situation, ordinary LR performs very well when only the main effect of each marker is tested separately in a model and the p-values are adjusted for the total number of tests performed. The low power for SNP 5 is likely due to low LD (r2 ≈ 0) with the disease loci and non-matching allele frequencies [16]. This does not appear to apply for SNP 15, where power is low but LD is stronger. All other markers had a power of about 100% for the genetic main effect despite mostly low r2-values between these markers and the disease loci. Therefore, in the simulated scenario, it was not possible to localize the functional variant within this region, e.g., there was no general tendency for the true causal locus to have the smallest p-value or largest effect size estimate. The simulated genetic main effect was also much stronger than the interaction effect, so that there was no improvement adding a gene × sex interaction term in the model. A much larger sample size would have been necessary for detecting the interaction effect.
There was only a limited number of haplotypes estimated from the 22 simulated markers due to the strong LD (as measured by D') between them. Both haplotype-based methods were able to detect association in the investi-gated region but they failed to identify the disease vari-ant(s). The findings regarding joint effects suggest that analysis for joint effects may be an option for detecting genetic effects in some situations. For smaller sample sizes, the Mantel statistics for joint effects (M1), however,
is more powerful than a similar LR modeling of interac-tion effects (data not shown).
For the analysis of PTPN22 in RA, we used a subset of the data of Plenge et al. [6], who identified an interaction of R620W with sex in a case-only analysis in their complete data set of about 4100 RA cases and controls. Using the different LR models, we were also able to detect this gen-otype × sex interaction in a subsample of 1001 subjects at R620W. The lack of significance for the genetic main effect in the model including both main and interaction terms, indicated that the effect of R620W indeed depends on the gender of the genotype carrier. Furthermore, it was possi-ble to distinguish R620W from neighboring markers with allele frequencies that did not match and low r2-values [16]. The Mantel statistic failed to identify main effects but showed strong evidence for a joint effect both with gender and with smoking in model M1. These significant effects may however be due to apparent strong main effects of sex and smoking caused by an unrepresentative control sam-ple and may not reflect a true interaction effect. No spe-cific marker could be detected as disease-causing polymorphism because of the dependency of the test sta-tistics at different markers. By contrast, the results of the haplotype association method haplo.glm were similar to the results of the LR models implicating the R620W locus as a risk locus for RA. However, it is unclear whether the significant haplotype-sex interaction observed for a differ-ent haplotype refers to a further disease variant.
Conclusion
Our results suggest that stepwise or other automated vari-able selection methods are not suitvari-able for the investiga-tion of gene × environment interacinvestiga-tions in regions with high LD, as measured by D'. Given strong genetic main effects and moderate gene-sex interaction, as in the simu-Table 5: Adjusted p-values for the haplotype-trait association test in PTPN22
Model 2 (main effects and
haplotype-sex interaction effects)
Model 2
(main effects and haplotype-smoking interaction effects)
Common haplotypes in the investigated regionsa
Frequency Model 1 (main effects of haplotypes)
Main Interaction w/sex Main Interaction w/smoking
3 3 1 1 1 1 1 2 3 4 4 2 2 3 0.19 0.25 0.67 0.58 0.97 1 4 1 1 1 1 1 3 2 3 4 2 2 2 1 0.09 0.2 0.89 0.98 0.91 0.78 4 1 1 1 1 1 3 2 3 4 4 2 2 1 0.09 0.44 0.07 0.04b 0.91 0.93 4 1 3 1 3 1 1 2 1 4 4 2 4 3 0.12 <0.001 0.6 0.15 0.17 0.82 4 1 3 1 3 1 1 2 3 4 4 2 4 3 0.12 0.44 0.98 0.98 0.97 1 4 1 1 1 1 1 3 2 3 2 4 4 2 3 0.27
(reference haplotype)
Publish with BioMed Central and every scientist can read your work free of charge
"BioMed Central will be the most significant development for disseminating the results of biomedical researc h in our lifetime."
Sir Paul Nurse, Cancer Research UK
Your research papers will be:
available free of charge to the entire biomedical community
peer reviewed and published immediately upon acceptance
cited in PubMed and archived on PubMed Central
yours — you keep the copyright
Submit your manuscript here:
http://www.biomedcentral.com/info/publishing_adv.asp
BioMedcentral
lated data, both simple CLR and haplotype-based meth-ods have adequate power for the detection of genetic main effects without considering gene × sex interaction in mod-erate sample sizes. In the simulated scenario, haplotype-trait association tests had better power than simple LR modeling to detect moderate gene × sex interactions. However, this result cannot be generalized to other situa-tions without further simulation studies under different genetic models. On the other hand, haplotype-based methods that always use data from consecutive markers tend to yield similar results for neighboring markers, thus making localization of a causal variant potentially more difficult than with genotype-based methods that consider each marker at a time. Thus, the potential for localization of causal variants with each method should also be explored in further simulation studies.
Competing interests
The author(s) declare that they have no competing inter-ests.
Acknowledgements
This work was supported by the Deutsche Forschungsgemeinschaft (grant CH117/3-1) and by the Bundesministerium für Bildung und Forschung through the German National Genome Net (NGFN, grant numbers 01GR0460, 01GR0461).
This article has been published as part of BMC Proceedings Volume 1 Sup-plement 1, 2007: Genetic Analysis Workshop 15: Gene Expression Analysis and Approaches to Detecting Multiple Functional Loci. The full contents of the supplement are available online at http://www.biomedcentral.com/ 1753-6561/1?issue=S1.
References
1. Hunter DJ: Gene-environment interactions in human dis-eases. Nat Rev Genet 2005, 6:287-298.
2. Cordell HJ, Clayton DG: A unified stepwise regression proce-dure for evaluating the relative effects of polymorphisms within a gene using case/control or family data: application to HLA in type 1 diabetes. Am J Hum Genet 2002, 70:124-141. 3. Beckmann L, Thomas DC, Fischer C, Chang-Claude J: Haplotype
sharing analysis using Mantel statistics. Hum Hered 2005,
59:67-78.
4. Lake SL, Lyon H, Tantisira K, Silverman EK, Weiss ST, Laird NM, Schaid DJ: Estimation and tests of haplotype-environment interaction when linkage phase is ambiguous. Hum Hered 2003, 55:56-65.
5. Obreiter M, Fischer C, Chang-Claude J, Beckmann L: SDMinP: a program to control the family wise error rate using step-down minP adjusted P-values. Bioinformatics 2005, 21:3183-3184. 6. Plenge RM, Padyukov L, Remmers EF, Purcell S, Lee AT, Karlson EW, Wolfe F, Kastner DL, Alfredsson L, Altshuler D, Gregersen PK, Klareskog L, Rioux JD: Replication of putative candidate-gene associations with rheumatoid arthritis in >4,000 samples from North America and Sweden: association of susceptibil-ity with PTPN22, CTLA4, and PADI4. Am J Hum Genet 2005,
77:1044-1060.
7. Criswell LA, Merlino LA, Cerhan JR, Mikuls TR, Mudano AS, Burma M, Folsom AR, Saag KG: Cigarette smoking and the risk of rheu-matoid arthritis among postmenopausal women: results from the Iowa Women's Health Study. Am J Med 2002,
112:465-471.
8. Begovich AB, Carlton VE, Honigberg LA, Schrodi SJ, Chokkalingam AP, Alexander HC, Ardlie KG, Huang Q, Smith AM, Spoerke JM, Conn MT, Chang M, Chang SY, Saiki RK, Catanese JJ, Leong DU,
Gar-cia VE, McAllister LB, Jeffery DA, Lee AT, Batliwalla F, Remmers E, Criswell LA, Seldin MF, Kastner DL, Amos CI, Sninsky JJ, Gregersen PK: A missense single-nucleotide polymorphism in a gene encoding a protein tyrosine phosphatase (PTPN22) is associ-ated with rheumatoid arthritis. Am J Hum Genet 2004,
75:330-337.
9. Carlton VE, Hu X, Chokkalingam AP, Schrodi SJ, Brandon R, Alexan-der HC, Chang M, Catanese JJ, Leong DU, Ardlie KG, Conn MT, Chang M, Chang SY, Saiki RK, Catanese JJ, Leong DU, Garcia VE, McAllister LB, Jeffery DA, Lee AT, Batliwalla F, Remmers E, Criswell LA, Seldin MF, Kastner DL, Amos CI, Sninsky JJ, Gregersen PK:
PTPN22 genetic variation: evidence for multiple variants
associated with rheumatoid arthritis. Am J Hum Genet 2005,
77:567-581.
10. Pierer M, Kaltenhauser S, Arnold S, Wahle M, Baerwald C, Hantzschel H, Wagner U: Association of PTPN22 1858 single-nucleotide polymorphism with rheumatoid arthritis in a German cohort: higher frequency of the risk allele in male compared to female patients. Arthritis Res Ther 2006, 8:R75.
11. Schaid DJ, Rowland CM, Tines DE, Jacobson RM, Poland GA: Score tests for association between traits and haplotypes when linkage phase is ambiguous. Am J Hum Genet 2002, 70:425-434. 12. Draper N, Smith H: Applied Regression AnalysisNew York: John Wiley
and Sons; 1998:369.
13. Derkson S, Keselman H: Backward, forward and stepwise auto-mated subset selection algorithms: frequency of obtaining authentic and noise variables. Br J Math Statist Psychol 1992,
45:265-282.
14. Judd C, McClelland G: Data Analysis: A Model-Comparison ApproachSan Diego: Harcourt Brace Jovanovich; 1989.
15. Steyerberg EW, Eijkemans MJ, Harrell FE Jr, Habbema JD: Prognos-tic modeling with logisPrognos-tic regression analysis: in search of a sensible strategy in small data sets. Med Decis Making 2001,
21:45-56.
16. Zondervan KT, Cardon LR: The complex interplay among fac-tors that influence allelic association. Nat Rev Genet 2004,