Copyright2004 by the Genetics Society of America DOI: 10.1534/genetics.104.029603
Sequencing Complex Diseases With HapMap
Tian Liu,* Julie A. Johnson,
†George Casella* and Rongling Wu*
,1*Department of Statistics and†Department of Pharmacy Practice, University of Florida, Gainesville, Florida 32611
Manuscript received April 20, 2004 Accepted for publication May 26, 2004
ABSTRACT
Determining the patterns of DNA sequence variation in the human genome is a useful first step toward identifying the genetic basis of a common disease. A haplotype map (HapMap), aimed at describing these variation patterns across the entire genome, has been recently developed by the International HapMap Consortium. In this article, we present a novel statistical model for directly characterizing specific sequence variants that are responsible for disease risk based on the haplotype structure provided by HapMap. Our model is developed in the maximum-likelihood context, implemented with the EM algorithm. We perform simulation studies to investigate the statistical properties of this disease-sequencing model. A worked exam-ple from a human obesity study with 155 patients was used to validate this model. In this examexam-ple, we found that patients carrying a haplotype constituted by allele Gly16 at codon 16 and allele Gln27 at codon 27 genotyped within the2AR candidate gene display significantly lower body mass index than patients carrying the other haplotypes. The implications and extensions of our model are discussed.
C
URRENT studies of genetic mapping have been de- tected with given markers cannot give any informationabout the sequence structure and organization of QTL. veloped to a point at which the quantitative
varia-tion of almost any complex trait can be dissected into its Second, the inference of the QTL positions using the
nearby markers is sensitive to marker informativeness, underlying Mendelian factors on the basis of molecular
linkage maps (LanderandBotstein1989) or association marker density, and mapping population type. As a
re-sult of these, only a few QTL detected from markers have
studies (Wuet al.2002;Louet al.2003). Such Mendelian
factors,i.e., the so-called quantitative trait loci (QTL), been successfully cloned (Fraryet al.2000), despite a
considerable number of QTL reported in the literature.
arehypothesized regions with alleles triggering an effect
on quantitative variation. A number of statistical meth- A more accurate and useful approach for the
charac-terization of genetic variants contributing to quantitative ods have been developed to map QTL for various
map-variation is to directly analyze DNA sequences associated ping population structures and different marker and
with a particular disease. If a string of DNA sequence character types, each aimed at precisely identifying QTL
is known to increase disease risk, this risk can be reduced that are close enough to markers for their positional
by the alteration of this string of DNA sequence using a cloning using biotechnology approaches, such as
chro-specialized drug. The control of this disease can be made
mosome walks (WuandCasella2005). These methods
more efficient if all possible DNA sequences determin-have led to the detection of QTL contributing to
com-ing its variation are identified in the entire genome. plex traits in a range of species from microorganisms
With the recent development of the human genome
to plant and animal species to humans (Mackay2001).
project, massive amounts of DNA sequence data have The basic principle for QTL mapping is the
cosegre-been available across the human genome (
Interna-gation of the alleles at a QTL with those at one or a set of
tional HapMap Consortium2003). In particular, sin-known polymorphic markers genotyped on a genome. If
gle-nucleotide polymorphisms (SNPs), being the most a QTL is cosegregating with molecular markers, the
ge-common type of variant in the DNA sequence, provide netic effects of QTL and their genomic positions can
a powerful means for genotyping the whole genome. be estimated from the markers. This approach is robust
This facilitates the complete identification of specific and powerful for the detection of major QTL and
pre-sequence variants responsible for complex diseases. A sents the most efficient way to utilize marker
informa-linear arrangement of alleles (i.e., nucleotides) at
differ-tion when marker maps are sparse. However, this
ap-ent SNPs on a single chromosome, or part of a chromo-proach is limited in two aspects. First, because the markers
some, is called a haplotype. The cosegregation of SNP and QTL bracketed by them are located at different
alleles on haplotypes leads to nonrandom association, genomic positions, the significant linkage of a QTL
de-i.e., linkage disequilibrium (LD), between these alleles in
the population. Empirical analyses of LD for SNPs have shown that nearby SNPs in the human genome tend to
1Corresponding author:Department of Statistics, 533 McCarty Hall C,
University of Florida, Gainesville, FL 32611. E-mail: [email protected] display highly significant levels of LD and are often
tributed in block-like patterns, rather than displaying Our interest is to search for the haplotype diversity that can explain phenotypic variation in a complex dis-random- or even-spaced distribution as originally
pre-dicted (Patilet al. 2001;Dawsonet al.2002;Gabriel ease. The association between haplotype diversity and
phenotypic variation has been detected in several
stud-et al. 2002). SNPs within haplotype blocks are much
more strongly associated with each other than are those ies of drug responses (Judsonet al.2000;Bader2001).
This allows us to assume that a particular haplotype is between different blocks. Haplotype diversity within each
different from other haplotypes for a given disease. Be-block can be well explained by only a finite number
cause haplotypes (comprising diplotypes) cannot be di-of SNPs, called tag SNPs or representative SNPs. The
rectly observed, the effects of different haplotypes on existence of these tag SNPs means that it is not
neces-the phenotype need be postulated from observed zy-sary to associate a disease with all SNPs in the DNA
gotic genotypes. The inference of diplotypes for a partic-sequence to understand the complete genetic control
ular genotype is statistically a missing data problem that of the disease.
can be formulated by a finite mixture model (Wuand
In this article, we present a novel statistical model for
Casella2005). determining specific DNA sequences that are associated
Likelihood function:In this study, the complete data with the phenotypic variation of disease risk. This model
are diplotype configurations at a given set of SNPs for is derived on the basis of multilocus haplotype analysis
each genotype and for disease outcomes of subjects, using a finite number of tag SNPs. We derived a
closed-whereas the observed data are the genotypes of these form solution for estimating the effects of haplotypes,
SNPs and the disease outcomes. The missing data are at haplotype frequencies, allele frequencies, and the
de-the connection from de-the genotypes to diplotypes. For grees of LD of various orders among tag SNPs
underly-any given genotype, all possible diplotypes can be writ-ing the disease. We performed simulation studies to test
ten out. For example, genotypeA1
1A11/A21A21has one diplo-the statistical behavior of this haplotype-based
sequence-type [A1
1A21][A11A21], as does genotype A11A11/A21A22, the mapping model. A worked example is used to validate
diplotype [A1
1A21][A11A22]. This is because in these
situa-our model, in which a DNA sequence variant is detected
tions where at most one SNP is heterozygous, the geno-to significantly reduce human obesity.
type and diplotype are identical. However, for a
double-heterozygous genotypeA1
1A12/A21A22, we have two diplotypes, [A1
1A21][A12A22] and [A11A22][A12A12].
THEORY
Table 1 lists all possible genotypes and diplotypes
Suppose there is a random sample of size n drawn at two SNPs genotyped from a sample of size n. Each
from a natural human population at Hardy-Weinberg genotype (and therefore each diplotype) is composed
equilibrium. In this sample, a number of SNPs are geno- of two haplotypes, one from the mother and the other
typed genome-wide, aimed at the identification of DNA from the father. Two haplotypes composing a diplotype
sequences responsible for a complex disease. Consider come from four possible haplotypes, A1
1A21,A11A22,A12A21,
R (R ⬎ 1) tag SNPs for a haplotype block. Each of and A1
2A22, whose frequencies are expressed as p11, p12,
theseRSNPs has two alleles denoted byAr
kr(kr⫽ 1, 2; p21, andp22, respectively. The diplotype frequencies can
r⫽1, . . .R), with allele frequencies denoted byp(r)
kr for be expressed in terms of the haplotype frequencies
(Ta-therth SNP. We use superscripts and subscripts to distin- ble 1). Two diplotypes [A1
1A21][A12A22] and [A11A22][A12A21]
guish between different SNPs and different alleles of a double heterozygote A1
1A12/A21A22 have frequencies
within SNPs, respectively. These SNPs form 2R
possible p11p22andp12p12, respectively. Thus, the relative
frequen-haplotypes expressed asA1
k1A2k2. . .ARkR, whose frequencies cies of these two diplotypes for this double heterozygote
are denoted by pk1k2...kR. The haplotype frequencies are are a function of haplotype frequencies, which can be
composed of allele frequencies at each SNP and linkage expressed asp11p22/(p11p22⫹p12p21) andp12p21/(p11p22⫹
disequilibria of different orders among SNPs (Louet al. p12p21), respectively.
2003). The random combination of maternal and pater- Table 1 also gives the relative expected frequencies
nal haplotypes generates 2R⫺1(2R ⫹ 1) diplotypes
ex-of haplotypes contained in a given genotype. All
geno-pressed as [A1
k1A
2
k2. . .A R kR][A
1
l1A2l2. . .ARlR] (1 ⱕ k1 ⱕ l1 ⱕ types, except for the double heterozygote, contain one
or two known haplotypes. For example, genotypeA1
1A11/
2, . . . , 1ⱕ kRⱕ lRⱕ 2). TheseRSNPs form 3R
observ-able multilocus zygotic genotypes, generally expressed as A2
1A21has one haplotypeA11A21, whereasA11A11/A21A22has one A1
k1A1l1/A2k2A2l2/. . ./ARkRARlR. When at most one SNP is hetero- half haplotype A11A21 and one half haplotype A11A22. The
double heterozygote contains four possible haplotypes, zygous, the diplotype is consistent to its zygotic genotype.
However, when two or more SNPs are heterozygous, the with the relative frequenciesp11p22/(p11p22⫹p12p21) for
genotype will have different diplotypes and, therefore, the haplotypesA1
1A21andA12A22andp12p21/(p11p22⫹p12p21) for
number of multilocus genotypes will be less than the num- haplotypesA1
1A22andA21A21.
ber of diplotypes. LetP[k1k2. . . kR][l1l2. . . lR]andPk1l1/k2l2/ . . . /kRlR de- The haplotype frequencies, arrayed by⍀p⫽(p11,p12,
p21,p22), that belong to population genetic parameters
note the diplotype and genotype frequencies, respectively,
can be estimated using the nine observed genotypes andnk1l1/k2l2/ . . . /kRlRdenote the observations of various
ge-(G) for two SNPs (Table 1). The log-likelihood function
505 Sequencing Complex Diseases
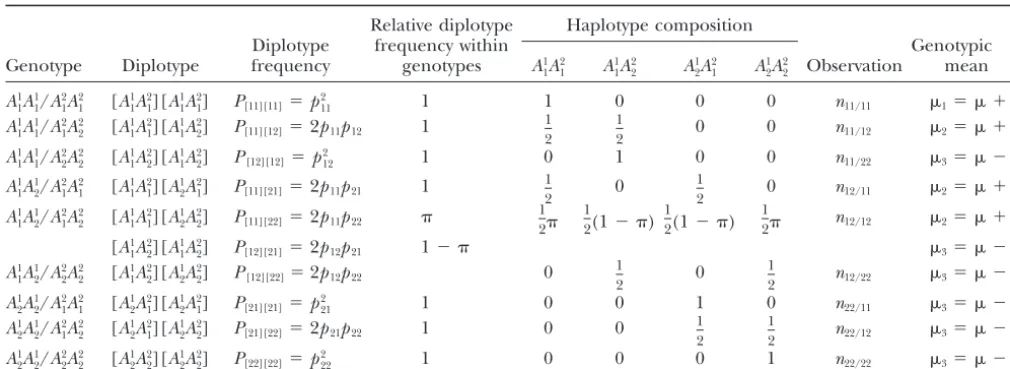
TABLE 1
Possible diplotype configurations of nine genotypes at two SNPs and their haplotype composition frequencies
Relative diplotype Haplotype composition
Diplotype frequency within Genotypic
Genotype Diplotype frequency genotypes A1
1A 2 1 A 1 1A 2 2 A 1 2A 2 1 A 1 2A 2
2 Observation mean
A1
1A11/A21A12 [A11A21][A11A21] P[11][11]⫽p211 1 1 0 0 0 n11/11 1⫽ ⫹a
A1 1A
1 1/A
2 1A
2
2 [A
1 1A
2 1][A
1 1A
2
2] P[11][12]⫽2p11p12 1 1 0 0 n11/12 2⫽ ⫹d
2
1 2 A1
1A11/A22A22 [A11A22][A11A22] P[12][12]⫽p212 1 0 1 0 0 n11/22 3⫽ ⫺a
A1 1A
1 2/A
2 1A
2
1 [A
1 1A
2 1][A
1 2A
2
1] P[11][21]⫽2p11p21 1 1 0 0 n12/11 2⫽ ⫹d
2
1 2 A1
1A12/A21A22 [A11A21][A21A22] P[11][22]⫽2p11p22 1 n12/12 2⫽ ⫹d
2 1 2(1⫺ )
1 2(1⫺ )
1 2
[A1 1A
2 2][A
1 1A
2
2] P[12][21]⫽2p12p21 1⫺ 3⫽ ⫺a
A1
1A12/A22A22 [A11A22][A21A22] P[12][22]⫽2p12p22 0 1 0 n12/22 3⫽ ⫺a
2 1 2 A1 2A 1 2/A
2 1A
2
1 [A
1 2A
2 1][A
1 2A
2
1] P[21][21]⫽p221 1 0 0 1 0 n22/11 3⫽ ⫺a
A1
2A12/A21A22 [A12A21][A12A22] P[21][22]⫽2p21p22 1 0 0 1 n22/12 3⫽ ⫺a
2 1 2 A1 2A 1 2/A
2 2A
2
2 [A
1 2A
2 2][A
1 2A
2
2] P[22][22]⫽p222 1 0 0 0 1 n22/22 3⫽ ⫺a
⫽p11p22/(p11p22⫹p12p21), wherep11,p12,p21, andp22are the haplotype frequencies ofA11A21,A11A22,A12A21, andA12A22, respectively.
of unknown haplotype frequencies given observed
geno-types can be written as a multinomial form,i.e.,
f[k1l2][l1k2](yi)⫽
1
√
2exp冤
⫺(yi⫺ [k1l2][l1k2]i)2
22
冥
logL(⍀p|G)⬀2n11/11logp11⫹n11/12log(2p11p12)⫹2n11/12logp12
are the probability density functions for subjecti who
⫹n12/11log(2p11p21)⫹n12/12log[2(p11p22⫹p12p21)]
has two possible diplotypes, respectively, with the geno-⫹n12/22log(2p12p22)⫹2n22/11logp21⫹n22/12log(2p21p22)⫹2n22/22logp22.
typic means of[k1k2][l1l2]for diplotype [A
1
k1A
2
k2][A
1
l1A
2
l2] and
(1) [
k1l2][l1k2] for diplotype [A
1
k1A
2
l2][A
1
l1A
2
k2] and the common
residual variance of2. Note that subscriptiis used to
Assuming that diplotypes are associated with
pheno-describe the genotypic means in the two density func-typic variation in a disease, we formulate a likelihood
tions above because these means are diplotype- (and
for unknown population (⍀p) and quantitative genetic
therefore subject-) dependent although there are only
parameters (⍀q) given observed phenotypes (y) and SNP
a total of 10 genotypic means for two SNPs. These means
genotypes (G). Generally speaking, a given 2-SNP
geno-and variance are contained in vector⍀q ⫽ ([k1k2][l1l2]i,
type,A1
k1A1l1/A2k2A2l2, can be partitioned into two possible dip- [
k1l2][l1k2]i,2).
lotypes, [A1
k1A
2
k2][A
1
l1A
2
l2] and [A
1
k1A
2
l2] [A
1
l1A
2
k2]. Thus, such a
Suppose there is a particular haplotype,A1
k1A2k2, which is
log-likelihood function can be formulated on the basis of
different from the other three haplotypes, A1
k1A2k¯2,A1k¯1A2k2,
a two-component mixture model,i.e.,
andA1k¯1A2k¯2(where a bar means the alternative of that
al-lele), in its effect on a complex disease. The phenotypic
logL(⍀p,⍀q|y,G)⫽
兺
n
i⫽1
log[if[k1k2][l1l2](yi) means of the three genotypes that contain these two
dis-tinct groups of haplotypes are denoted as1 forA1k1A
1
k1/
⫹ (1⫺ i)f[k1l2][l1k2](yi)], A2
k2A
2
k2, 2 for A
1
k1A
1
k¯1/A
2
k2A
2
k¯2, and3 for A
1
k¯1A
1
k¯1/A
2
k¯2A
2
k¯2. On
(2) the basis of quantitative genetic theory, these three ’s
can be partitioned into the overall mean (), the
addi-where the mixture proportion, tive effect (a) due to the substitution of different
haplo-types, and the dominant effect (d) due to the interaction
between different haplotypes,i.e.,1⫽ ⫹a,2⫽ ⫹
i⫽
P[k1k2][l1l2]i
P[k1k2][l1l2]i⫹P[k1l2][l1k2]i
,
d, and 3 ⫽ ⫺ a. In Table 1, the genotypic means
are also given for different genotypes by assuming that
represents the relative frequency of subject i whose haplotypeA1
1A21 is different from the rest of the
haplo-diplotype is [A1
k1A2k2][A1l1A2l2], and types.
The log-likelihood function described by Equation 2 can be expanded to include all possible SNP genotypes,
f[k1k2][l1l2](yi)⫽
1
√
2exp冤
⫺(yi⫺ [k1k2][l1l2]i)2
22
冥
Note that for all the other genotypes, such probabilities logL(⍀p,⍀q|y,G)⫽
兺
n11/11
i⫽1
logf[11][11](yi)
do not exist.
In the M step, the probabilities calculated in the
previ-⫹
兺
n11/12i⫽1
logf[11][12](yi) ous iteration are used to estimate the haplotype
frequen-cies using
⫹
兺
n11/22i⫽1
logf[12][12](yi)
pˆ11⫽
2n11/11⫹n11/12⫹n12/11⫹
兺
n12/12 i⫽1 [11][22]i
2n
, (7)
⫹
兺
n12/11i⫽1
logf[11][21](yi)
pˆ12⫽
2n11/22⫹ n11/12⫹n12/22⫹
兺
n12/12
i⫽1 (1⫺ [11][22]i)
2n , (8)
⫹
兺
n12/12i⫽1
log[f[11][22](yi)⫹(1⫺ )f[12][21](yi)]
pˆ21⫽
2n22/11⫹ n12/11⫹n22/12⫹
兺
n12/12
i⫽1 (1⫺ [11][22]i)
2n , (9)
⫹
兺
n12/22i⫽1
logf[12][22](yi)
pˆ22⫽
2n22/22⫹ n12/22⫹n22/12⫹
兺
n12/12 i⫽1 [11][22]i
2n
. (10)
⫹
兺
n22/11i⫽1
logf[21][21](yi)
Assuming that haplotype A1
1A11 has an effect different
⫹
兺
n22/12i⫽1
logf[21][22](yi) from the other three haplotypes, these probabilities are
used to estimate the haplotype additive and dominant effects and the residual variance by
⫹
兺
n22/22i⫽1
logf[22][22](yi), (3)
ˆ1⫽
兺
n11/11
i⫽1 yi n11/11
, (11)
given that these SNP genotypes are independent. It can be seen from the above likelihood function that,
al-though most zygote genotypes contain a single compo- ˆ2⫽
兺
n˙ i⫽1yi⫹
兺
n12/12
i⫽1
兿
[11][22]iyi n˙⫹兺
n12/12i⫽1
兿
[11][22]i, (12)
nent (diplotype), the double heterozygote is the
mix-ture of two possible diplotypes weighted byand 1⫺
ˆ3⫽
兺
n¨ i⫽1yi⫹
兺
n12/12
i⫽1 (1⫺
兿
[11][22]i)yi n¨⫹兺
n12/12i⫽1 (1⫺
兿
[11][22]i), (13)
. Thus, an advanced statistical method should be
im-plemented to obtain the MLEs of the underlying
popu-lation and quantitative genetic parameters. ˆ2⫽1
n
冦
兺
n11/11i⫽1
(yi⫺ ˆ1)2⫹
兺
n˙i⫽1
(yi⫺ ˆ2)2⫹
兺
n¨i⫽1 (yi⫺ ˆ3)2 An integrative EM algorithm: We derived a
closed-form solution for estimating the unknown parameters
⫹
兺
n12/12
i⫽1
关⌸[12/12]i(yi⫺ ˆ2)2⫹(1⫺ ⌸[12/12]i)(yi⫺ ˆ3)2兴
冧
,(14)with the EM algorithm (Dempsteret al.1977).
Haplo-type frequencies can be expressed as a function of allelic
wheren˙⫽n11/12⫹n12/11andn¨⫽n11/22⫹n12/22⫹n21/21⫹
frequencies and LD. For a two-SNP haplotype, we have
n21/22 ⫹ n22/22. Iterations including the E and M steps
pk1k2 ⫽pk1pk2⫹(⫺1)k1⫹k2D, (4) are repeated among Equations 5–14 until the estimates
of the parameters converge to stable values. The
sam-whereDis the linkage disequilibrium between the two
pling errors of these parameters can be estimated by SNPs. Thus, once haplotype frequencies are estimated,
calculating Louis’s (1982) observed information
ma-we can estimate allelic frequencies and LD by solving
trix. Equation 3. The estimates of haplotype frequencies are
Hypothesis tests: We can test two major hypotheses based on the log-likelihood function of Equation 1,
in the following sequence: (1) the association between whereas the estimates of diplotype genotypic means
two SNPs by testing their LD and (2) the difference of (and therefore the overall mean, haplotype additive,
a given haplotype from the rest of the haplotypes in its and dominant effects) and residual variance are based
effect on the disease outcome by testing the significance on the log-likelihood function of Equation 2. These two
of haplotype additive and dominant effects. The LD different types of parameters can be estimated using an
between two given SNPs can be tested using two alterna-integrative EM algorithm.
tive hypotheses:
In the E step, the expected number (i) and
probabil-ities (⌸i) of subjectiof a double-heterozygous genotype H0: D⫽0
who carries diplotype [A1
1A21][A12A22] are calculated by
H1: D⬆0. (15)
[11][22]i⫽
p11p22
p11p22⫹p12p21
(5) The log-likelihood-ratio test statistic (LR) for the
sig-nificance of LD is calculated by comparing the
likeli-hood values under H1 (full model) and H0 (reduced
⌸[11][22]i⫽
[11][22]if[11][22](yi)
[11][22]if[11][22](yi)⫹(1⫺ [11][22]i)f[12][21](yi)
. (6)
507 Sequencing Complex Diseases
LR1⫽ ⫺2[logL(p˜(1)1 ,p˜(2)1 ,D⫽0,⍀˜q|G)⫺logL(⍀ˆp,⍀ˆq|G)], erable computational load and, also, may not be
neces-sary for the explanation of disease variation. These two (16)
factors should be considered in a further study of the where the tilde and hat denote the maximum-likelihood
determination of a maximal number of SNPs for
se-estimates (MLEs) of unknown parameters under H0and
quencing mapping.
H1, respectively. The LR1is considered to asymptotically
follow a2distribution with 1 d.f. The MLEs of allelic
frequencies under H0can be estimated using the EM al- RESULTS
gorithm described above, but with the constraintp11p22⫽
Simulation: We performed Monte Carlo simulation
p12p21.
experiments to examine the statistical properties of the Diplotype or haplotype effects on a complex trait can
model proposed for association studies between varia-be tested using two alternative hypotheses expressed as
tion in DNA sequence and a complex trait. Our simula-tion studies were designed to consider the effects of
H0: a⫽ d⫽0
different heritability levels (H2⫽0.1vs.0.4), different
H1: at least one equality in H0 does not hold. (17) sample sizes (n⫽100vs.400), and different gene action
modes (additivevs.dominantvs.overdominant) on the
The log-likelihood-ratio test statistic (LR2) under these
two hypotheses can be similarly calculated. The LR2 estimation precision of parameters from our model.
The ratio of dominant (d) over additive effect (a) is
may asymptotically follow a 2 distribution with 2 d.f.
However, the approximation of a 2 distribution may used to determine the degree of dominant. A haplotype
is regarded as additive, dominant, or overdominant if be inappropriate when some regularity conditions, such
as normal and uncorrelated residuals, are violated. The this ratio is zero, one, and greater than one, respectively
(LynchandWalsh1998).
permutation test approach proposed by Churchill
andDoerge(1994), which does not rely upon the distri- Suppose two SNPs are segregating in a natural popula-tion at Hardy-Weinberg equilibrium. The allele
frequen-bution of the LR2, may be used to determine the critical
threshold for determining the existence of a QTL. cies and linkage disequilibrium between these two SNPs
are given in Table 2. We assume that one of the four R-SNP sequence model: The idea for sequencing a
complex trait is described for a two-SNP model. It is possible haplotypes for the two SNPs is different from
the rest of the haplotypes in their effects on the pheno-possible that the two-SNP model is too simple to
charac-terize genetic variants for quantitative variation. With type of a complex trait, which leads to three distinct
groups of diplotypes. By assigning the genetic values for the analytical line for the two-SNP sequencing model,
we can readily extend our model to include an arbitrary these two contrasting haplotypes under different gene
action modes (Table 2), we calculate the genotypic val-number of SNPs whose sequences are associated with
the phenotypic variation. ues for all possible diplotypes and further simulate their
phenotypic values on the basis of normal distribution.
ConsiderRSNPs that form 3Robservable multilocus
zygotic genotytpes, generally expressed asA1
k1A1l1/A2k2A2l2/ The residual variance is determined according to
differ-ent heritability levels (0.1vs.0.4) expressed as the
rela-. rela-. rela-. /AR
kRARlR. These genotypes are collapsed from a total
tive proportion of genetic variance to total observed
of 2R⫺1(2R ⫹ 1) diplotypes expressed as [A1
k1A2k2. . .ARkR]
variance. The genetic variance is determined on the [A1
l1A2l2. . .ARlR] (1 ⱕ k1 ⱕl1 ⱕ 2, . . . , 1ⱕkRⱕ lR ⱕ1).
basis of the genotypic values of all diplotypes and their A key issue for the multi-SNP sequencing model is how
to distinguish among 2r⫺1 different diplotypes for the frequencies.
Table 2 describes the results of parameter estimation
same genotype heterozygous atrloci. The relative
fre-quencies of these diplotypes can be expressed in terms from our simulation using the proposed model. In
gen-eral, all parameters (including population and quantita-of haplotype frequencies. The integrative EM algorithm
can be employed to estimate the MLEs of haplotype tive genetic) can be reasonably estimated. As expected,
the precision of population parameter estimation is a
frequencies. Lou et al. (2003) provided a general
for-mula for expressing haplotype frequencies in terms of function of sample size and does not rely on the H2
value or the gene action mode. Large sample sizes always allele frequencies and linkage disequilibria of different
orders. The MLEs of the latter can be obtained by solv- lead to more precise estimation of allelic frequencies
and linkage disequilibrium (Table 2). ing a system of equations.
In the multi-SNP sequencing model, we face many The estimation precision of quantitative parameters
is dependent on heritability level, sample size, and gene haplotypes and haplotype pairs. An Akaike information
criterion- or Bayes information criterion-based model action mode. In almost all situations, the additive effects
can be estimated better than the dominant effect. The
selection strategy (BurnhamandAndersson1998) has
been framed to determine the haplotype that is most estimation of additive and dominant effects responds
differently to genetic action mode, depending on the distinct from the rest of the haplotypes in explaining
quantitative variation. However, in practice, a simulta- degree of dominance. For example, given the same
heri-tabilityH2 ⫽ 0.1 and same sample size n ⫽ 100, the
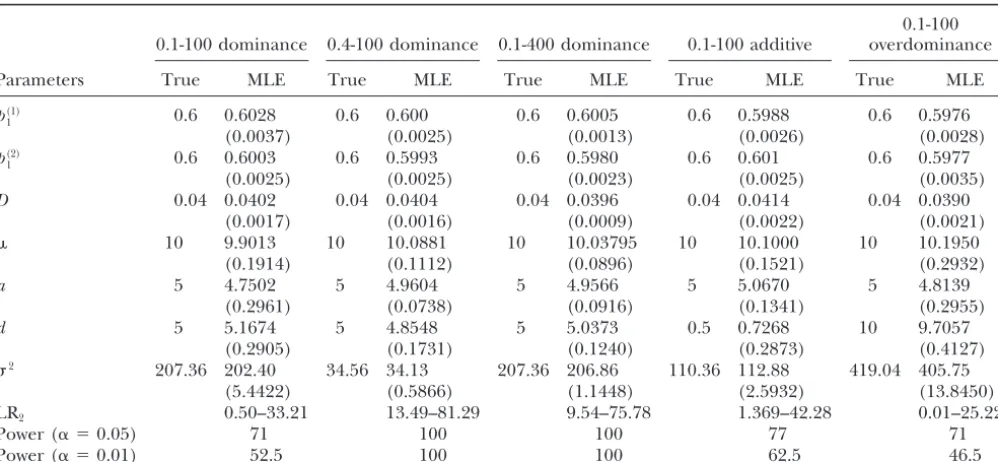
consid-TABLE 2
The MLEs and their square root mean square errors (in parentheses) of population and quantitative genetic parameters of DNA sequences associated with the phenotypic variation estimated from 200 simulation replicates under different
(heritability-sample size-gene action mode) combinations for the 2-SNP sequencing model
0.1-100 0.1-100 dominance 0.4-100 dominance 0.1-400 dominance 0.1-100 additive overdominance
Parameters True MLE True MLE True MLE True MLE True MLE
p(1)
1 0.6 0.6028 0.6 0.600 0.6 0.6005 0.6 0.5988 0.6 0.5976
(0.0037) (0.0025) (0.0013) (0.0026) (0.0028)
p(2)
1 0.6 0.6003 0.6 0.5993 0.6 0.5980 0.6 0.601 0.6 0.5977
(0.0025) (0.0025) (0.0023) (0.0025) (0.0035)
D 0.04 0.0402 0.04 0.0404 0.04 0.0396 0.04 0.0414 0.04 0.0390
(0.0017) (0.0016) (0.0009) (0.0022) (0.0021)
10 9.9013 10 10.0881 10 10.03795 10 10.1000 10 10.1950
(0.1914) (0.1112) (0.0896) (0.1521) (0.2932)
a 5 4.7502 5 4.9604 5 4.9566 5 5.0670 5 4.8139
(0.2961) (0.0738) (0.0916) (0.1341) (0.2955)
d 5 5.1674 5 4.8548 5 5.0373 0.5 0.7268 10 9.7057
(0.2905) (0.1731) (0.1240) (0.2873) (0.4127)
2 207.36 202.40 34.56 34.13 207.36 206.86 110.36 112.88 419.04 405.75
(5.4422) (0.5866) (1.1448) (2.5932) (13.8450)
LR2 0.50–33.21 13.49–81.29 9.54–75.78 1.369–42.28 0.01–25.22
Power (␣ ⫽0.05) 71 100 100 77 71
Power (␣ ⫽0.01) 52.5 100 100 62.5 46.5
p(1)
1 ,p(1)2 , andDare the allelic frequencies of allelesA(1)1 andA(1)2 at two SNPs and their linkage disequilibrium, respectively.
is the overall mean, andaanddare the additive and dominant effects, respectively, by assuming that haplotypeA(1)
1 A(1)2 is different
from the rest of haplotypes.2is the residual variance. LR
2is the test statistics for testing the genetic effect of SNP haplotypes.
“Power” is calculated as the percentages of all simulations that detect significant genetic effects.
sampling error of the additive effect estimation is in- the dominance effect is reduced compared to that from
the 2-SNP model. Second, the power to detect signifi-creased by 121% from additive to dominant modes, but
is stable from dominant to overdominant modes. These cant sequence variants and the estimation precision of
different genetic parameters from the 3-SNP model can two percentage values are 1 and 42% for the sampling
errors of the dominant effect estimation. It appears that be improved with increased heritability levels, increased
sample sizes, and decreased gene interactions. the additive effect estimation is more sensitive than the
dominant effect estimation to the changes of heritability A worked example:A real example from an obesity
study is used to demonstrate the usefulness of our and sample size.
We analyze the power to detect a significant diplotype model. Numerous genes have been investigated as
po-tential obesity-susceptibility genes (Mason et al.1999;
difference from our model under different
combina-tions of H2 value, sample size, and gene action mode Chagnonet al. 2003). The-2 adrenoceptor (BAR-2)
is a major lipolytic receptor in human fat cells, whose (Table 2). To do so, we first obtain empirical critical
threshold values for declaring the significance of diplo- function was found to be determined by known
poly-morphisms in codons 16 and 27 (Greenet al.1995). In
type difference through simulations. The thresholds at
the significance level ␣ ⫽ 0.05 or 0.01 are estimated a genetic study of obesity involving 149 women byLarge
et al.(1997), the Arg16Gly polymorphism at codon 16
as the 95th and 99th percentile for the simulated test
statistics calculated from simulated data involving no was found to be associated with altered BAR-2 function
with Gly16 carriers showing a fivefold increased agonist
diplotype difference over 1000 LR2values. It is clear that
increased H2 levels and increased sample sizes can in- sensitivity. The Gln27Glu polymorphism at codon 27 is
markedly associated with obesity traits. The homozygotes crease the power to detect diplotype differences. When
H2 ⫽0.4 orn⫽400, such power is 100% (Table 2). for Glu27 display an average fat mass excess of 20 kg and
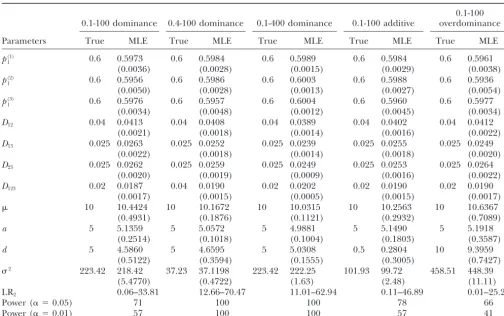
50% larger fat cells than controls. Although the Arg16Gly An additional simulation study was performed to
in-vestigate the statistical behavior of the multi-SNP se- polymorphism is not significantly associated with obesity
and the Gln27Glu polymorphism is not significantly quence model. The results from the 3-SNP sequence
model are summarized in Table 3. First, all genetic associated with the BAR-2 function, genetic variability
in these two sites of the human BAR-2 gene could be parameters can be reasonably estimated from the 3-SNP
509 Sequencing Complex Diseases
TABLE 3
The MLEs and their square root mean square errors (in parentheses) of population and quantitative genetic parameters of DNA sequences associated with the phenotypic variation estimated from 200 simulation replicates under different
(heritability-sample size-gene action mode) combinations for the 3-SNP sequencing model
0.1-100 0.1-100 dominance 0.4-100 dominance 0.1-400 dominance 0.1-100 additive overdominance
Parameters True MLE True MLE True MLE True MLE True MLE
p(1)
1 0.6 0.5973 0.6 0.5984 0.6 0.5989 0.6 0.5984 0.6 0.5961
(0.0036) (0.0028) (0.0015) (0.0029) (0.0038)
p(2)
1 0.6 0.5956 0.6 0.5986 0.6 0.6003 0.6 0.5988 0.6 0.5936
(0.0050) (0.0028) (0.0013) (0.0027) (0.0054)
p(3)
1 0.6 0.5976 0.6 0.5957 0.6 0.6004 0.6 0.5960 0.6 0.5977
(0.0034) (0.0048) (0.0012) (0.0045) (0.0034)
D12 0.04 0.0413 0.04 0.0408 0.04 0.0389 0.04 0.0402 0.04 0.0412
(0.0021) (0.0018) (0.0014) (0.0016) (0.0022)
D13 0.025 0.0263 0.025 0.0252 0.025 0.0239 0.025 0.0255 0.025 0.0249
(0.0022) (0.0018) (0.0014) (0.0018) (0.0020)
D23 0.025 0.0262 0.025 0.0259 0.025 0.0249 0.025 0.0253 0.025 0.0264
(0.0020) (0.0019) (0.0009) (0.0016) (0.0022)
D123 0.02 0.0187 0.04 0.0190 0.02 0.0202 0.02 0.0190 0.02 0.0190
(0.0017) (0.0015) (0.0005) (0.0015) (0.0017)
10 10.4424 10 10.1672 10 10.0315 10 10.2563 10 10.6367
(0.4931) (0.1876) (0.1121) (0.2932) (0.7089)
a 5 5.1359 5 5.0572 5 4.9881 5 5.1490 5 5.1918
(0.2514) (0.1018) (0.1004) (0.1803) (0.3587)
d 5 4.5860 5 4.6595 5 5.0308 0.5 0.2804 10 9.3959
(0.5122) (0.3594) (0.1555) (0.3005) (0.7427)
2 223.42 218.42 37.23 37.1198 223.42 222.25 101.93 99.72 458.51 448.39
(5.4770) (0.4722) (1.63) (2.48) (11.11)
LR2 0.06–33.81 12.66–70.47 11.01–62.94 0.11–46.89 0.01–25.22
Power (␣ ⫽0.05) 71 100 100 78 66
Power (␣ ⫽0.01) 57 100 100 57 41
See Table 2 for explanations of parameters.
and lipolytic BAR-2 function in adipose tissue, at least for allele G at codon 16 and 0.38 for allele G at codon
27, respectively, suggesting that both of them have fairly
in women (Large et al.1997).
To determine whether sequence variants at these two high heterozygosity.
Our model is based on the assumption that one haplo-polymorphisms of BAR-2 are associated with obesity
phenotypes, we investigated a group of 155 women of type is different from the rest of the haplotypes. In a
practical situation, as in our example used here, the ages 32 to 86 years old with a large variation in body
fat mass. Each of these patients was determined for her issue of how these haplotypes differ in their effects is not
known. By assuming that any one haplotype is different genotypes at codon 16 with two alleles, Arg16 (A) and
Gly16 (G), and at codon 27 with two alleles, Gln27 (C) from the rest of the haplotypes, we can find a
best-difference pattern that is based on the estimates of the and Glu27 (G), within the BAR-2 gene and measured
for body mass index (BMI). These two SNPs form four LR2’s using Equation 16. When haplotype GG, GC, AG,
or AC is assumed to differ in BMI from the other haplo-haplotypes designated as AC, AG, GC, and GG, which
lead to nine genotypes, AA/CC, AA/CG, AA/GG, AG/ types, the LR2values were estimated as 10.35, 3.11, 1.52,
and 2.32, respectively. Obviously, haplotype GG is con-CC, AG/CG, AG/GG, GG/con-CC, GG/CG, and GG/GG, and
the 10 corresponding diplotypes, [AC][AC], [AC][AG], sidered as a reference haplotype that has an effect on
BMI in a comparison with the other haplotypes. The [AG][AG], [AC][GC], and [AC][GG] or [AG][GC],
[AG][GG], [GC][GC], [GC][GG] and [GG][GG]. Our difference between haplotype GG and the rest of the
haplotypes can significantly explain some variation in model is used to associate diplotype differences with
variation in BMI. The MLEs of the haplotype frequen- BMI. The resultant LR2 for testing the association
be-tween DNA sequence and BMI phenotype (10.35) is cies, allele frequencies, and linkage disequilibrium
be-tween the two SNPs were obtained (Table 4). These two well beyond the critical threshold value at the
signifi-cance level of 1% (6.07) estimated from 1000 simulation SNPs are highly associated with each other, whose LD
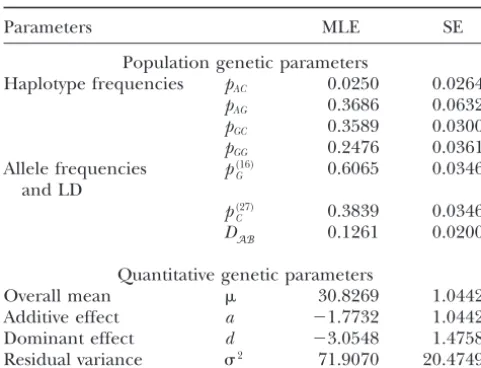
TABLE 4 viduals differ at a single DNA base. Sets of nearby SNPs on the same chromosome are inherited in blocks. Blocks
The maximum-likelihood estimates (MLEs) and their standard
may contain a large number of SNPs, but a few SNPs
errors (SEs) of population and quantitative genetic
are enough to uniquely identify the haplotypes in a
parameters for DNA sequences associated with
phenotypic variation in BMI for 155 patients block (Gabrielet al. 2002). The HapMap is a map of these haplotype blocks constructed by tag SNPs, those
Parameters MLE SE that explain most of haplotype diversity. The HapMap
should be valuable by reducing the number of SNPs
Population genetic parameters
required to examine the entire genome for association
Haplotype frequencies pAC 0.0250 0.0264
with a phenotype from the 10 million SNPs that exist
pAG 0.3686 0.0632
pGC 0.3589 0.0300 to ⵑ500,000 tag SNPs. This will make genome scan pGG 0.2476 0.0361 approaches to finding regions with genes that affect Allele frequencies p(16)
G 0.6065 0.0346 diseases much more efficient and comprehensive, since
and LD effort will not be wasted typing more SNPs than
neces-p(27)
C 0.3839 0.0346 sary and all regions of the genome can be included.
DAB 0.1261 0.0200
Our model is founded on the discovery of tag SNPs in the genome, thus allowing for a fast scan for the
Quantitative genetic parameters
Overall mean 30.8269 1.0442 association between variation in DNA sequence and
Additive effect a ⫺1.7732 1.0442 traits. This model has three advantages. First, it can
Dominant effect d ⫺3.0548 1.4758 materialize the genetic basis for quantitative variation
Residual variance 2 71.9070 20.4749
by directly characterizing specific DNA sequences pre-disposing to a certain disease. The traditional statistical models for genetic mapping attempt to postulate the
dominant effects. Patients with homozygous genotype position of hypothesized QTL that are linked with
GG/GG have significantly lower BMI than those with known markers genotyped from the genome (Lander
homozygous genotype AA/CC, as indicated by a large andBotstein1989;Louet al.2003). The QTL detected
additive effect (a ⫽ ⫺1.77). For double-heterozygote from these models are regarded as “hypothesized”
be-AG/GC, diplotype [GG][AC] reduces BMI by 3.05 (the cause it is not possible to know their DNA sequences
dominant effect) compared to diplotype [AG][GC]. and, therefore, physiological function. As opposed to
The difference between haplotype GG and the rest of the traditional “indirect” approach, our model presents
the haplotypes can explain 6.3% of the observed varia- a “direct” approach. At present, the utility of the direct
tion in BMI. We estimate the standard errors of the approach is limited to sequencing the functional parts
MLEs of the population and quantitative genetic param- of candidate genes with known biochemical or
physio-eters on the basis ofLouis’s (1982) observed informa- logical function. With the release of HapMap, our model
tion matrix, suggesting that all MLEs have reasonable will make the direct approach more useful and more
estimation precision although the estimates of quantita- efficient in searching for causal variants throughout the
tive genetic parameters are not as precise as those of whole genome. Our model is also different from
tradi-population genetic parameters due to a small sample tional association studies (e.g.,Zaykinet al.2002) whose
size used (see the simulation result in Tables 2 and 3). aims are the significance test for the association between
haplotypes and phenotypes (mostly discrete traits) rather than the precise estimation of haplotype effects. Second,
DISCUSSION
our model is statistically simple and computationally fast. The most difficult part for the estimation from The elucidation of the entire human genome using
SNPs will make it possible to develop a haplotype map our model is to construct diplotype configurations for
heterozygous genotypes at two or more SNPs. The esti-of the human genome. Although such a HapMap has
been recently available due to international collabora- mation of population genetic parameters is based on a
multinomial-likelihood function of the observed
geno-tions (International HapMap Consortium 2003),
there is a serious lack of powerful statistical tools for type data, whereas the estimation of quantitative genetic
parameters is based on a mixture-based likelihood func-specific utility of this expensive HapMap to detect genes
and genetic variations that affect health and disease. tion including different diplotypes. These two likelihood
functions can be easily integrated to a unified estimation Such a statistical model has been developed and
pre-sented in this article. The idea behind our statistical framework implemented with the EM algorithm.
Finally, our model is flexible to different genetic and modeling is that differences between SNP-constructed
haplotypes may be associated with differing susceptibil- experimental settings. The results from a simulation study
indicate that the association between DNA sequence
ity to disease (International HapMap Consortium
2003). and phenotype can be well detected when the trait has
indi-511 Sequencing Complex Diseases
Perusse et al., 2003 The human obesity gene map: the 2002
(100) is used. Our model can also obtain fairly precise
update. Obes. Res.11:313–367.
estimation of parameters when diplotypes display over- Churchill, G. A., and R. W. Doerge, 1994 Empirical threshold
values for quantitative trait mapping. Genetics138:963–971.
dominance in the situation with modest heritability and
Dawson, E., G. R. Abecasis, S. Bumpstead, Y. Chen, S. Huntet al.,
sample size. The specific utility of our model to a real 2002 A first-generation linkage disequilibrium map of human
example from an obesity study leads to the successful chromosome 22. Nature418:544–548.
Dempster, A. P., N. M. LairdandD. B. Rubin, 1977 Maximum
detection of a DNA sequence (haplotype) at codons
likelihood from incomplete data via EM algorithm. J. R. Stat.
16 and 27 genotyped within the2AR candidate gene Soc. Ser. B39:1–38.
(Chagnonet al.2003) for its significant impact on hu- Evans, W. E., andH. L. McLeod, 2003 Pharmacogenomics drug disposition, drug targets, and side effects. N. Engl. J. Med.348:
man obesity. This haplotype, composed of the Gly16
538–549.
form of codon 16 and the Gln27 form of codon 27, Frary, A., T. C. Nesbitt, S. Grandillo, E. Knaap, B. Conget al.,
2000 fw2.2: a quantitative trait locus key to the evolution of
tends to reduce BMI when it is combined with itself or
tomato fruit size. Science289:85–88.
any other haplotypes and accounts forⵑ6% of the total
Gabriel, S. B., S. F. Schaffner, H. Nguyen, J. M. Moore, J. Roy
observed variation in BMI for 155 patient samples. et al., 2002 The structure of haplotype blocks in the human
genome. Science296:2225–2229.
Although our simulation and example were based on
Green, S. A., J. Turki, I. P. HallandS. B. Liggett, 1995
Implica-2- or 3-SNP analyses, our sequencing model has been tions of genetic variability of human 2-adrenergic receptor
struc-developed to allow for the detection of sequence vari- ture. Pulm. Pharmacol.8:1–10.
International HapMap Consortium, 2003 The international
ants involving any number of SNPs within a haplotype
HapMap project. Nature426:789–794.
block. In addition to its use in studying genetic associations Judson, R., J. C. StephensandA. Windemuth, 2000 The predictive
power of haplotypes in clinical response. Pharmacogenomics
with disease, our sequencing model can be extended to
1:5–16.
study the genetic factors contributing to variation in
re-Lander, E. S., andD. Botstein, 1989 Mapping Mendelian factors
sponse to environmental factors, in susceptibility to infec- underlying quantitative traits using RELP linkage maps. Genetics
121:185–199.
tion, and in the effectiveness of and adverse responses
Large, V., L. Hellstrom, S. Reynisdottir, F. Lonnqvist, P.
Eriks-to drugs and vaccines (EvansandMcLeod2003;Wein- son et al., 1997 Human beta-2 adrenoceptor gene
polymor-shilboum2003). It can also be modified to estimate the phisms are highly frequent in obesity and associate with altered adipocyte beta-2 adrenoceptor function. J. Clin. Invest. 100:
effects of sequence-sequence interaction on a complex
3005–3013.
trait. It is possible that a haplotype within a candidate Lou, X.-Y., G. Casella, R. C. Littell, M. K. C. Yang andR. L.
Wu, 2003 A haplotype-based algorithm for multilocus linkage
gene interacts with haplotypes from other candidate
disequilibrium mapping of quantitative trait loci with epistasis in
genes. The characterization of specific DNA sequence
natural populations. Genetics163:1533–1548.
variants for diseases should allow the development of Louis, T. A., 1982 Finding the observed information matrix when
using the EM algorithm. J. R. Stat. Soc. Ser. B44:226–233.
tests to predict which drugs or vaccines would be most
Lynch, M., andB. Walsh, 1998 Genetics and Analysis of Quantitative
effective in individuals with particular genotypes for Traits. Sinauer, Sunderland, MA.
genes affecting drug metabolism. Mackay, T. F. C., 2001 The genetic architecture of quantitative
traits. Annu. Rev. Genet.35:303–339.
We thank two anonymous referees for their constructive comments Mason, D. A., J. D. Moore, S. A. GreenandS. B. Liggett, 1999 on this manuscript. This work is supported by an Outstanding Young A gain-of-function polymorphism in a G-protein coupling domain Investigator Award of the National Natural Science Foundation of of the human 1-adrenergic receptor. J. Biol. Chem. 274:
12670–12674. China (30128017), a University of Florida Research Opportunity Fund
Patil, N., A. J. Berno, D. A. Hinds, W. A. Barrett, J. M. Doshi (02050259), and a University of South Florida biodefense grant
et al., 2001 Blocks of limited haplotype diversity revealed by (7222061-12) to R.W. The publication of this manuscript was approved
high-resolution scanning of human chromosome 21. Science as journal series no. R-10063 by the Florida Agricultural Experiment 294:1719–1723.
Station. Weinshilboum, R., 2003 Inheritance and drug response. N. Engl. J. Med.348:529–537.
Wu, R. L., andG. Casella, 2005 Statistical Genomics: A Quantitative Trait Loci Perspective. Springer, New York.
Wu, R. L., C.-X. MaandG. Casella, 2002 Joint linkage and linkage
LITERATURE CITED disequilibrium mapping of quantitative trait loci in natural popu-lations. Genetics160:779–792.
Bader, J. S., 2001 The relative power of SNPs and haplotype as Zaykin, D. V., P. H. Westfall, S. S. Young, M. A. Karnoub, M. J. genetic markers for association tests. Pharmacogenomics2:11–24. Wagneret al., 2002 Testing association of statistically inferred Burnham, K. P., andD. R. Andersson, 1998 Model Selection and haplotypes with discrete and continuous traits in samples of
unre-Inference. A Practical Information-Theoretic Approach. Springer, New lated individuals. Hum. Hered.53:79–91. York.