DOI: 10.1534/genetics.108.094359
The Temporal Program of Chromosome Replication: Genomewide
Replication in
clb5
D
Saccharomyces cerevisiae
Heather J. McCune,*
,1Laura S. Danielson,*
,2Gina M. Alvino,* David Collingwood,
†Jeffrey J. Delrow,
‡Walton L. Fangman,* Bonita J. Brewer*
and M. K. Raghuraman*
,3*Department of Genome Sciences and†Department of Mathematics, University of Washington, Seattle, Washington 98195 and ‡Department of Genomic Resources, Fred Hutchinson Cancer Research Center, Seattle, Washington 98109
Manuscript received July 23, 2008 Accepted for publication October 1, 2008
ABSTRACT
Temporal regulation of origin activation is widely thought to explain the pattern of early- and late-replicating domains in the Saccharomyces cerevisiae genome. Recently, single-molecule analysis of replication suggested that stochastic processes acting on origins with different probabilities of activation could generate the observed kinetics of replication without requiring an underlying temporal order. To distinguish between these possibilities, we examined aclb5Dstrain, where origin firing is largely limited to the first half of S phase, to ask whether all origins nonspecifically show decreased firing (as expected for disordered firing) or if only some origins (‘‘late’’ origins) are affected. Approximately half the origins in the mutant genome show delayed replication while the remainder replicate largely on time. The delayed regions can encompass hundreds of kilobases and generally correspond to regions that replicate late in wild-type cells. Kinetic analysis of replication in wild-type cells reveals broad windows of origin firing for both early and late origins. Our results are consistent with a temporal model in which origins can show some heterogeneity in both time and probability of origin firing, but clustering of temporally like origins nevertheless yields a genome that is organized into blocks showing different replication times.
D
NA replication in eukaryotic cells is a complex enterprise that appears to be optimized for any-thing but speed. Although each chromosome has mul-tiple origins that are capable of supporting replication initiation, the number of origins that actually initiate DNA synthesis (‘‘fire’’) varies. Some origins are effi-cient, firing in virtually every cell in a population, while others are inefficient, firing in only a subpopulation of cells. Thus, the potential density of active origins is greater than the actual density. Furthermore, those origins that fire appear not to do so simultaneously. A few, well-characterized origins have been shown to fire later in S phase (Fergusonet al.1991; Friedmanet al.1997; Yamashitaet al.1997). Therefore, the density of
origins, their efficiencies of activation, the times at which they fire, and the relative rates at which forks move should determine how long it takes to fully rep-licate a eukaryotic genome and the order in which it is replicated.
Recent analysis of Saccharomyces cerevisiae chromo-some VI replication by in vivo labeling and
single-molecule analysis by DNA combing (Czajkowskyet al.
2008) suggested that there is no obligate order of origin firing along any single chromosomal DNA molecule and that the observed temporal pattern of replication for a population of molecules could be explained largely by variable probabilities of origin firing without the need to invoke temporal staggering of initiations at different origins. A similar suggestion has been made regarding origin firing in fission yeast and metazoans (Rhind
2006). DNA fiber images are compelling, but their analysis is not entirely straightforward, requiring large sample sizes and different pulse/chase regimens to capture the complexity of the population. Nevertheless, they do raise questions about the conclusions of pre-vious work, which all pointed to the existence of a temporal firing pattern. In fact, the results of some previous studies could be interpreted either way—as a temporal firing pattern or as population aggregates of origins with different efficiencies. For example, map-ping of single-stranded DNA (ssDNA) after hydroxyurea treatment identified origins that are either unchecked or checked by the checkpoint protein Rad53p (Feng
et al.2006) largely along the lines of what previously had been classified as early- vs. late-replicating origins, respectively. However, the relative abundance of ssDNA at different origins matched more closely with origin efficiency than with replication time for the few origins for which efficiency had been measured.
1Present address:Cord Blood Registry, San Bruno, CA 94066.
2Present address:Sackler Institute of Graduate Biomedical Sciences, New
York University, New York, NY 10016.
3Corresponding author: University of Washington, Department of
Genome Sciences, Box 355065, S041E Foege Bldg., Seattle, WA 98195. E-mail: [email protected]
We started by considering the two extreme possibil-ities: (1) that, as proposed forSchizosaccharomyces pombe (Patel et al. 2006), origin firing time is essentially
random, with the more efficient origins in the genome firing in a larger proportion of cells and therefore on average replicating earlier in S phase, and (2) that origins are programmed to fire at different times in S phase, with efficient firing potentially being the prop-erty of any temporal class of origins. One way to distinguish between these extreme possibilities is to use mutations that affect the temporal availability of an initiation factor. For example, in a mutant where origin initiations can occur only early in S phase, the temporal activation model predicts that origins that normally fire in the first half of S phase should fire normally, while origins programmed to fire late in S phase would be unable to fire and therefore be replicated passively from forks from the earlier-activated origins (Figure 1A, top). The predicted mutant phenotype, in this model, is that some origins should show normal activation and normal kinetics of replication, while other origins should show reduced activation and delayed replication (Figure 1, B and C, top). In contrast, the stochastic, disordered firing model (Figure 1A, bottom) predicts that if initiations in the mutant could occur only in the first half of S phase, then with no set firing time, the observed efficiency of all origins would be reduced (due to passive replication across these origins in the second half of S phase), and replication kinetics would be slowed across the genome (Figure 1, B and C, bottom).
One such mutant is clb5D. The CLB5 gene product is one of nine yeast cyclins that activate and regulate the cyclin-dependent kinase CDK (Cdk1p, CDC28)
(Mendenhall and Hodge 1998). During a normal
S phase, CDK activated by Clb5p or a second, short-lived, cyclin Clb6p, stimulates origin firing (Mendenhalland
Hodge1998; Jacksonet al.2006). WhenCLB6is absent,
S phase proceeds with no apparent defect, indicating that Clb5p-CDK alone is sufficient to direct a normal round of replication (Schwoband Nasmyth1993). In
the absence ofCLB5, however, S phase is substantially longer than in wild-type cells (Epsteinand Cross1992;
Ku¨ hneand Linder1993; Schwoband Nasmyth1993;
Donaldsonet al.1998b), indicating that Clb6p-CDK on
its own cannot fully substitute for Clb5p-CDK.
We showed previously that cells lackingCLB5suffer a significant decrease in the firing efficiency of some origins. Among the handful of origins tested, the defect appeared greatest for those that had been classified as late-S activated (Donaldson et al. 1998b), consistent
with the expectation for the temporal program model. However, left open were the possibilities that some origins cannot be activated by Clb6p or that some of the activation seen in theclb5Dmutant could be ascribed to the other B-type cyclins, such as Clb3p or Clb4p. Furthermore, the two-dimensional (2-D) gel analysis did not address whether initiation at ‘‘early’’ origins in
the mutant proceeded with quantitatively normal kinet-ics, a key discriminator between the temporal program model and the disordered firing model.
Here, we have extended the 2-D gel analysis by examining origin firing in synchronous S-phase cultures of wild-type and clb5Dstrains and have examined the genomewide kinetics of replication in the two strains. We find that multiple zones, together composing over half of the genome, suffer significant delays in replica-tion in aclb5Dmutant, while the remainder of the ge-nome is largely unaffected, consistent with the temporal program model and not consistent with the simplest interpretation of the disordered firing model. CLB5 -dependent regions (CDRs) occur on all chromosomes and in blocks up to hundreds of kilobases in size. In general, CDRs correspond to regions of the genome that on average replicate late in S phase (Raghuraman
et al.2001; Alvinoet al.2007). Introduction of a stable
version of Clb6p ( Jackson et al. 2006) advanced the
replication timing of CDRs and restored a temporal pattern of replication that is indistinguishable from wild type, confirming that Clb5p and Clb6p are equally capable of directing CDK to the correct targets and validating the premise underlying our test of the models. Our results best support a model in which each origin has a distribution of firing times centered about a mean that reflects the time of maximum probability of its activation. Mean firing times range from early to late S, but because origins have overlapping temporal distributions of initiation, this model would preclude an obligate order of firing. Nevertheless, clustering of origins with approximately similar times of activation leads to a genomic organization into temporal blocks of early and late replication.
MATERIALS AND METHODS
Strains used: All strains are derivatives of A364a. BB14-3a (MATa bar1 ura3-52 trp1-289 leu2-3,112 his6) is a CDC7 de-rivative of RM14-3a (Donaldsonet al.1998a; McCarrolland Fangman1988). HM14-3a (wild type) is aURA3derivative of BB14-3a. The clb5D mutant strain is described elsewhere (Donaldsonet al.1998a). CW1 (CLB5 CLB6-HA), CW2 (clb5D CLB6-HA), and LD3 (clb5Dclb6D100-HA) were derived from HM14-3a or the isogenicclb5Dmutant strain by integration of the modifiedCLB6alleles at the nativeCLB6locus. The HA tags were derived from pFA6a-3HA-TRP1 (Longtineet al.1998). All cultures were grown at 30°. GA14-3a (MATabar1 cdc7-1 trp1-289 leu2-3,112 his6 r0) was produced by culturing KK14-3a (Raghuraman et al. 2001) in the presence of ethidium bromide (G. Alvino, B. Brewer and M. K. Raghuraman, unpublished results) and was grown at 23°.
isotope transfer experiments as described elsewhere (Brewer and Fangman1987; Hubermanet al.1987; Roseand Winston 1990). The DNA was digested withEcoRI and fractionated in CsCl density gradients. The fractions were slot blotted and probed with the BB14-3a (r1) or GA14-3a (r0) genomic DNA probe to identify fractions containing DNA and to determine the proportions of heavy-heavy (HH) and heavy-light (HL) DNA in each pooled sample.
Microarray production and analysis:All microarrays display the collection ofS. cerevisiaeopen reading frames (ORFs). The discrete timed samples were hybridized to Agilent yeast oligo microarrays (‘‘Agilent arrays’’) at the University of Washington Center for Expression Arrays according to the manufacturer’s specifications. The pooled S-phase samples were hybridized to microarrays from the Fred Hutchinson Cancer Research Center DNA Array Lab (‘‘FHCRC arrays’’; GEO platform acces-sion no. GPL1914, http://www.ncbi.nlm.nih.gov/projects/geo/ query/acc.cgi?acc¼GPL1914). Production, scanning, and anal-ysis procedures for those arrays are described elsewhere (Fazzio et al.2001).
Microarray target DNA preparation, labeling, and micro-array hybridization scheme: Microarray target DNA was obtained by isolating HH and HL DNA from CsCl gradients. For the pooled experiments, ‘‘single-copy’’ DNA standards were isolated froma-factor-arrested G1cells of the appropri-ate strain in a similar manner. The target DNA (HH, HL, or single copy; 1–2.5mg) was concentrated by ethanol precip-itation and labeled for hybridization to microarrays essen-tially as described elsewhere (http://cmgm.stanford.edu/ pbrown/protocols/4_genomic.html), using 15mg of random hexamers as primers and 50 units Klenow fragment (39/59
exo; New England Biolabs, Beverly, MA). When labeling was complete (2–4 hr at 37°), the reactions were mixed with 60 mg tRNA and purified on 1-ml Sephadex G50 columns equilibrated with 10 mm Tris-HCl pH 8.0, 1 mm EDTA. Following purification, targets were combined for hybridiza-tion, mixed with 20mg poly(dA)–poly(dT), and ethanol pre-cipitated. For hybridizations to the FHCRC arrays the labeled DNA targets were resuspended in 26 ml 33 SSC (45 mm Na-citrate, 450 mmNaCl) and SDS was added to 0.3% prior to hybridization. For hybridizations to the Agilent arrays,
sam-ples were prepared and hybridized according to the manufac-turer’s specifications.
For both the wild-type and theclb5Dmutant strain, HH and HL DNA from the pooled S-phase collections were labeled separately with Cy3-dUTP (Amersham Biosciences, Piscataway, NJ), combined with the single-copy DNA standard (labeled with Cy5-dUTP), and hybridized to separate microarrays. The two microarrays (HH plus standard and HL plus standard) compose one hybridization set. ‘‘Reciprocal’’ hybridization sets, in which HH and HL DNAs were labeled with Cy5-dUTP and the standard was labeled with Cy3-dUTP, were also produced. The two hybridization sets for each strain constitute one data series. Series A contains wild-type andclb5Ddata from dense isotope transfer A, and series B contains data from transfer B. For the analyses of discrete timed samples from KK14-3a and the HA-tagged strains (CW1, CW2, and LD3), HH and HL DNAs were differentially labeled with Cy5-dUTP and Cy3-dUTP and hybridized to the same microarray. Reciprocal hybridizations were performed here as well.
Microarray data collection and normalization:Microarray data were extracted from the FHCRC arrays with GenePix 4.0 software (Axon Instruments, Foster City, CA). ORFs were excluded from further analysis if the DNA standard signals were not three times above background or if they differed significantly within a hybridization set. In addition, a set of 140 repetitive ORFs (supplemental Table 1) was excluded from further anal-ysis to avoid spurious results due to cross-hybridization. The microarray signals were also locally normalized by SNOMAD (Colantuoniet al. 2002). Hybridization data were extracted from the Agilent arrays according to standard procedures.
For all experiments, global normalization was applied to correct for the number of cells that actually underwent replication in the analyzed cultures (determined from either the maximum percentage of small- and medium-budded cells or the maximum percentage of replication achieved by the culture) and for the relative amounts of total HH and HL DNA within the pooled samples (Alvinoet al.2007).
sample experiments) for each ORF were used to find the per-centage of replication values:
%replication¼ ðHL30:5Þ ðHL30:5Þ1HH
3100:
Each value was plotted to the center of the corresponding ORF and values for the intervening regions were determined at 1-kb intervals by linear interpolation. The interpolated values were averaged over a 12-kb sliding window (moving in 1-kb incre-ments) and used as a target for Fourier convolution smoothing (Raghuramanet al.2001).
Comparison of wild-type and clb5D replication profiles from pooled samples:The variation in percentage of replica-tion between pooled wild-type andclb5Dreplication profiles was determined from the absolute difference in average percentage of replication between the two strains at 1-kb intervals. The wild-type vs. clb5D difference value for each coordinate i was converted to units of standard deviation (Zscores), using
Zi¼
xims ss
;
where xi is the difference value for coordinate i, ms is the average difference in percentage of replication overall for the same-strain comparisons (ms¼1.327, obtained by taking the same-strain absolute difference at each coordinate and then computing the mean of these same-strain difference values), andss is the same-strain standard deviation (ss ¼
0.6604). Standard Q-Q plots were used to confirm normality for the distribution of same-strain comparison difference values. On the basis of an estimated false discovery rate of 0.005 (Benjamini and Hochberg 1995), the threshold for significance was set atZ¼4.886. Coordinates were deemed inconclusive if the same-strain comparisons yieldedZscores greater than the threshold. Of the remaining coordinates, those where the wild-type toclb5Dcomparisons yielded Z$ 4.886 were designated as CDRs and those withZ,4.886 as ‘‘non-CDR.’’ CDR loci were ranked as categories 1, 2, or 3 (Z scores of 4.886–9.15, 9.15–16.335, and.16.335, respectively). Characterization of origins from microarray profiles at intervals through S phase: We compared each wild-type replication profile to a background profile produced by hybridizing the ‘‘light’’ shoulder of the peak of unsubstituted genomic DNA purified from a CsCl gradient, which identifies DNA fragments that contaminate the HL region of the density transfer gradients because of higher A1T content or small size, or both (Alvinoet al.2007). We determined the standard deviation for the background profile and used it to assess the significance of each local maximum in the S-phase samples. An origin is considered to be active if it produces a local maximum (in all replicates for any of the S-phase samples) that is six standard deviations above the background sample and three standard deviations above the adjacent minima. While such stringent criteria allow us to remove spurious peaks that arise from genomic fragments with unusually high A1T content, they also likely exclude some inefficient origins in the genome. In a few cases the distance between two adjacent origins prevented either origin from scoring as a significant maximum because the minimum between them was high, yet it was clear from the surrounding region that one or the other (or both) of these origins was active. These origins were included if the minima flanking the two origins were 3 standard deviations below the average maxima of the two origins. Two hundred origins were identified by these criteria. A subset of 64 origins was analyzed for their initiation time and efficiency. To reduce the contribution of passive
replica-tion, only origins that were.50 kb from their flanking origins were included. At each sampling interval the percentage of replication at the two flanking local minima was averaged and subtracted from the percentage of replication of the maxima (origin). This value is then compared to the value for the previous sample time (or the background control in the case of the 10-min S-phase sample) to determine the change in origin activation across S phase.
2-D agarose gel electrophoresis:For asynchronous samples, cells were harvested from early-log-phase cultures. For syn-chronous samples, cells were grown to early-log phase, arrested witha-factor, and released into S phase for collection of timed samples. DNA was prepared as described previously (Hubermanet al.1987; Breweret al.1992). First-dimension gels (0.4% agarose) were run for 20–22 hr and second-dimension gels (1–1.1% agarose) were run for 4.5 hr at 4°
in the presence of ethidium bromide (Friedmanet al.1995). The fragments analyzed are ARS501 [chromosome (chr.) V, 547,714–550,909],ARS607(chr. VI, 196,963–201,291),ARS1413 (chr. XIV, 248,983–252,999), ARS1414 (chr. XIV, 277,747– 281,720),ADE2 ARS(chr. XV, 562,300–567,264), andARS1502 (chr. XV, 599,062–603,953).
Flow cytometry: Cell samples for 2-D gel analysis were assayed for cell-cycle progression by bud emergence and DNA content (by flow cytometry). Preparation of samples for flow cytometry was performed as described previously (Nashet al. 1988) with some modification. Each sample was pelleted, resuspended in sterile water for sonication, and fixed over-night at 4°in 70% ethanol. Fixed cells were washed once in 50 mm sodium citrate (pH 7.4), resuspended in sodium citrate, and treated with 0.25 mg/ml RNAase A for 1 hr at 50°or 55°. Samples were further treated with proteinase K (1 mg/ml) for an additional hour at 50°or 55°. The cells were then pelleted and resuspended to appropriate concentrations in SYTOX Green stain (Molecular Probes, Eugene, OR) in the sodium citrate solution. Flow cytometry was performed on a BD FACScan using CellQuest software (BD Biosciences).
Western blot analysis: Total protein was extracted from asynchronous and timed, synchronous samples as described previously (Koninget al.2002). SDS–PAGE and electrotrans-fer were performed according to standard methods. HA-tagged proteins were identified using a mouse anti-HA primary antibody (CRP), an HRP-conjugated goat anti-mouse secondary antibody (Amersham), and the ECL detection system (Amersham).
Statistical analysis: Unpaired t-test and ANOVA analyses were performed using commercial software packages (Kalei-daGraph v3.6, Synergy Software, Wolfram Research Mathema-tica v5.2, or Microsoft Excel).
RESULTS
in efficiency (Donaldsonet al.1998b) but those studies
had been performed on asynchronous populations of cells, leaving open the possibility that at least some origin activation was stimulated by later-appearing Clbs such as Clb3p or Clb4p. Therefore, we collected cells from synchronous cultures at discrete times following release from G1-phase arrest and used 2-D gel electrophoresis to
compare origin firing in wild-type andclb5Dcells. In wild-type cells,ARS607, previously classified as early firing, produced bubble-shaped intermediates 10 min earlier than the late-origin ARS1502 (Figure 2). This same 10-min lag is seen in clb5D, but with a notable decrease in the proportion of bubble structures at ARS1502but not atARS607(compare 30-minCLB5and clb5Dsamples; Figure 2, A and B). Similar results were
observed for origins ARS1413,ARS1414,and theADE2 ARS, all previously classified as late (data not shown). These observations confirmed in a qualitative sense that early and late origins respond differently to the lack of Clb5p as predicted by the temporal program model. However, we could not rule out the possibility that there was a change in the efficiency of some early origins as well. To ask if these observations held true genomewide and to obtain a statistically robust measure of changes in replication kinetics, we employed microarray-based anal-ysis of genome replication in wild-type andclb5Dcells.
Deducing replication kinetics from pooled S-phase samples: Replication kinetics of individual restriction fragments can be assessed using a modification of the Meselson/Stahl experiment (Figure 3A; McCarroll
and Fangman1988). In this technique, cells are grown
for at least seven generations in ‘‘heavy’’ medium con-taining13C and15N to label both DNA strands with the
heavy isotopes (HH). The cells are arrested witha-factor in G1and then transferred to light medium (containing
standard isotopes). After release froma-factor, replica-tion generates DNA that is hybrid in density with one heavy strand and one light strand (HL). A single S phase can be examined by creating a ‘‘pool’’ of cells from samples collected throughout S phase (Figure 3A). Hybridization to microarrays of HH and HL DNA from such pooled samples produces a single replication profile that, for each strain, displays the relative repli-cation timing for all loci (Raghuraman et al. 2001),
greatly simplifying comparisons between strains and allowing rigorous statistical tests for differences.
We created pools of S-phase cells from two density transfer experiments (called ‘‘transfer A’’ and ‘‘transfer B’’), including in these pools cell samples that were collected during the interval starting when wild-type genomic DNA replication was 10% complete and ending when it was 80% complete. Within the pool, the earliest-replicating fragments are expected to be mostly hybrid in density (HL) and thus have a very high cumulative ratio of HL:HH DNA. In contrast, the latest-replicating fragments are expected to be mostly HH in density and have a very low ratio of HL:HH DNA (Figure 3A). Fragments that on average replicate at intermedi-ate times in S phase should have density ratios between these two extremes and in proportion to their actual average times of replication. Thus, for each probed locus across the genome, the relative amounts of HH and HL DNA within the pool are expected to reveal the relative time at which the locus replicates during S phase. The higher the percentage of replication value of a locus, the earlier it replicates on average during S phase (Raghuramanet al.2001). It is important to note
that these experiments measure replication time, not firing time—an origin that fires early in S phase but fires only in a few cells in the population could show a population-average later time of replication that pri-marily reflects its passive replication.
We hybridized the pooled samples to microarray slides printed with .6000 yeast ORF probes (FHCRC arrays; see materials and methods). To control for
slide-to-slide variation we labeled both the HH and the HL DNAs from the pooled sample with the same fluorophore (Figure 3B) and hybridized them to
sep-arate arrays along with equal amounts of a single-copy DNA standard isolated from G1-arrested cells (labeled
for nodes spaced at 1-kb intervals and used a Fou-rier convolution smoothing (FCS)-based algorithm
(Raghuraman et al. 2001) to minimize experimental
‘‘noise’’ and return a finalized percentage of replication value for each node across the genome (Figure 3C; see supplemental data 1). Data from the endmost 12 kb of each chromosome were excluded to avoid arti-facts introduced by the smoothing process (Fenget al.
2006).
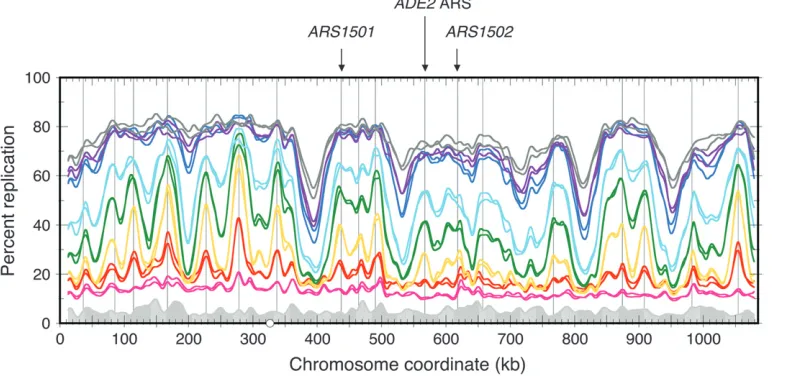
Repeating the hybridizations for both experiments gave us a total of four profiles to compare (Figure 3C and supplemental Figure 2; gray and black profiles). Qualitatively, the four profiles show that the microarray data are very reproducible between hybridizations and experiments for wild-type cells. To validate our pooling technique we compared the average profile from our four replication profiles of wild-type cells to those of Raghuraman et al. (2001) and Yabuki et al. (2002)
(supplemental Figure 1). The three studies produce replication profiles that are very similar in their general features: the positions of major peaks and valleys and the relative heights of peaks. In addition, previously characterized origins including ARS1501, the ADE2 ARS, andARS1502correspond to local maxima in each experiment, indicating that they were detected as active origins in all three studies (supplemental Figure 1).
Large regions of delayed replication in clb5D cells:
Although it begins at the correct time within the cell cycle, S phase in theclb5Dmutant requires nearly 50% more time for completion, presumably because origins are able to fire only in the first half of S phase, when a sufficient amount of Clb6p is present. We sought to determine whether the extension in S-phase length could be ascribed to delayed replication of particular regions of the genome (as would be expected if just a late temporal class of origins were affected; see Figure 1) or whether there was a slowdown in replication across the entire genome (as would be expected if origin firing were unordered and therefore a random half of the origins remained unfired in different cells as they ran out of Clb6p). Since our pooling method reports only relative replication timing, pooling all clb5D mutant samples collected over the whole of S phase—as we did for wild type—would fail to reveal a genomewide slowdown in S phase. Therefore, we pooled only those clb5D S-phase samples collected during a time period equivalent to the wild-type S-phase interval, thereby excluding the final 20–30% of theclb5DS phase from further analysis. As a result, if there are particular regions of theclb5Dgenome that fail to replicate within the span of a normal S phase, those regions would report severely decreased percentage of replication values in the microarray analysis. In contrast, if the clb5D cells suffer a general slowdown in S-phase pro-gression, we would see depressed values of percentage of replication throughout the genome when compared to wild type.
We again performed two separate dense isotope transfer experiments (transfer A and transfer B) for clb5Dcells and performed two sets of hybridizations per experiment (Figure 3C and supplemental Figure 2; orange profiles). The four profiles for clb5D cells are again strikingly similar to each other but show large regions that differ from the wild-type profiles (for example, see region 550–850 kb, Figure 3C) in that they are all of lower percentage of replication than wild type, indicating that they were delayed in the clb5D
mutant. We call these regions CDRs. It is particularly noteworthy that some chromosomal segments show kinetics of replication that are indistinguishable be-tween wild type and clb5D, indicating that origin activation in large blocks of the genome proceeds with the same kinetics inclb5Das in wild type as predicted by the temporal program model (Figure 1).
To establish a systematic and statistically stringent method to identify CDRs we calculated the average ab-solute difference in percentage of replication between wild-type andclb5Dprofiles at each genomic coordinate. We also performed ‘‘same-strain’’ comparisons to assess variation within each experiment by comparing the two wild-type profiles (obtained from the replicate array hybridizations) and the twoclb5Dprofiles. In addition to controlling for spurious hybridization, these compar-isons also provide a baseline for our analysis: any posi-tion where the clb5D vs. wild-type comparisons gave significantly different values from the corresponding same-strain comparisons was scored as having signifi-cantly different replication timing in theclb5Dmutant. To establish a significance cutoff, we converted allclb5D
vs. wild-type difference values to Z scores (units of standard deviation) by normalizing them to the same-strain mean and standard deviation (Figure 3D, supple-mental data 2). We defined all coordinates where the wild-typevs. clb5Dcomparison gaveZ$4.886 as CDRs since they depend on Clb5p for normal replication time (Figure 3D, horizontal dashed line). The greater the Z score, the greater the difference in percentage of replication value between wild type andclb5D(indicated in the color-coded horizontal bar in Figures 3D and 4 and in supplemental Figure 2). All CDRs have lower percentage of replication values in clb5D than in wild type; i.e., there are no regions in the genome that replicate significantly earlier in the mutant than in wild type. For simplicity of presentation and analysis, we used singular-value decomposition to combine the four repli-cation profiles for each strain into two ‘‘gold standard’’ profiles (supplemental Figure 2) (D. Collingwood,
unpublished data).
CDRs, including the region on chromosome XV described above and many subtelomeric coordinates (Figure 3 and supplemental Figure 2). Each of the late origins characterized by Donaldson et al. (1998b) resides in
CDR regions, consistent with the prediction that their replication was expected to be delayed by the absence of Clb5p. Conversely, none of the 16 centromeres, all of which on average replicate early in S phase (McCarroll
and Fangman1988; Raghuraman et al.2001), or the
early origins studied by Donaldsonet al. (1998b) fall
within CDRs. The CDR blocks show a striking con-gruence to the large blocks of delayed and slowed repli-cation seen during replirepli-cation stress in a mutant lacking the Isw2 chromatin remodeling complex (Vincentet al.
2008), underscoring the potential role of chromatin in the regulation of replication kinetics (Vogelaueret al.
2002; Donaldson2005).
Early degradation of Clb6p is responsible for origin inefficiency in theclb5Dmutant:Work by Jacksonet al.
(2006) revealed that Clb5p and Clb6p differ in their stability during the cell cycle. While they are both syn-thesized in G1, Clb6p is rapidly degraded as cells enter S
phase. Clb5p persists through the remainder of the cell cycle until it is degraded by the anaphase promoting complex in mitosis ( Jacksonet al.2006). We have
attrib-uted the appearance of CDRs in theclb5Dmutant to the temporal limitations of the active CDK and not to a potential difference in substrate specificity of the two CDKs. Consistent with this idea, Gibson et al. (2004)
found that increasing the gene dosage of CLB6 in a clb5Dstrain shortened the length of the S phase in the clb5D strain and improved the firing efficiency of two late-replicating origins,ARS603andARS1011. However, these results do not rule out the possibility that some origins have a higher affinity for Clb5-CDK than for Clb6-CDK but nevertheless can be satisfied by an in-creased concentration of Clb6-CDK in the absence of Clb5p. If the two cyclins were truly interchangeable, with no substrate specificities for different origins, then we reasoned that expressing a stable version of Clb6p in the clb5D mutant would be expected to restore the normal pattern of origin activation. On the other hand, if the specificities of the two cyclins for their targets at origins varied among different origins, we might expect to see alterations in the temporal pattern of replication even if the stable version of Clb6p was able to rescue the phenotype of lengthened S phase.
(S. Haase, personal communication; Jackson et al.
2006). This deletion removes key phosphorylation sites that target the protein for rapid ubiquitination and proteolysis, but does not destroy its ability to interact with CDK ( Jackson et al. 2006). To monitor Clb6p
abundance we tagged the C terminus of both wild-type Clb6p and Clb6pD100 with a triple hemagglutinin (33
HA) tag. Both of these modified alleles were placed under theCLB6promoter in its endogenous location in both theCLB5and theclb5Dmutant strains. As expected from previous work ( Jacksonet al. 2006), full-length
Clb6p-HAprotein appears20 min after releasing cells
from thea-factor arrest and disappears rapidly after the onset of S phase; the truncated version (Clb6pD100)
appears at the comparable time after release from the
a-factor arrest and persists at high levels over S phase (Figure 5A).
The stabilized version of Clb6p appeared to restore wild-type S-phase kinetics as judged by flow cytometric analysis (data not shown; Jacksonet al.2006). To
deter-mine what effect the Clb6D100-HA protein has on
indi-vidual origins, we analyzed two CDR origins (ARS501 and ARS603) by 2-D gel electrophoresis of genomic DNA from asynchronous cultures of the three isogenic strains,CLB5 CLB6-HA,clb5DCLB6-HA, andclb5Dclb6D100-HA.
that Clb6p is capable of efficient activation of these two origins and that the decreased firing of these origins in clb5Dcells is likely due to their late firing time and a lack of CDK activity in late S phase. Since the 2-D gel analysis was performed with DNA from asynchronous cultures, the results do not revealwhenin S phase the restored efficient activation occurs, leaving open the possibility that the Clb6D100-HAprotein does not activate origins at
the normal time, but instead alters the normal pro-gression of S phase in some unexpected manner. We therefore conducted Meselson/Stahl density transfer coupled with microarray experiments to investigate the effect of the stabilized Clb6p on the pattern of genome replication.
We harvested a late S-phase (60 min) sample from cultures of three strains:CLB5 CLB6-HA,clb5DCLB6-HA,
andclb5DCLB6D100-HA. We then labeled the HL and HH
DNAs with different fluorophores and cohybridized them to microarrays. A comparison of chromosome XV profiles shows striking differences in the shapes of the clb5D and wild-type replication profiles, reflecting precisely the differences seen in the pooled S-phase samples (Figure 5C; see specifically the region between 550 and 850 kb.) The shape of the clb6D100-HA profile, however, resembles that of the CLB5 CLB6-HA strain (Figure 5C). These results indicate that the stable allele of CLB6 not only rescues the initiation defect at pre-viously identified late origins (Figure 5B) but also restores normal replication timing to origins in the CDRs in theclb5Dmutant. It is possible that increased abundance of stabilized Clb6p could be compensating for low affinity of Clb6p-directed CDK for certain substrates. Nevertheless, because the pattern of replica-tion across all regions of chromosome XV (and other chromosomes; supplemental Figure 3 and supplemen-tal data 3) is indistinguishable from that seen forCLB5
CLB6-HA, we conclude that Clb5p and Clb6p are func-tionally redundant and do not provide qualitatively different specificities for CDK1 with regard to origin activation potential. Therefore, the delayed replication in CDRs seen in theclb5Dmutant reveals the existence of an underlying temporal pattern of origin activation (Figure 1).
Characteristics of origins that reside in CDRs:What can we learn about the origins that are replicated in the latter half of S phase? Comparison of wild-type andclb5D
replication profiles (Figures 3 and 4 and supplemental Figure 2) gives us an opportunity to distinguish between origins that fire late in S phase and those that replicate late on average because they happen to be inefficient and therefore replicated passively in a large fraction of the cell population. Although origin locations are represented generally in replication profiles as local maxima, we found it difficult to reliably identify origins within the profiles from our pooling experiments (Figure 3C; supplemental Figure 2) because they con-tained ‘‘noise,’’ potentially caused by regions of low probe density on the microarrays or by the very high level of replicated DNA in the pooled samples (81 and 74% for wild type and clb5D, respectively). Several studies have defined potential sites of replication initiation on a genomewide scale at high resolution, using criteria such as binding of replication initiation factors (Wyricket al.2001), sequence conservation of
intergenic regions among the sensu stricto species (Nieduszynski et al. 2006), and the persistence of
ssDNA formation during hydroxyurea treatment of a rad53mutant (Fenget al.2006). However, these studies
origins we performed a synchronous density transfer experiment on isogenic cells with wild-type cyclins (car-rying the cdc7ts allele to improve S-phase synchrony),
taking samples every 5 min for microarray analysis (Figure 6, supplemental Figure 4, supplemental data 4). Using stringent statistical criteria (seematerials and methods), we identified the 200 origins that contribute
most prominently to chromosomal replication profiles. All but one of the 200 have been identified as sites producing ssDNA in arad53mutant in the presence of HU (see below) and all 200 are confirmed or likely ARSs or proARSs (Wyrick et al. 2001; Nieduszynski et al.
2006, 2007). The time in S phase at which an origin first reached significance varied among these 200 origins, with no new origins appearing after 25 min. [The locations and Rad53 status (see below) of the 200 origins are indicated in Figure 4. Replication profiles and times of first activation of origins are given in supplemental Figure 4 and supplemental data 5, re-spectively.] We compared the degree of delay—by categorizing the 200 origins into CDR classes 0, 1, 2, and 3, where CDR 0 shows no delay and CDR classes 1–3 show increasing amounts of delay and dependence on Clb5p—with the time at which they first appear as significant origins in the wild type (CLB5 CLB6 cdc7ts)
S-phase experiment (first active at 10, 15, 20, or 25 min) (Figure 7A). The majority of origins that do not depend on Clb5p to maintain their on-time replication (CDR 0
origins) become active within the first 15 min of S phase (Figure 7A), whereas the majority of origins that de-pend on Clb5p for their on-time replication (CDR 1, 2, and 3) first become active in a normal S phase at20 min (Figure 7A). In general, the more delayed the replication in the clb5D strain, the later the origins become active in a wild-type S phase.
We have previously classified origins as Rad53 ‘‘un-checked’’ (those that fire in HU regardless of the cellular status of Rad53) and Rad53 ‘‘checked’’ [those that are delayed when the Rad53 checkpoint responds to the presence of HU—that is, produce ssDNA in the presence of HU only if the cells contain the rad53 mutation (Fenget al.2006)]. If Rad53 were an
impor-tant player in executing the temporal program of origin firing, we would expect to see a correlation between those Rad53 checked origins and the origins that are in CDRs. Inspecting the locations of CDRs and Rad53 checked and unchecked origins (Figure 4) indeed reveals a general correlation: many origins that are ‘‘on time’’ despite the absence of Clb5p (CDR 0 origins) are Rad53 unchecked and many origins that are delayed in the absence of Clb5p are in the Rad53 checked category of origins. The results are summarized for each CDR category in Figure 7B and substantiate this general conclusion.
neighbors by$50 kb. At this distance, the accumulation of HL DNA over the first 25 min of S phase at each of these origins is more likely to reflect initiation at that origin and less likely to be the consequence of passive replication from adjacent origins. By calculating the change in percentage of replication from one time in S phase to the next we can determine the interval in S phase in which the majority of origin activation takes place.
The earliest origins (unchecked, non-CDR) show a sharp peak of activation that is limited to the first few sampling intervals, while checked, CDR origins show a broad distribution of activity over several intervals (Figure 7C). By summing the change in percentage of replication over all of the intervals, we can also estimate efficiency. The early (non-CDR, Rad53 unchecked) origins are in general more efficient that the later origins (CDR, Rad53 checked), a difference that is likely due at least in part to passive replication obscuring origin activation at later times. Only 2 of the 64 origins can be described as being neither early nor late, but pan-S, akin to the pan-S activation class proposed for human replication origins ( Jeonet al.2005). This minority class
of origins fits the characterization of ‘‘disordered, stochastic firing’’—i.e., having no peak time of firing or having such a broad distribution about a peak that they appear disordered.
There are exceptions to the correlation between Rad53 checking and CDR status. Among the 200 most active origins some unchecked origins are delayed in theclb5Dstrain while some checked origins replicate on time. Many of the latter category can be explained by their proximity to early efficient origins. In these cases, forks from the early origins maintain on-time tion of the adjacent genomic region by passive replica-tion. While that particular late origin might not fire in theclb5Dmutant, its general time of replication is not greatly delayed. (The mean distance between the checked non-CDR origins and their closest unchecked non-CDR origin is 40 kb.) The former category— unchecked origins that are delayed in theclb5Dmutant— could result from two scenarios:
1. The origin is indeed early, but inefficient, relying on passive replication from nearby origins in a large fraction of cells. Consequently, any diminution in forks from outlying regions would cause that origin to appear to be Clb5 dependent. Many of the delayed but Rad53 unchecked origins fit this explanation. They are often at great distance from an unchecked, on-time origin. (The mean distance between the unchecked CDR origins and their closest unchecked non-CDR origin is 123 kb.)
2. The origin is not restricted to a narrow window of S phase for its activation but is a pan-S origin, activated over a broad distribution of activation times in different cells in the population. In these cases, the
origin would be detected in the ssDNA assay as an unchecked origin, but full activation potential can-not be realized in theclb5Dmutant because of those cells in which the origin would be activated later.
DISCUSSION
Over the last few years, discussion in the literature (e.g., Rhind2006) has questioned the general existence
of temporal programming of origin activation in eukar-yotes and has suggested that the budding yeast S. cerevisiaemay be an exception to the rule in having such a program. A more recent report based on visual examination of stretched S. cerevisiae chromosome VI DNA fibers has called even that exception into question and has raised the possibility that origin firing in S. cerevisiaeis disordered as well (Czajkowskyet al.2008).
Is the long-standing picture of programmed, temporally staggered origin activations really a misleading aggre-gate emerging from a population of cells that individ-ually have heterogeneous patterns of origin activation— with what had previously been called early origins actually reflecting efficient activation (with no particu-lar temporal tendency) and late origins reflecting inef-ficient activation?
Here, by examining the dynamics of replication in a clb5Dmutant (where origin activation can occur only in the first part of S phase, driven by the short-lived Clb6p) we show that there are indeed temporal classes of origins in S. cerevisiae—some regions of the genome replicate with kinetics indistinguishable from those of a normal S phase, while other large blocks of the genome, containing what had been referred to as late origins, are severely delayed in replication. This distinction between origins is not a consequence of differences in substrate specificity between Clb5p and Clb6p, as the delayed replication phenotype can be rescued completely by the expression of a long-lived version of Clb6p (Figure 5; Jackson et al.2006). These results are exactly as
pre-dicted for temporally staggered origin activation—those origins that fire early in S phase are able to fire normally in the clb5D strain (during a time when Clb6p is still available) while origins that would fire later in S phase are largely unable to fire as the cells run out of the rapidly degraded Clb6p. These conclusions are also fully consistent with studies showing distinct replication times for different single-origin plasmids, where varia-tion in firing efficiency is not a factor (Fergusonet al.
1991; Ferguson and Fangman1992; Friedman et al.
1996; Donaldsonet al.1998b).
How do our observations fit with the interpretations of single-molecule studies of replication inS. cerevisiae andS. pombe(Patelet al.2006; Czajkowskyet al.2008)?
(Rhind2006; Lygeroset al.2008) are in fact
compat-ible with temporally staggered initiation. We suggest that the apparent diversity of views regarding the pres-ence or abspres-ence of a temporal program may be a false dichotomy that stems in part from a lack of consensus on terminology and the concomitant confusion in the interpretation of models. The termorigin efficiency, for example, has been used in ways that could be taken to mean the probability of origin firing in a particular interval within S phase, the overall probability that an origin can fire at all, and the ability of an origin to recruit/use limiting initiation factors (e.g., Patelet al.
2006; Rhind2006). In our view, origin efficiency is none
of the above and is best reserved to describe an em-pirical value,the percentage of cells in a population that is observed to have fired a particular origin. A perhaps more biologically interesting property is origincompetence— the percentage of cells in which an origin is biochemi-cally competent to fire (Figure 8A). For example, poor loading of the origin recognition complex (ORC) or other components of the prereplicative complex (pre-RC) could result in some cells in the population not being able to fire an origin. An origin that is competent to fire nevertheless may be kinetically limited in its ability to complete the initiation reaction in a timely fashion—and therefore fail to fire in some cells in the population if it is replicated passively (i.e., gets run over by incoming forks) before it has a chance to fire (Figure 8A). The combination of origin competence and passive replication together must account for origin efficiency
in all species, perhaps with variation in competence being more of a factor in some species compared to others.
Thus, origins may be ,100% efficient because they are not competent to fire in some cells, because they are replicated passively in some cells despite being compe-tent to fire, or both: the observed % efficiency ¼ % competence% passive replication of the competent origins (Figure 8A). Single-origin plasmids (where passive replication is not a factor) illustrate differences in origin competence and/or kinetic limitation. For example, rDNA ARS plasmids are lost at a high rate
(Kouprinaand Larionov 1983) presumably because
the rDNA ARS shows poor competence. In contrast, some single-origin plasmids are late replicating but nevertheless do not show elevated loss rates (Donaldson
et al. 1998b)—indicating that their origins are highly competent but are perhaps slower to recruit initiation factors, as noted above forARS1502on the chromosome (Figure 2).
a broader distribution with a lower mode. Variation in mean and distribution of firing times is clearly discern-ible in the replication kinetics of single-origin plasmids, where replication is a direct indicator of origin firing (Figure 8B; Friedmanet al.1996). Overlap in the
firing-time distributions (Figures 7C and 8B) for different origins could result in apparent disordered firing in some chromosomes in the population. The 2-D gels of ARS607and ARS1502through a synchronous S phase (Figure 2A) also illustrate both the differences in mean firing time and the overlap in their distributions. Note thatARS607shows normal levels of firing at 30 min in theclb5DS phase (Figure 2B), butARS1502at the same time shows reduced firing—consistent with the idea that the two origins kinetically are different in their ability to interact with Clb-CDK and suggesting that Clb-CDK could well be the limiting factor that leads to staggered firing. Finally, dynamic processes such as chromatin remodeling and cell-to-cell heterogeneity in chromatin structure could further shape the overall topography of replication in the population.
Variation in affinity for a limiting initiation factor (Rhind 2006; Lygeros et al. 2008) is one possible
mechanism underlying the temporal differences be-tween origins. If so, one might expect late-origin firing-time distributions to be wider and shallower than those for early origins (Figure 8B), which indeed is what we observe in the comparison of the earliest and the latest origins (Figure 7C). Such differences between origins could arise from intrinsic variation in their affinities for initiation factors (perhaps influenced by the local DNA sequence), variation in occupancy by ORC/pre-RCs, variation in chromatin compaction across the genome
(Gilbert et al. 2004; Donaldson 2005), or some
combination thereof. Indeed, the observation that relocating origins to ectopic sites in the genome can change their firing time (e.g., Fergusonand Fangman
1992) indicates that chromosomal context must matter. Regardless of mechanism, the resulting temporal vari-ation in probability of firing is what we would call a temporal program of origin activation.
Despite the possibility of overlap in the distributions of origin firing times, the genome nevertheless is organized into non-CDR and CDR blocks (Figure 4) largely paralleling the blocks of origins described as firing or not firing in the presence of HU (Yabukiet al.
2002; Feng et al. 2006). Permutation tests in which
origins are randomly labeled as CDR or non-CDR show that the actual genomic organization of origins into CDR and non-CDR clusters is very significantly different from a random distribution (data not shown). Clusters of origins with similar activation timing have been qualitatively observed in yeast and mammals (Hand
1975; Rivinand Fangman1980; Reynoldset al.1989;
Friedmanet al.1996), perhaps reflecting an underlying
organization of chromatin or higher-order chromo-somal domains. Such clustering of temporally similar
origins could result in a scenario where stochastic properties allow some disorder of firing within blocks while still maintaining a genome organization of fairly distinct temporal blocks—and in fact, large-scale tem-poral organization of the genome indeed has been discussed as a possibility (Czajkowsky et al. 2008).
Some combination of reduced cluster size and dynamic reorganization of chromatin could result in blurring of the temporal program in other species.
We thank Christina Wilson, Anne Donaldson, Wenyi Feng, Kim Lindstrom, and Conrad Nieduszynski for technical assistance, strain construction, helpful discussions, and critical comments on the manuscript. We thank Zasha Weinberg for providing us with an algorithm for simulating replication profiles and Andy Marty for help with microarray hybridizations. We are grateful to Thomas Lumley for statistical assistance. This work was supported by National Institute of General Medical Sciences grant 18926 to B.J.B., M.K.R., and W.L.F. H.J.M. was supported in part by a National Science Foundation predoctoral fellowship and by a National Institutes of Health genetics training grant at the University of Washington.
LITERATURE CITED
Alvino, G. M., D. Collingwood, J. M. Murphy, J. Delrow, B. J.
Brewer et al., 2007 Replication in hydroxyurea: it’s a matter
of time. Mol. Cell. Biol.27:6396–6406.
Benjamini, Y., and Y. Hochberg, 1995 Controlling the false
discov-ery rate: a practical and powerful approach to multiple testing. J. R. Stat. Soc. Ser. B57:289–300.
Brewer, B. J., and W. L. Fangman, 1987 The localization of
replica-tion origins on ARS plasmids inS. cerevisiae.Cell51:463–471. Brewer, B. J., D. Lockshonand W. L. Fangman, 1992 The arrest of
replication forks in the rDNA of yeast occurs independently of transcription. Cell71:267–276.
Colantuoni, C., G. Henry, S. Zegerand J. Pevsner, 2002 SNOMAD
(Standardization and NOrmalization of MicroArray Data): web-accessible gene expression data analysis. Bioinformatics 18: 1540–1541.
Czajkowsky, D. M., J. Liu, J. L. Hamlinand Z. Shao, 2008 DNA
combing reveals intrinsic temporal disorder in the replication of yeast chromosome VI. J. Mol. Biol.375:12–19.
Donaldson, A. D., 2005 Shaping time: chromatin structure and the
DNA replication programme. Trends Genet.21:444–449. Donaldson, A. D., W. L. Fangmanand B. J. Brewer, 1998a Cdc7 is
required throughout the yeast S phase to activate replication ori-gins. Genes Dev.12:491–501.
Donaldson, A. D., M. K. Raghuraman, K. L. Friedman, F. R. Cross,
B. J. Breweret al., 1998b CLB5-dependent activation of late
replication origins inS. cerevisiae.Mol. Cell2:173–182. Epstein, C. B., and F. R. Cross, 1992 CLB5: a novel B cyclin from
budding yeast with a role in S phase. Genes Dev.6:1695–1706. Fazzio, T. G., C. Kooperberg, J. P. Goldmark, C. Neal, R. Basom
et al., 2001 Widespread collaboration of Isw2 and Sin3-Rpd3 chromatin remodeling complexes in transcriptional repression. Mol. Cell. Biol.21:6450–6460.
Feng, W., D. Collingwood, M. E. Boeck, L. A. Fox, G. M. Alvino
et al., 2006 Genomic mapping of single-stranded DNA in hy-droxyurea-challenged yeasts identifies origins of replication. Nat. Cell Biol.8:148–155.
Ferguson, B. M., and W. L. Fangman, 1992 A position effect on the
time of replication origin activation in yeast. Cell68:333–339. Ferguson, B. M., B. J. Brewer, A. E. Reynoldsand W. L. Fangman,
1991 A yeast origin of replication is activated late in S phase. Cell65:507–515.
Friedman, K. L., M. K. Raghuraman, W. L. Fangman and B. J.
Brewer, 1995 Analysis of the temporal program of replication
initiation in yeast. J. Cell Sci. (Suppl.)19:51–58.
Friedman, K. L., J. D. Diller, B. M. Ferguson, S. V. Nyland, B. J.
activa-tion of yeast replicaactiva-tion origins late in S phase. Genes Dev.10: 1595–1607.
Friedman, K. L., B. J. Brewerand W. L. Fangman, 1997 Replication
profile ofSaccharomyces cerevisiaechromosome VI. Genes Cells2: 667–678.
Gibson, D. G., J. G. Aparicio, F. Hu and O. M. Aparicio,
2004 Diminished S-phase cyclin-dependent kinase function elicits vital Rad53-dependent checkpoint responses in Saccharo-myces cerevisiae.Mol. Cell. Biol.24:10208–10222.
Gilbert, N., S. Boyle, H. Fiegler, K. Woodfine, N. P. Carteret al.,
2004 Chromatin architecture of the human genome: gene-rich do-mains are enriched in open chromatin fibers. Cell118:555–566. Hand, R., 1975 Regulation of DNA replication on subchromosomal
units of mammalian cells. J. Cell Biol.64:89–97.
Huberman, J. A., L. D. Spotila, K. A. Nawotka, S. M.el-Assouliand
L. R. Davis, 1987 The in vivo replication origin of the yeast 2
microns plasmid. Cell51:473–481.
Jackson, L. P., S. I. Reedand S. B. Haase, 2006 Distinct mechanisms
control the stability of the related S-phase cyclins Clb5 and Clb6. Mol. Cell. Biol.26:2456–2466.
Jeon, Y., S. Bekiranov, N. Karnani, P. Kapranov, S. Ghoshet al.,
2005 Temporal profile of replication of human chromosomes. Proc. Natl. Acad. Sci. USA102:6419–6424.
Koning, A. J., L. L. Larson, E. J. Cadera, M. L. Parrishand R. L.
Wright, 2002 Mutations that affect vacuole biogenesis inhibit
proliferation of the endoplasmic reticulum inSaccharomyces cere-visiae.Genetics160:1335–1352.
Kouprina, N. Y., and V. L. Larionov, 1983 The study of a rDNA
rep-licator in Saccharomyces. Curr. Genet.7:433–438.
Ku¨ hne, C., and P. Linder, 1993 A new pair of B-type cyclins from
Saccharomyces cerevisiaethat function early in the cell cycle. EMBO J.12:3437–3447.
Longtine, M. S., A. McKenzie 3rd, D. J. Demarini, N. G. Shah,
A. Wachet al., 1998 Additional modules for versatile and
eco-nomical PCR-based gene deletion and modification in Saccharo-myces cerevisiae.Yeast14:953–961.
Lygeros, J., K. Koutroumpas, S. Dimopoulos, I. Legouras,
P. Kouretaset al., 2008 Stochastic hybrid modeling of DNA
replication across a complete genome. Proc. Natl. Acad. Sci. USA105:12295–12300.
McCarroll, R. M., and W. L. Fangman, 1988 Time of replication of
yeast centromeres and telomeres. Cell54:505–513.
Mendenhall, M. D., and A. E. Hodge, 1998 Regulation of Cdc28
cyclin-dependent protein kinase activity during the cell cycle of the yeast Saccharomyces cerevisiae.Microbiol. Mol. Biol. Rev. 62:1191–1243.
Nash, R., G. Tokiwa, S. Anand, K. Ericksonand A. B. Futcher,
1988 TheWHI11gene of Saccharomyces cerevisiaetethers cell
division to cell size and is a cyclin homolog. EMBO J.7:4335– 4346.
Nieduszynski, C. A., Y. Knoxand A. D. Donaldson, 2006
Genome-wide identification of replication origins in yeast by comparative genomics. Genes Dev.20:1874–1879.
Nieduszynski, C. A., S. Hiraga, P. Ak, C. J. Benham and A. D.
Donaldson, 2007 OriDB: a DNA replication origin database.
Nucleic Acids Res.35:D40–D46.
Patel, P. K., B. Arcangioli, S. P. Baker, A. Bensimonand N. Rhind,
2006 DNA replication origins fire stochastically in fission yeast. Mol. Biol. Cell17:308–316.
Raghuraman, M. K., E. A. Winzeler, D. Collingwood, S. Hunt,
L. Wodickaet al., 2001 Replication dynamics of the yeast
ge-nome. Science294:115–121.
Reynolds, A. E., R. M. McCarroll, C. S. Newlonand W. L. Fangman,
1989 Time of replication of ARS elements along yeast chromo-some III. Mol. Cell. Biol.9:4488–4494.
Rhind, N., 2006 DNA replication timing: random thoughts about
origin firing. Nat. Cell Biol.8:1313–1316.
Rivin, C. J., and W. L. Fangman, 1980 Replication fork rate and
or-igin activation during the S phase of Saccharomyces cerevisiae. J. Cell Biol.85:108–115.
Rose, M. D., and F. Winston, 1990 Methods in Yeast Genetics: A
Lab-oratory Course Manual. Cold Spring Harbor Laboratory Press, Cold Spring Harbor, NY.
Schwob, E., and K. Nasmyth, 1993 CLB5andCLB6, a new pair of
B-cyclins involved in DNA replication in Saccharomyces cerevisiae. Genes Dev.7:1160–1175.
Vincent, J. A., T. J. Kwongand T. Tsukiyama, 2008 ATP-dependent
chromatin remodeling shapes the DNA replication landscape. Nat. Struct. Mol. Biol.15:477–484.
Vogelauer, M., L. Rubbi, I. Lucas, B. J. Brewerand M. Grunstein,
2002 Histone acetylation regulates the time of replication ori-gin firing. Mol. Cell10:1223–1233.
Wyrick, J. J., J. G. Aparicio, T. Chen, J. D. Barnett, E. G. Jennings
et al., 2001 Genome-wide distribution of ORC and MCM pro-teins inS. cerevisiae: high-resolution mapping of replication ori-gins. Science294:2357–2360.
Yabuki, N., H. Terashimaand K. Kitada, 2002 Mapping of early
firing origins on a replication profile of budding yeast. Genes Cells7:781–789.
Yamashita, M., Y. Hori, T. Shinomiya, C. Obuse, T. Tsurimotoet al.,
1997 The efficiency and timing of initiation of replication of multiple replicons of Saccharomyces cerevisiae chromosome VI. Genes Cells2:655–665.