Edge Detection of MRI Scan Neck Image
Using Canny Edge Detection Algorithm Based
on Density of Edge Length
J.Anish Jafrin Thilak1, Dr.P.Suresh2, N.Subramani3, S.Sathishkumar4, V.V.Arunsankar5
Assistant Professor, Department of Mechanical Engineering, Karpagam College of Engineering,
Coimbatore, India1,3,4&5
Professor, Department of Mechanical Engineering, Karpagam College of Engineering, Coimbatore, India2
ABSTRACT: Neck is robot part for human. The robotic platform of the neck bone was surrounded by muscles like steel spring the neck has a significant amount of movement and supports the weight of the head, but it is less protected than the rest of the neck, the neck can be vulnerable to injury and disorders that produce pain and restrict motion. In this work Density of Edge Length based Canny Edge Detection Algorithm has been proposed to pre processing of boundary detection of the MRI Scan Neck image. To find the correct boundary in noisy image of neck is still a difficult one. The proposed Canny Edge Detection algorithm has been used to detect the boundaries of neck image from the noisy image. The performance of proposed technique has been verified and validated with the standard medical values. The results show that the proposed technique performs well and produced very near to the optimal solution. This method is robust for all kinds of noisy images.
KEYWORDS: MRI Scan, Neck image, Edge Length and Canny Edge Detection Algorithm
I. INTRODUCTION
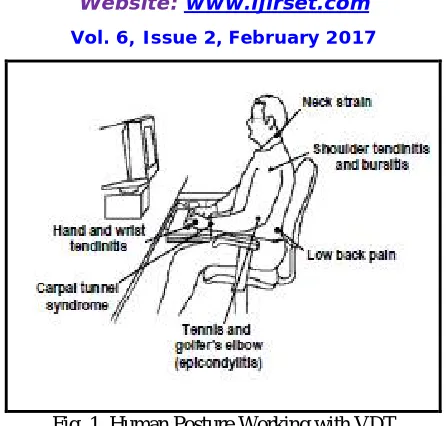
Fig. 1. Human Posture Working with VDT
Most cervical problems are due to degenerative changes that occur in the s and joints of the neck. Degenerative changes that affect the structures of the neck can cause the neck canal to become too narrow, a condition called neck stenosis. This may lead to pressure on the neck cord. Bone spurs that stick into the neck canal take up space, making the neck canal smaller. They can press against the neck cord or nerve roots. Pressure on the neck cord from neck stenosis can cause symptoms of myelopathy. Myelopathy may impair normal walking, hand and finger use, and bowel and bladder function. Doctors take these symptoms very seriously because severe myelopathy that is not treated may lead to permanent nerve or neck cord damage. Pressure on nearby nerve roots can cause radiculopathy and may produce pain, weakness, or sensory changes in the area supplied by nerves that go from the cervical neck to the shoulder, arm, or hand. The disk acts as a shock absorber between the bones in the neck. In cervical disk degeneration the normal gelatin-like centre of the disk degenerates and the space between the vertebrae narrows. As the disk space narrows, added stress is applied to the joints of the neck causing further wear and degenerative disease. The cervical disk may also protrude and put pressure on the neck cord or nerve roots when the rim of the disk weakens. This is known as a herniated cervical disk.
The neck is so flexible and it supports the head, it is extremely vulnerable to injury. Motor vehicle or diving accidents, contact sports, and falls may result in neck injury. The regular use of safety belts in motor vehicles can help to prevent or minimize neck injury. A "rear end" automobile collision may result in hyperextension, a backward motion of the neck beyond normal limits, or hyper flexion, a forward motion of the neck beyond normal limits. The most common neck injuries involve the soft tissues: the muscles and ligaments. Severe neck injuries with a fracture or dislocation of the neck may damage the neck cord and cause paralysis. The main focus of this work is to automatically detect the reason for neck pain from plain diagnostic x-rays using a series of sequential steps. Fig.1 shows the schematic diagram of Human neck.
A. BONE SPURS IN THE BACK AND NECK
Bone spurs, also called osteophytes, are enlargements of your body’s normal bone structure. As these enlargements progress, they may protrude into surrounding tissues, sometimes causing pain and other symptoms. Bone spurs can occur on virtually any bone, including on your vertebrae, but contrary to their name, they do not actually create a point. Rather, they are smooth structures that your body creates to repair itself after bones are exposed to pressure, stress, or rubbing over time. Bones conform to any pressure applied to them, and through the years, tendons (which hold muscle to bone) and ligaments (which hold bone to bone) can start to pull the bone from where it should be, stimulating the creation of bone spurs. As these protrusions grow and form, they sometimes impinge on a nerve, causing pain and debilitating symptoms. This figure is Bony Spurs in neck, colored X-ray. Bony spurs (osteophytes) grow from the vertebrae as a normal part of the aging process. They stabilize the neck when the s of cartilage between the vertebrae shrink and become less flexible.
Types of Bone Spurs
o Neck Bone Spurs o Neck Bone Spurs o Cervical Bone Spurs o Lumbar Bone Spurs
B. NECK BONES
There are 7 vertebrae (bones) in the neck.
Together they form the upper-most section of the vertebral column which is known as the "cervical neck". They are labelled C1 to C7 with C1 at the top and C7 furthest from the head and adjoining the first vertebra of
the next section of the neck.
Only two of the vertebrae of the cervical neck also have individual names. They are C1 which is called the "Atlas" bone, and C2 which is called the "Axis" bone. The atlas and axis bones are labelled on the diagram (above-right).
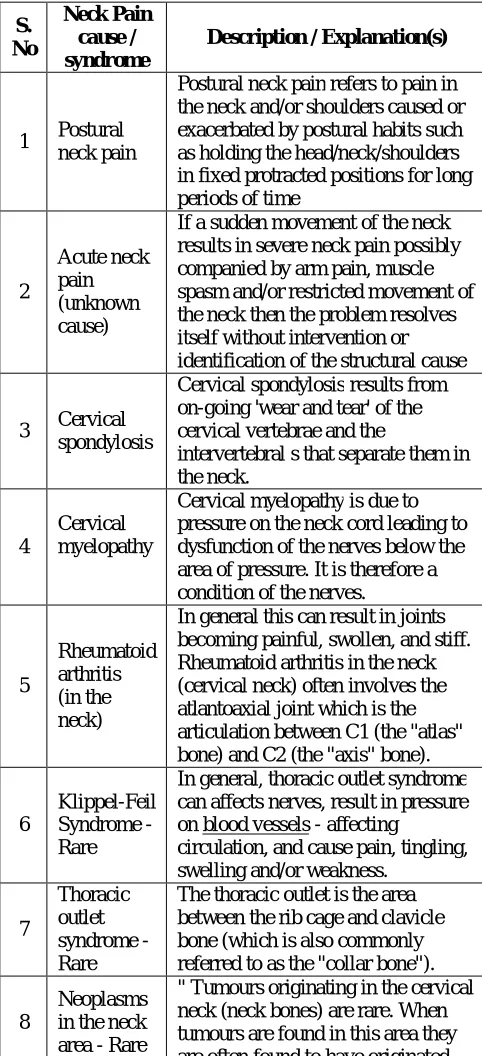
Table. 1. Types of neck pain and its causes S. No Neck Pain cause / syndrome
Description / Explanation(s)
1 Postural neck pain
Postural neck pain refers to pain in the neck and/or shoulders caused or exacerbated by postural habits such as holding the head/neck/shoulders in fixed protracted positions for long periods of time
2
Acute neck pain (unknown cause)
If a sudden movement of the neck results in severe neck pain possibly companied by arm pain, muscle spasm and/or restricted movement of the neck then the problem resolves itself without intervention or identification of the structural cause
3 Cervical spondylosis
Cervical spondylosis results from on-going 'wear and tear' of the cervical vertebrae and the
intervertebral s that separate them in the neck.
4
Cervical myelopathy
Cervical myelopathy is due to pressure on the neck cord leading to dysfunction of the nerves below the area of pressure. It is therefore a condition of the nerves.
5
Rheumatoid arthritis (in the neck)
In general this can result in joints becoming painful, swollen, and stiff. Rheumatoid arthritis in the neck (cervical neck) often involves the atlantoaxial joint which is the articulation between C1 (the "atlas" bone) and C2 (the "axis" bone).
6
Klippel-Feil Syndrome - Rare
In general, thoracic outlet syndrome can affects nerves, result in pressure on blood vessels - affecting
circulation, and cause pain, tingling, swelling and/or weakness.
7
Thoracic outlet syndrome - Rare
The thoracic outlet is the area between the rib cage and clavicle bone (which is also commonly referred to as the "collar bone").
8
Neoplasms in the neck area - Rare
elsewhere in the body and are therefore said to be "secondary deposits".
9
Osteitis in the neck area - Rare
Osteitis is a general term for inflammation of bone.
Osteitis in the neck area (called "cervical neck osteitis") is uncommon, but not unheard-of, in many developed countries.
Fig. 3. Description of the neck
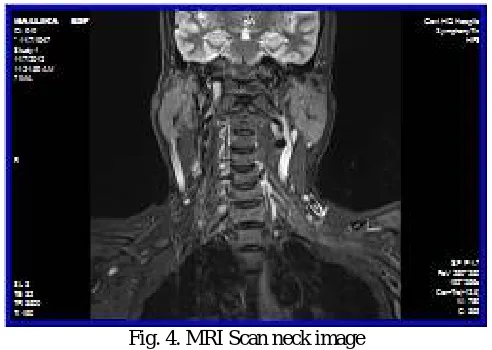
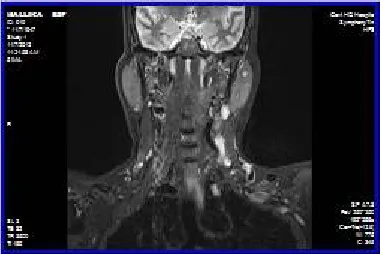
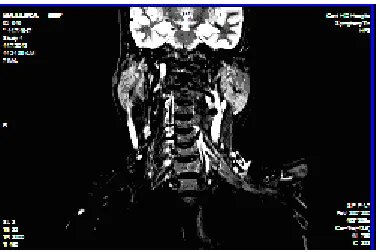
Fig. 4. MRI Scan neck image
Table 2: Empirical Quantities of Neck bones
Material Young’s
Modulus (Mpa)
Cross Section
Area(mm2)
Anterior
Longitudinal 7.8 63.7 Posterior
Longitudinal 10 20.0 Ligamentum Flavum 15 40.0
Transverse 10 3.60
Capsular 705 60.0
Interspinus 10 40.0
Superspinus 8 30.0
Iliolumbar 10 26.4
II. PROPOSED WORK SEQUENCE
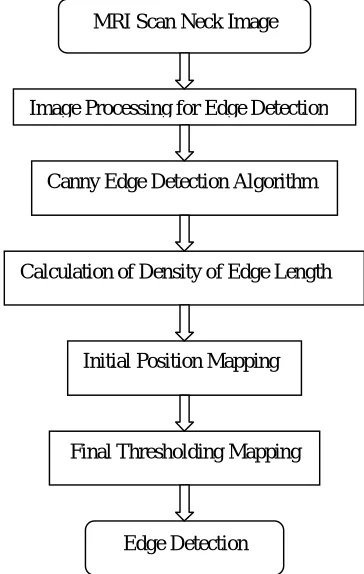
The Block diagram of the proposed system of Image edge detection technique is shown in Fig.5. The different process sequence is involved in this system is given in below. The Original image is obtained from the MRI Scan image centre and then it will be incorporated by using canny Edge Detection algorithm based on density of edge length. The results have been verified and analysed.
Fig.5. Flow diagram of proposed method MRI Scan Neck Image
Edge Detection
Image Processing for Edge Detection
Canny Edge Detection Algorithm
Calculation of Density of Edge Length
Initial Position Mapping
III. CANNY EDGE DETECTION ALGORITHM
The Canny algorithm can be used an optimal edge detector based on a set of criteria which include finding the most edges by minimizing the error rate, marking edges as closely as possible to the actual edges to maximize localization, and marking edges only once when a single edge exists for minimal response. According to Canny, the optimal filter that meets all three criteria above can be efficiently approximated using the first derivative of a Gaussian function.
---[1]
Step 1: Calculate the average magnitude
---[2]
Step 2: Calculate the density of the edge lengthThe density of the edge length is calculated from
---[3]
Where C(i,j) is the number of connected pixels at each position of pixel.
Step 3: Calculate the Initial position of map from summation of density of edge Length and average magnitude.
---[4]
Step 4: Calculate the thresholding of the initial position map. If
---[5]
Fig.6. (a). MRI Scan Noisy Neck image, (b). Average Magnitude Image, (c). Density of the Edge Length, (d). Processing Sequence, (d). Initial Position map,
(e). Final Thresholding of edge map
From the above figure 6(a) to 6(e) and the analysis we can able to predict the proper and suitable initial position.
A. FINAL FILTERING
Using a statistical test and we are able to obtain the intensity of the neck image.
(7) ---[6]
Statistical test is also known as Hypothesis test. The filtering process is ended with high resolution edge value. The Fig 7(a) to 7(e) shown that the final filtering process sequence with final filtered images. The output image is having high resolution of filtered surface. Fig. 8 Shows the Graphical noise signal in each stage.
Fig 7 (b). Initial filtered image
Fig 7 (c). Binary Edge detection image
Fig 7 (e). Final corrected edge filtered image
Fig 8 (a). A Normal Neck image Noise Signal
Fig 8 (b). Initial filtered image Noise Signal
Fig 8 (d). Edge corrected image Noise Signal
Fig 8 (e). Final corrected edge filtered Noise signal
IV.RESULTS AND DISCUSSION
To further evaluate the efficiency of the proposed method in addition to the visual inspection, the proposed boundary detection method numerically using the Hausdorff distance and the probability of error in image segmentation. Where P(O) and P(B) are probabilities of objects and background in images. The objects surrounded by the contours obtained using the five snake models and the proposed method are compared with that manually drawn by skilled doctors from the Medical Hospital.
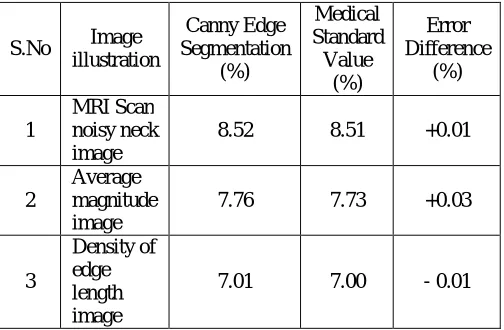
Table 3. Average Results of Probability of Error in Image Segmentation
S.No Image illustration
Canny Edge Segmentation
(%)
Medical Standard Value
(%)
Error Difference
(%)
1
MRI Scan noisy neck image
8.52 8.51 +0.01
2
Average magnitude image
7.76 7.73 +0.03
3
Density of edge length image
4
Filtered MRI Scan image
6.43 6.44 - 0.01
5
Initial position map
5.92 5.90 0.02
6
Fine Edge filtered image
5.11 5.07 0.04
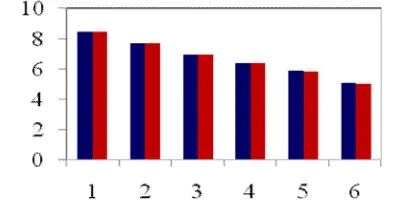
From the above Table.3 shows the average results of probability of Error in Image segmentation of canny edge detection algorithm and Medical standard value and also predicts the error difference. Showing the results it shows the Error difference value is very minimal and also negligible. So the proposed techniques produced nearer to the standard value. Fig.9 Shows the comparative analysis of canny edge detection value and the Medical standard value which is collected from the standard Hospital.
Fig 9. Comparative Analysis Graph for Canny Edge Detection value and Medical Standard value
V. CONCLUSION
The proposed technique for boundary detection is applied it to neck image. Our edge following technique incorporates a vector image model and the edge map information. The proposed technique was applied to detect the object boundaries of noisy MRI Scan neck image where the well defined edges were encountered. The opinions of the skilled doctors were used as the ground truths of interesting object of neck. Besides the visual inspection, the proposed method was verified and evaluated using the probability of error. The results of detecting the object boundaries in noisy images show that the proposed technique is very close to the standard value which was given by eminent doctors. We have successfully applied the edge following technique to detect the object boundaries of neck image. The proposed method can be applied not only for medical imaging, but can also be applied to any image processing problems.
REFERENCES
[1] Brenner DJ, Elliston CD, Hall EJ, Berdon WE (2001) Estimated risks of radiation-induced fatal cancer from pediatric CT. AJR Am J Roentgenol 176:289–296
[2] Tzedakis A, Damilakis J, Perisinakis K, Stratakis J, Gourtsoyiannis N (2005) The effect of z overscanning on patient effective dose from multidetector helical computed tomography examinations. Med Phys 32:1621–1629
[3] Boone JM, Seibert JA (1997) An accurate method for computer-generating tungsten anode X-ray spectra from 30 to 140 kV. Med Phys 24:1661–1670
[4] Eckerman KF, Cristy M, Ryman JC (1996) The ORNL mathematical phantom series. Oak Ridge National Laboratory, Oak Ridge, Tenn [5] Siemens (2002) SOMATOM Sensation 16 application guide: routine protocols.Siemens, Forchheim
[7] Theocharopoulos N, Perisinakis K, Damilakis J, Karampekios S, Gourtsoyiannis N (2006) Dosimetric characteristics of a 16-slice computed tomography scanner. Eur Radiol Apr 22
[8] Bacher K, Bogaert E, Lapere R, De Wolf D, Thierens H (2005) Patientspecific dose and radiation risk estimation in pediatric cardiac catheterization. Circulation 111:83–89
[9] Mazonakis M, Damilakis J, Raissaki M, Gourtsoyiannis N (2004) Radiation dose and cancer risk to children undergoing skull radiography. Pediatr Radiol 34:624–629.
[10] F. Bergholm. “Edge focusing,” in Proc. 8th Int. Conf. Pattern Recognition, Paris, France, pp. 597- 600, 1986. [11] R. C. Gonzalez and R. E. Woods. “Digital Image Processing”. 2nd ed. Prentice Hall, 2002.
[12] V. Torre and T. A. Poggio. “On edge detection”. IEEE Trans. Pattern Anal. Machine Intell., vol. PAMI-8, no. 2, pp. 187-163, Mar. 1986. [13] E. R. Davies. “Constraints on the design of template masks for edge detection”. Partern Recognition Lett., vol. 4, pp. 11 1-120, Apr. 1986. [14] W. Frei and C.-C. Chen. “Fast boundary detection: A generalization and a new algorithm ”. lEEE Trans. Comput., vol. C-26, no. 10, pp.
988-998, 1977.
[15] W. E. Grimson and E. C. Hildreth. “Comments on Digital step edges from zero crossings of second directional derivatives’’. IEEE Trans. Pattern Anal. Machine Intel., vol. PAMI-7, no. 1, pp. 121-129, 1985.
[16] R. M. Haralick. “Digital step edges from zero crossing of the second directional derivatives,” IEEE Trans. Pattern Anal. Machine Intell., vol. PAMI-6, no. 1, pp. 58-68, Jan. 1984.
[17] J. F. Canny. “A computational approach to edge detection”. IEEE Trans. Pattern Anal. Machine Intell., vol. PAMI-8, no. 6, pp. 679-697, 1986 [18] J. Canny. “Finding edges and lines in image”. Master’s thesis, MIT, 1983.